Africa Biopesticides Market Size

| Icons | Lable | Value |
|---|---|---|
|
|
Study Period | 2017 - 2029 |
|
|
Base Year For Estimation | 2022 |
|
|
CAGR | 10.77 % |
|
|
Largest Share by Form | Biofungicides |
|
|
Largest Share by Country | Nigeria |
|
|
Market Concentration | High |
Major Players |
||
|
|
||
|
*Disclaimer: Major Players sorted in no particular order |
Africa Biopesticides Market Analysis
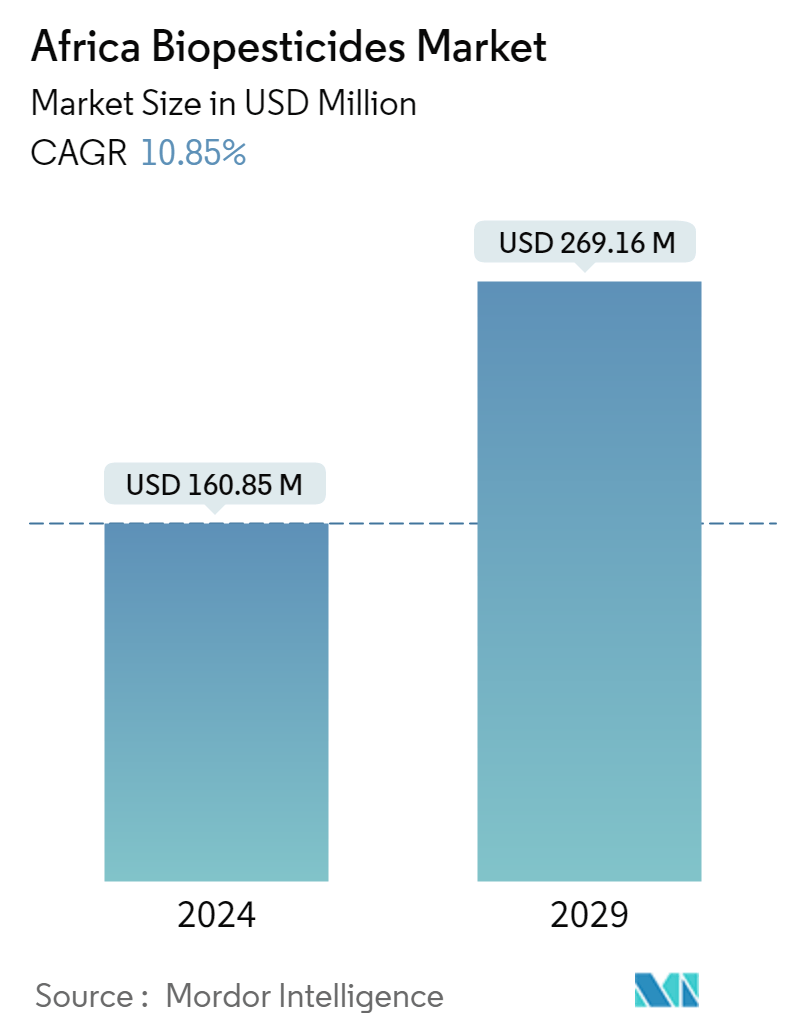
The Africa Biopesticides Market is projected to register a CAGR of 10.77%
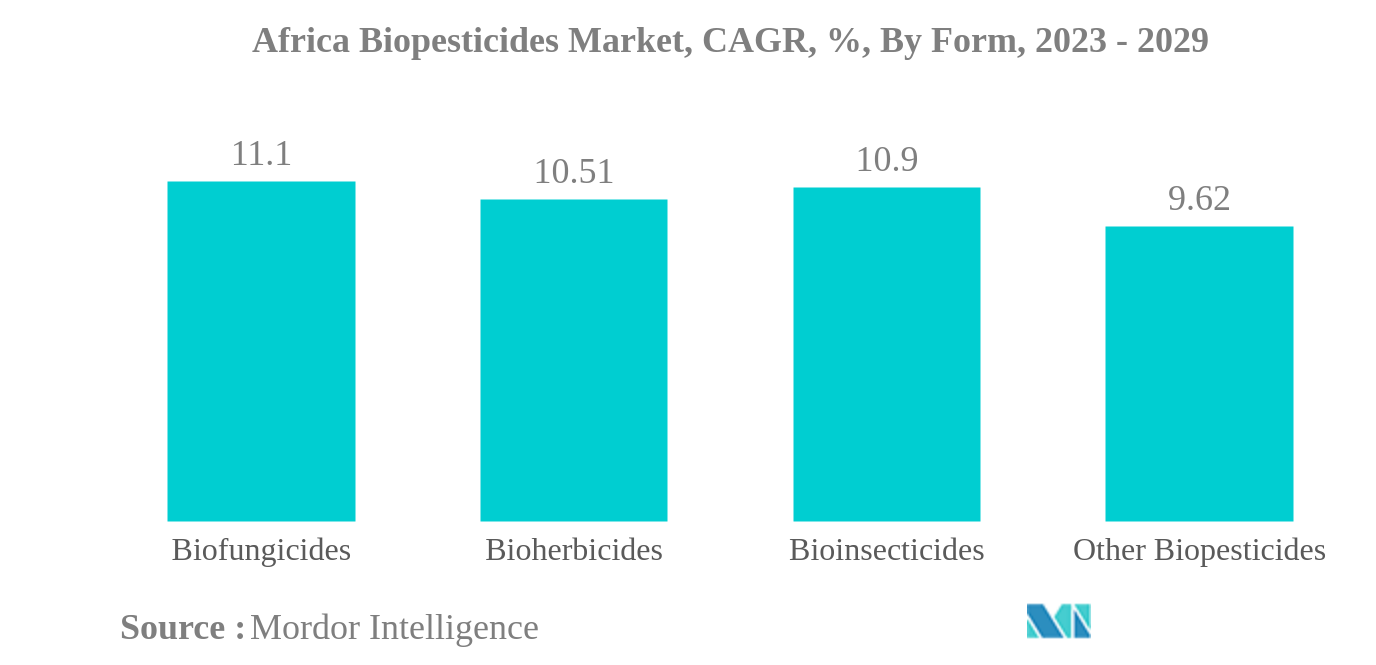
- Biofungicides is the Largest Form : Biofungicides target particular plant diseases by using naturally present beneficial microbes and can kill both foliar diseases/infections and soil-borne root pathogens.
- Biofungicides is the Fastest-growing Form : The application of biofungicides has grown significantly over time as a result of improved product accessibility and rapid technological improvements in the new products.
- Row Crops is the Largest Crop Type : Rice, Maize, Millet, Sorghum, Wheat, soybeans, yams, peanuts, beans, etc. are major row crops produced in the region. Biofungicides are most used biopesticides in row crops.
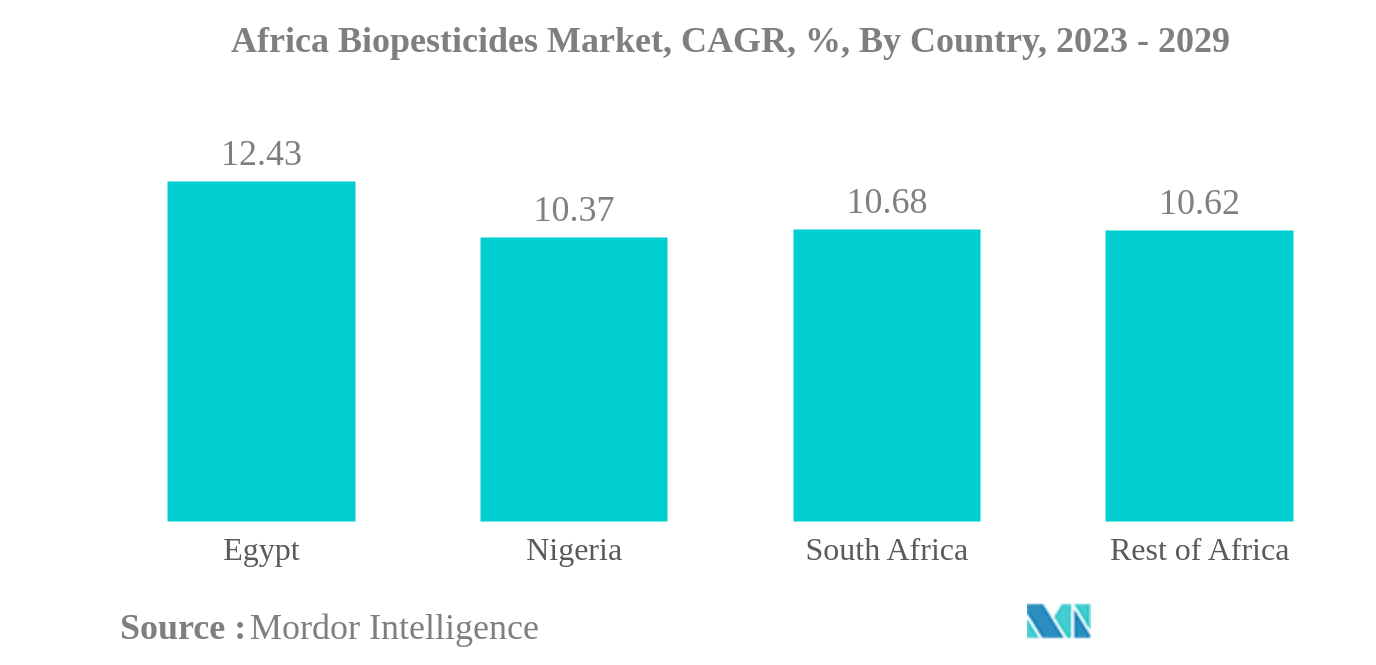
- Nigeria is the Largest Country : In 2022, biofungicides are most used biopesticides in the country with 47.2% market share, row crops are dominating the biopesticide consumption in the country with 58.9%.
Africa Biopesticides Market Trends
This section covers the major market trends shaping the Africa Biopesticides Market according to our research experts:
Biofungicides is the largest Form
- Biopesticides are naturally occurring substances or agents derived from animals, plants, insects, and microorganisms, including bacteria and fungi, used to manage agricultural pests and infections. The African biopesticides market grew by 23.4% from 2017 to 2022.
- Biopesticide consumption in row crops is higher than other crops in the region, accounting for 73.8% in 2022. Horticultural crops accounted for 19.7%, while cash crops accounted for 6.5% of the overall consumption in the same year.
- The Integrated Pest Management (IPM) concept is important in the African biopesticides market. IPM 1.0 was established decades ago to reduce the overuse of agricultural pesticides. IPM 2.0 gradually incorporated agroecological principles such as biological control and habitat management. However, throughout this period, smallholder farmers did not improve their decision-making skills and continued to rely on hazardous pesticides as their first line of defense. The African region also implemented Integrated Pest Management 3.0 (IPM 3.0), which includes three new features, i.e., real-time farmer decision-making access, pest-management options based on science and nature, and the integration of genomic approaches, biopesticides, and habitat-management practices. These IPM practices may drive the biopesticides market in Africa.
- In collaboration with Real IPM Ltd, the International Centre of Insect Physiology and Ecology commercialized two biopesticides, Campaign (icipe69) and Achieve (icipe78). Campaign (icipe69) is being used against mealybugs, thrips, and fruit flies, in crops such as cucumber, mango, papaya, rose, and tomato. Adoption of IPM practices and increased R&D activities of biopesticides may boost the market value by 84.7% during 2023-2029.
Nigeria is the largest Country
- The African biopesticides market has exhibited a growth rate of 15.8% between 2017 and 2021, and this growth is expected to continue with a projected expansion of about 84.7% by 2029.
- This growth is primarily attributed to the launch of Integrated Pest Management 3.0 (IPM 3.0) in Africa. This pest management strategy is based on three pillars: real-time farmer decision-making access, science-based pest-management alternatives, and the combination of genetic methods, biopesticides, and habitat-management strategies. These IPM methods are expected to play a critical role in driving the growth of the African biopesticides market.
- Biofungicides are the dominant segment of the biopesticides market in the Rest of Africa segment, and it was valued at USD 45.6 million in 2022. Trichoderma is widely used as a biofungicide as it destroys other fungi enzymatically and produces anti-microbial substances that kill pathogenic fungi.
- Egypt, South Africa, and the Rest of Africa are the primary segments in the African region regarding organic agriculture acreage. In 2022, the Rest of Africa accounted for 95.0% of total organic agricultural land in Africa, with 1.2 million hectares. Egypt contributed 3.5% with 45.1 thousand hectares, while South Africa accounted for 1.0% with 12.6 thousand hectares. The high organic agricultural acreage in these countries provides significant market opportunities.
- The increasing consumer interest in organic products, growing awareness among farmers, and the economic advantages of using biopesticides are anticipated to drive the demand for biopesticides in Africa, and the market is expected to record a CAGR of 9.2% during the forecast period.
Africa Biopesticides Industry Overview
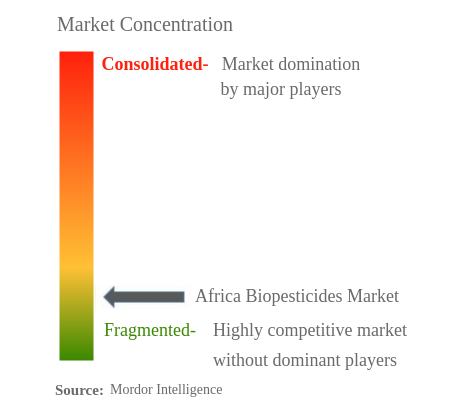
The Africa Biopesticides Market is fragmented, with the top five companies occupying 14.93%. The major players in this market are Certis USA LLC, Coromandel International Ltd, Koppert Biological Systems Inc., T. Stanes and Company Limited and UPL (sorted alphabetically).
Africa Biopesticides Market Leaders
Certis USA LLC
Coromandel International Ltd
Koppert Biological Systems Inc.
T. Stanes and Company Limited
UPL
*Disclaimer: Major Players sorted in no particular order
Africa Biopesticides Market News
- June 2022: Certis Biologicals and Novozymes, two leading agricultural biotechnology companies, collaborated to develop new technologies for highly effective fungal disease control. This collaboration will provide new solutions to row crop growers.
- October 2021: UPL agreed to collaborate with Chr. Hansen, a global bioscience company that develops microbes-based biopesticides that help farmers sustainably control plant pests and diseases.
Africa Biopesticides Market Report - Table of Contents
EXECUTIVE SUMMARY & KEY FINDINGS
REPORT OFFERS
1. INTRODUCTION
1.1. Study Assumptions & Market Definition
1.2. Scope of the Study
1.3. Research Methodology
2. KEY INDUSTRY TRENDS
2.1. Area Under Organic Cultivation
2.2. Per Capita Spending On Organic Products
2.3. Regulatory Framework
2.4. Value Chain & Distribution Channel Analysis
3. MARKET SEGMENTATION
3.1. Form
3.1.1. Biofungicides
3.1.2. Bioherbicides
3.1.3. Bioinsecticides
3.1.4. Other Biopesticides
3.2. Crop Type
3.2.1. Cash Crops
3.2.2. Horticultural Crops
3.2.3. Row Crops
3.3. Country
3.3.1. Egypt
3.3.2. Nigeria
3.3.3. South Africa
3.3.4. Rest Of Africa
4. COMPETITIVE LANDSCAPE
4.1. Key Strategic Moves
4.2. Market Share Analysis
4.3. Company Landscape
4.4. Company Profiles
4.4.1. Andermatt Group AG
4.4.2. Atlántica Agrícola
4.4.3. Biolchim SPA
4.4.4. Certis USA LLC
4.4.5. Coromandel International Ltd
4.4.6. IPL Biologicals Limited
4.4.7. Koppert Biological Systems Inc.
4.4.8. T. Stanes and Company Limited
4.4.9. UPL
4.4.10. Valent Biosciences LLC
5. KEY STRATEGIC QUESTIONS FOR AGRICULTURAL BIOLOGICALS CEOS
6. APPENDIX
6.1. Global Overview
6.1.1. Overview
6.1.2. Porter’s Five Forces Framework
6.1.3. Global Value Chain Analysis
6.1.4. Market Dynamics (DROs)
6.2. Sources & References
6.3. List of Tables & Figures
6.4. Primary Insights
6.5. Data Pack
6.6. Glossary of Terms
List of Tables & Figures
- Figure 1:
- AFRICA BIOPESTICIDES MARKET, AREA UNDER ORGANIC CULTIVATION, HECTARES, 2017 - 2022
- Figure 2:
- AFRICA BIOPESTICIDES MARKET, PER CAPITA SPENDING ON ORGANIC PRODUCTS, USD, 2017 - 2022
- Figure 3:
- AFRICA BIOPESTICIDES MARKET, VOLUME, METRIC TON, 2017 - 2029
- Figure 4:
- AFRICA BIOPESTICIDES MARKET, VALUE, USD, 2017 - 2029
- Figure 5:
- AFRICA BIOPESTICIDES MARKET, BY FORM, VOLUME, METRIC TON, 2017 - 2029
- Figure 6:
- AFRICA BIOPESTICIDES MARKET, BY FORM, VALUE, USD, 2017 - 2029
- Figure 7:
- AFRICA BIOPESTICIDES MARKET, VOLUME SHARE(%), BY FORM, 2017 - 2029
- Figure 8:
- AFRICA BIOPESTICIDES MARKET, VALUE SHARE(%), BY FORM, 2017 - 2029
- Figure 9:
- AFRICA BIOPESTICIDES MARKET, BY FORM, VOLUME, METRIC TON, 2017 - 2029
- Figure 10:
- AFRICA BIOPESTICIDES MARKET, BY FORM, VALUE, USD, 2017 - 2029
- Figure 11:
- AFRICA BIOPESTICIDES MARKET, VALUE SHARE(%), BY CROP TYPE, 2022 - 2029
- Figure 12:
- AFRICA BIOPESTICIDES MARKET, BY FORM, VOLUME, METRIC TON, 2017 - 2029
- Figure 13:
- AFRICA BIOPESTICIDES MARKET, BY FORM, VALUE, USD, 2017 - 2029
- Figure 14:
- AFRICA BIOPESTICIDES MARKET, VALUE SHARE(%), BY CROP TYPE, 2022 - 2029
- Figure 15:
- AFRICA BIOPESTICIDES MARKET, BY FORM, VOLUME, METRIC TON, 2017 - 2029
- Figure 16:
- AFRICA BIOPESTICIDES MARKET, BY FORM, VALUE, USD, 2017 - 2029
- Figure 17:
- AFRICA BIOPESTICIDES MARKET, VALUE SHARE(%), BY CROP TYPE, 2022 - 2029
- Figure 18:
- AFRICA BIOPESTICIDES MARKET, BY FORM, VOLUME, METRIC TON, 2017 - 2029
- Figure 19:
- AFRICA BIOPESTICIDES MARKET, BY FORM, VALUE, USD, 2017 - 2029
- Figure 20:
- AFRICA BIOPESTICIDES MARKET, VALUE SHARE(%), BY CROP TYPE, 2022 - 2029
- Figure 21:
- AFRICA BIOPESTICIDES MARKET, BY CROP TYPE, VOLUME, METRIC TON, 2017 - 2029
- Figure 22:
- AFRICA BIOPESTICIDES MARKET, BY CROP TYPE, VALUE, USD, 2017 - 2029
- Figure 23:
- AFRICA BIOPESTICIDES MARKET, VOLUME SHARE(%), BY CROP TYPE, 2017 - 2029
- Figure 24:
- AFRICA BIOPESTICIDES MARKET, VALUE SHARE(%), BY CROP TYPE, 2017 - 2029
- Figure 25:
- AFRICA BIOPESTICIDES MARKET, BY CROP TYPE, VOLUME, METRIC TON, 2017 - 2029
- Figure 26:
- AFRICA BIOPESTICIDES MARKET, BY CROP TYPE, VALUE, USD, 2017 - 2029
- Figure 27:
- AFRICA BIOPESTICIDES MARKET, VALUE SHARE(%), BY FORM, 2022 - 2029
- Figure 28:
- AFRICA BIOPESTICIDES MARKET, BY CROP TYPE, VOLUME, METRIC TON, 2017 - 2029
- Figure 29:
- AFRICA BIOPESTICIDES MARKET, BY CROP TYPE, VALUE, USD, 2017 - 2029
- Figure 30:
- AFRICA BIOPESTICIDES MARKET, VALUE SHARE(%), BY FORM, 2022 - 2029
- Figure 31:
- AFRICA BIOPESTICIDES MARKET, BY CROP TYPE, VOLUME, METRIC TON, 2017 - 2029
- Figure 32:
- AFRICA BIOPESTICIDES MARKET, BY CROP TYPE, VALUE, USD, 2017 - 2029
- Figure 33:
- AFRICA BIOPESTICIDES MARKET, VALUE SHARE(%), BY FORM, 2022 - 2029
- Figure 34:
- AFRICA BIOPESTICIDES MARKET, BY COUNTRY, VOLUME, METRIC TON, 2017 - 2029
- Figure 35:
- AFRICA BIOPESTICIDES MARKET, BY COUNTRY, VALUE, USD, 2017 - 2029
- Figure 36:
- AFRICA BIOPESTICIDES MARKET, VOLUME SHARE(%), BY COUNTRY, 2017 - 2029
- Figure 37:
- AFRICA BIOPESTICIDES MARKET, VALUE SHARE(%), BY COUNTRY, 2017 - 2029
- Figure 38:
- AFRICA BIOPESTICIDES MARKET, BY COUNTRY, VOLUME, METRIC TON, 2017 - 2029
- Figure 39:
- AFRICA BIOPESTICIDES MARKET, BY COUNTRY, VALUE, USD, 2017 - 2029
- Figure 40:
- AFRICA BIOPESTICIDES MARKET, VALUE SHARE(%), BY FORM, 2022 - 2029
- Figure 41:
- AFRICA BIOPESTICIDES MARKET, BY COUNTRY, VOLUME, METRIC TON, 2017 - 2029
- Figure 42:
- AFRICA BIOPESTICIDES MARKET, BY COUNTRY, VALUE, USD, 2017 - 2029
- Figure 43:
- AFRICA BIOPESTICIDES MARKET, VALUE SHARE(%), BY FORM, 2022 - 2029
- Figure 44:
- AFRICA BIOPESTICIDES MARKET, BY COUNTRY, VOLUME, METRIC TON, 2017 - 2029
- Figure 45:
- AFRICA BIOPESTICIDES MARKET, BY COUNTRY, VALUE, USD, 2017 - 2029
- Figure 46:
- AFRICA BIOPESTICIDES MARKET, VALUE SHARE(%), BY FORM, 2022 - 2029
- Figure 47:
- AFRICA BIOPESTICIDES MARKET, BY COUNTRY, VOLUME, METRIC TON, 2017 - 2029
- Figure 48:
- AFRICA BIOPESTICIDES MARKET, BY COUNTRY, VALUE, USD, 2017 - 2029
- Figure 49:
- AFRICA BIOPESTICIDES MARKET, VALUE SHARE(%), BY FORM, 2022 - 2029
- Figure 50:
- AFRICA BIOPESTICIDES MARKET, MOST ACTIVE COMPANIES, BY NUMBER OF STRATEGIC MOVES, 2017-2022
- Figure 51:
- AFRICA BIOPESTICIDES MARKET, MOST ADOPTED STRATEGIES, 2017-2022
- Figure 52:
- AFRICA BIOPESTICIDES MARKET SHARE(%), BY MAJOR PLAYERS, 2022
Africa Biopesticides Industry Segmentation
Biofungicides, Bioherbicides, Bioinsecticides are covered as segments by Form. Cash Crops, Horticultural Crops, Row Crops are covered as segments by Crop Type. Egypt, Nigeria, South Africa are covered as segments by Country.| Form | |
| Biofungicides | |
| Bioherbicides | |
| Bioinsecticides | |
| Other Biopesticides |
| Crop Type | |
| Cash Crops | |
| Horticultural Crops | |
| Row Crops |
| Country | |
| Egypt | |
| Nigeria | |
| South Africa | |
| Rest Of Africa |
Market Definition
- AVERAGE DOSAGE RATE - This refers to the average volume of biopesticides applied per hectare of farmland in the respective region/country.
- CROP TYPE - Row Crops: Cereals, Pulses, Oilseeds, and Forage Crops Horticulture: Fruits, and Vegetables, Cash Crops: Plantation Crops and Spices.
- FUNCTIONS - Biopesticides
- MARKET ESTIMATION LEVEL - Market Estimations for various types of biopesticides has been done at the product-level.
Research Methodology
Mordor Intelligence follows a four-step methodology in all our reports.
- Step-1: Identify Key Variables: In order to build a robust forecasting methodology, the variables and factors identified in Step-1 are tested against available historical market numbers. Through an iterative process, the variables required for market forecast are set and the model is built on the basis of these variables.
- Step-2: Build a Market Model: Market-size estimations for the forecast years are in nominal terms. Inflation is not a part of the pricing, and the average selling price (ASP) is kept constant throughout the forecast period.
- Step-3: Validate and Finalize: In this important step, all market numbers, variables and analyst calls are validated through an extensive network of primary research experts from the market studied. The respondents are selected across levels and functions to generate a holistic picture of the market studied.
- Step-4: Research Outputs: Syndicated Reports, Custom Consulting Assignments, Databases & Subscription Platforms.


