Africa Plant Protein Ingredients Market Size

| Icons | Lable | Value |
|---|---|---|
|
|
Study Period | 2017 - 2029 |
|
|
Base Year For Estimation | 2022 |
|
|
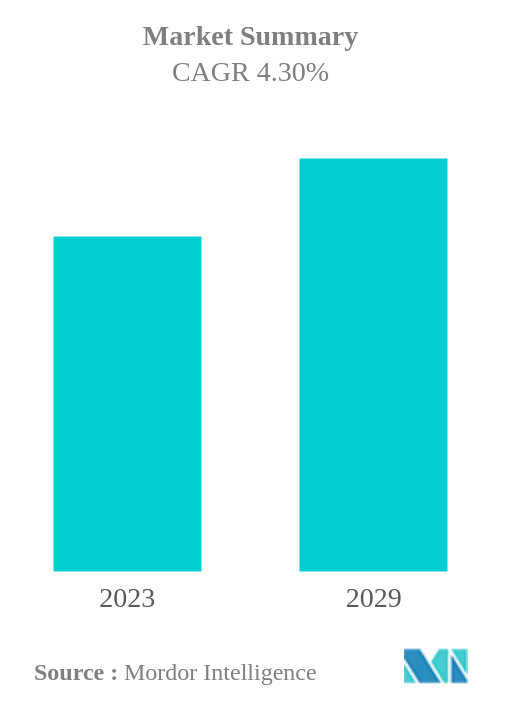
CAGR | 4.30 % |
|
|
Largest Share by End User | Food and Beverages |
|
|
Largest Share by Country | Nigeria |
|
|
Market Concentration | High |
Major Players |
||
|
|
||
|
*Disclaimer: Major Players sorted in no particular order |
Africa Plant Protein Ingredients Market Analysis
The Africa Plant Protein Ingredients Market is projected to register a CAGR of 4.30%
- Soy Protein is the Largest Protein Type: Soy protein remained the most favored, owing to its inexpensive cost and excellent quality. The F&B and the animal feed segments drove the soy protein type in the region.
- Food and Beverages is the Largest End User: The F&B segment dominates the market, primarily led by the bakery and meat and dairy alternatives sub-segments due to the functionalities of plant protein ingredients, which makes them the preferred ingredients in these industries.
- Pea Protein is the Fastest-growing Protein Type: Pea proteins are gaining demand as meat alternatives due to their quick rehydration, neutral flavor, and texturizing abilities, which has led to a slew of new products.
- Supplements is the Fastest-growing End User: Rising demand for natural ingredients and protein-enriched skin, body, and hair care products is driving the segment, which is projected to record the fastest growth during the forecast period.
Africa Plant Protein Ingredients Market Trends
This section covers the major market trends shaping the Africa Plant Protein Ingredients Market according to our research experts:
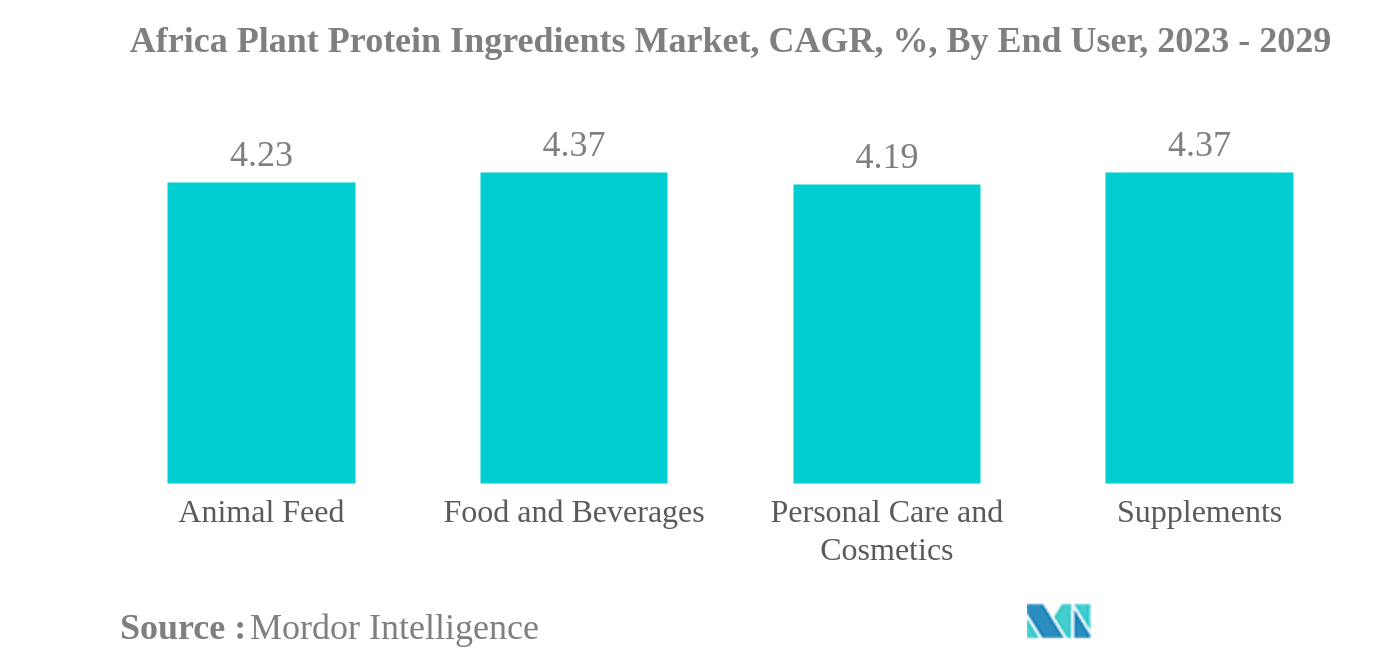
Food and Beverages is the largest End User
- The F&B segment drove the African plant protein ingredients market. It is projected to register the second-fastest CAGR of 6.05% during the forecast period. In 2020, its application share by value increased to 62% from 60.7% in 2019. This growth was mostly due to increased stockpiling and consumer panic-buying behavior during the COVID-19 pandemic and subsequent lockdowns. The applications of plant proteins in bakery, one of the primary F&B sub-segments, registered a Y-o-Y growth rate of 16.72% in 2020.
- The personal care and cosmetics segment is projected to register the fastest CAGR of 7.12% during the forecast period, owing to expansive marketing campaigns and increasing distribution channels, especially in e-commerce for personal care products. Growth in men's grooming is another vital factor boosting the market. Major international players in the beauty and cosmetics industry are maximizing the boom anticipated for the Sub-Saharan African market, which is viewed as the industry's "next frontier." Because of their capacity to bind water with the horny layer of skin and its annexes, plant proteins are considered beneficial components for fostering an environment favorable for healthy skin and hair. They are especially helpful in hydrating the skin, which is necessary for dry regions.
- The animal feed segment accounts for the second-largest market share, with a share of 40.39% by volume in 2022. The applications of protein in the animal feed segment are driven by plant protein, mainly soy and wheat proteins, due to their low cost-in-use, excellent digestibility, and neutral flavor profile. The production animal can function at its highest zootechnical level owing to the utilization of novel plant protein sources, such as hydrolyzed plant proteins. Additionally, they provide certain functions like anti-oxidant, anti-microbial, anti-fungal, anti-viral, and anti-parasitic properties.
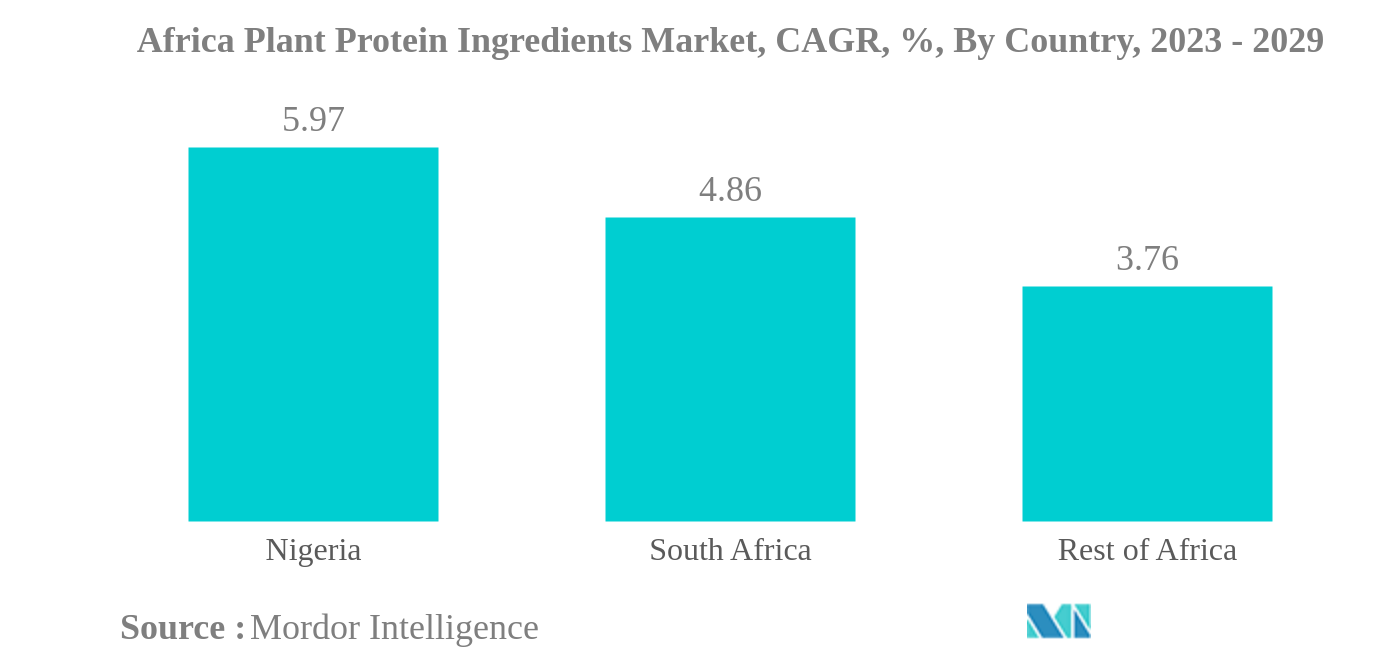
Nigeria is the largest Country
- The African plant protein ingredients market is led by Nigeria, which is also projected to record the fastest CAGR of 5.97% by value during the forecast period. Despite the country's small vegetarian population, the industry is projected to expand due to the growing acceptance of veganism or vegetarianism. Four out of five Gen Z and millennials in Nigeria are highly likely to try plant-based proteins. Africa has historically been susceptible to food security disruptions and malnutrition, with plant-based protein solutions a potential source of increased food security.
- South Africa is another leading market, largely led by soy protein applications in animal feed. The comparatively bigger animal feed sector of the country, accounting for a 33.04% share of the overall African animal feed industry, has further catered to the growth of the South African market. Soy protein is commonly used in the animal feed sector due to its low cost and high protein content. In 2022, soy protein isolates cost 36.74% less than pea protein isolates in South Africa. The use of soy protein isolates in combination with high-quality carbohydrate feed such as whey powder to feed early-weaned piglets of different ages has achieved similar growth performance to skimmed milk powder.
- There is widespread consumer acceptability and significant demand for plant-based meat throughout Africa, especially in Kenya, Nigeria, and South Africa, as 1.82 million, 17 million, and 1.5 million people in Kenya, Nigeria, and South Africa suffer from severe malnutrition, respectively. Due to the significant prevalence of malnutrition, the plant-based protein market is likely to grow across the region in the future.
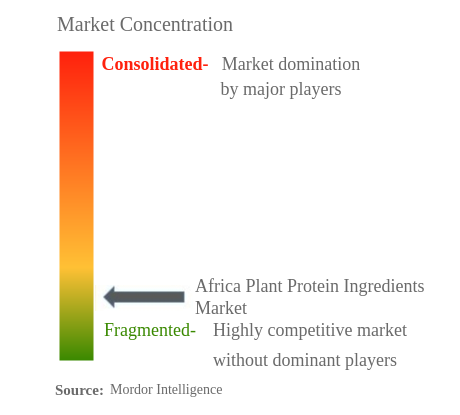
Africa Plant Protein Ingredients Industry Overview
The Africa Plant Protein Ingredients Market is fragmented, with the top five companies occupying 5.56%. The major players in this market are A. Costantino & C. SpA, Amesi Group, International Flavors & Fragrances Inc., Kerry Group PLC and Wilmar International Ltd (sorted alphabetically).
Africa Plant Protein Ingredients Market Leaders
A. Costantino & C. SpA
Amesi Group
International Flavors & Fragrances Inc.
Kerry Group PLC
Wilmar International Ltd
*Disclaimer: Major Players sorted in no particular order
Africa Plant Protein Ingredients Market News
- June 2021: Axiom Foods launched a new pea protein, made from Pisum sativum yellow peas, that is majorly used as a meat replacement and a meat extender. It reduces the cost of nuggets, patties, and meatballs while adding nutritional content, protein, and juiciness.
- February 2021: DuPont's Nutrition & Biosciences and the ingredient company IFF announced their merger in 2021. The combined company will continue to operate under the name IFF. The complementary portfolios give the company leadership positions within a range of ingredients, including soy protein.
- January 2021: Kerry introduced Radicle Solution Finder, a web-based tool that provides clients with real-time information on plant-based formulations. It is accessible on any device with a web browser and can assist in developing new goods for the rapidly growing plant-based market.
Africa Plant Protein Ingredients Market Report - Table of Contents
EXECUTIVE SUMMARY & KEY FINDINGS
1. INTRODUCTION
1.1. Study Assumptions & Market Definition
1.2. Scope of the Study
1.3. Research Methodology
2. KEY INDUSTRY TRENDS
2.1. End User Market Volume
2.2. Protein Consumption Trends
2.3. Production Trends
2.4. Regulatory Framework
2.5. Value Chain & Distribution Channel Analysis
3. MARKET SEGMENTATION
3.1. Protein Type
3.1.1. Hemp Protein
3.1.2. Pea Protein
3.1.3. Potato Protein
3.1.4. Rice Protein
3.1.5. Soy Protein
3.1.6. Wheat Protein
3.1.7. Other Plant Protein
3.2. End User
3.2.1. Animal Feed
3.2.2. Food and Beverages
3.2.2.1. By Sub End User
3.2.2.1.1. Bakery
3.2.2.1.2. Beverages
3.2.2.1.3. Breakfast Cereals
3.2.2.1.4. Condiments/Sauces
3.2.2.1.5. Confectionery
3.2.2.1.6. Dairy and Dairy Alternative Products
3.2.2.1.7. Meat/Poultry/Seafood and Meat Alternative Products
3.2.2.1.8. RTE/RTC Food Products
3.2.2.1.9. Snacks
3.2.3. Personal Care and Cosmetics
3.2.4. Supplements
3.2.4.1. By Sub End User
3.2.4.1.1. Baby Food and Infant Formula
3.2.4.1.2. Elderly Nutrition and Medical Nutrition
3.2.4.1.3. Sport/Performance Nutrition
3.3. Country
3.3.1. Nigeria
3.3.2. South Africa
3.3.3. Rest of Africa
4. COMPETITIVE LANDSCAPE
4.1. Key Strategic Moves
4.2. Market Share Analysis
4.3. Company Landscape
4.4. Company Profiles
4.4.1. A. Costantino & C. SpA
4.4.2. Amesi Group
4.4.3. Axiom Foods Inc.
4.4.4. Cargill Incorporated
4.4.5. International Flavors & Fragrances Inc.
4.4.6. Kerry Group PLC
4.4.7. Wilmar International Ltd
5. KEY STRATEGIC QUESTIONS FOR PROTEIN INGREDIENTS INDUSTRY CEOS
6. APPENDIX
6.1. Global Overview
6.1.1. Overview
6.1.2. Porter’s Five Forces Framework
6.1.3. Global Value Chain Analysis
6.1.4. Market Dynamics (DROs)
6.2. Sources & References
6.3. List of Tables & Figures
6.4. Primary Insights
6.5. Data Pack
6.6. Glossary of Terms
List of Tables & Figures
- Figure 1:
- AFRICA BABY FOOD AND INFANT FORMULA MARKET, VOLUME IN METRIC TONNES, 2017 - 2029
- Figure 2:
- AFRICA BAKERY MARKET, VOLUME IN METRIC TONNES, 2017 - 2029
- Figure 3:
- AFRICA BEVERAGES MARKET, VOLUME IN METRIC TONNES, 2017 - 2029
- Figure 4:
- AFRICA BREAKFAST CEREALS MARKET, VOLUME IN METRIC TONNES, 2017 - 2029
- Figure 5:
- AFRICA CONDIMENTS/SAUCES MARKET, VOLUME IN METRIC TONNES, 2017 - 2029
- Figure 6:
- AFRICA CONFECTIONERY MARKET, VOLUME IN METRIC TONNES, 2017 - 2029
- Figure 7:
- AFRICA DAIRY AND DAIRY ALTERNATIVE PRODUCTS MARKET, VOLUME IN METRIC TONNES, 2017 - 2029
- Figure 8:
- AFRICA ELDERLY NUTRITION AND MEDICAL NUTRITION MARKET, VOLUME IN METRIC TONNES, 2017 - 2029
- Figure 9:
- AFRICA MEAT/POULTRY/SEAFOOD AND MEAT ALTERNATIVE PRODUCTS MARKET, VOLUME IN METRIC TONNES, 2017 - 2029
- Figure 10:
- AFRICA RTE/RTC FOOD PRODUCTS MARKET, VOLUME IN METRIC TONNES, 2017 - 2029
- Figure 11:
- AFRICA SNACKS MARKET, VOLUME IN METRIC TONNES, 2017 - 2029
- Figure 12:
- AFRICA SPORT/PERFORMANCE NUTRITION MARKET, VOLUME IN METRIC TONNES, 2017 - 2029
- Figure 13:
- AFRICA ANIMAL FEED MARKET, VOLUME IN METRIC TONNES, 2017 - 2029
- Figure 14:
- AFRICA PERSONAL CARE AND COSMETICS MARKET, VOLUME IN METRIC TONNES, 2017 - 2029
- Figure 15:
- AFRICA PER CAPITA CONSUMPTION OF PLANT PROTEIN, IN GRAM, 2017 - 2029
- Figure 16:
- AFRICA PLANT PROTEIN RAW MATERIAL PRODUCTION, IN METRIC TONNES, 2017 - 2021
- Figure 17:
- AFRICA PLANT PROTEIN INGREDIENTS MARKET, 2015-2026
- Figure 18:
- AFRICA PLANT PROTEIN INGREDIENTS MARKET, 2015-2026
- Figure 19:
- AFRICA PLANT PROTEIN INGREDIENTS MARKET, VOLUME IN METRIC TONNES, BY PROTEIN TYPE, 2017 - 2029
- Figure 20:
- AFRICA PLANT PROTEIN INGREDIENTS MARKET, VALUE IN USD, BY PROTEIN TYPE, 2017 - 2029
- Figure 21:
- AFRICA PLANT PROTEIN INGREDIENTS MARKET, VALUE SHARE (%), BY PROTEIN TYPE, 2017 VS 2023 VS 2029
- Figure 22:
- AFRICA PLANT PROTEIN INGREDIENTS MARKET, VOLUME SHARE (%), BY PROTEIN TYPE, 2017 VS 2023 VS 2029
- Figure 23:
- AFRICA PLANT PROTEIN INGREDIENTS MARKET, VOLUME IN METRIC TONNES, HEMP PROTEIN, 2017 - 2029
- Figure 24:
- AFRICA PLANT PROTEIN INGREDIENTS MARKET, VALUE IN USD, HEMP PROTEIN, 2017 - 2029
- Figure 25:
- AFRICA PLANT PROTEIN INGREDIENTS MARKET, HEMP PROTEIN, VALUE SHARE (%), BY END USER, 2022 VS 2029
- Figure 26:
- AFRICA PLANT PROTEIN INGREDIENTS MARKET, VOLUME IN METRIC TONNES, PEA PROTEIN, 2017 - 2029
- Figure 27:
- AFRICA PLANT PROTEIN INGREDIENTS MARKET, VALUE IN USD, PEA PROTEIN, 2017 - 2029
- Figure 28:
- AFRICA PLANT PROTEIN INGREDIENTS MARKET, PEA PROTEIN, VALUE SHARE (%), BY END USER, 2022 VS 2029
- Figure 29:
- AFRICA PLANT PROTEIN INGREDIENTS MARKET, VOLUME IN METRIC TONNES, POTATO PROTEIN, 2017 - 2029
- Figure 30:
- AFRICA PLANT PROTEIN INGREDIENTS MARKET, VALUE IN USD, POTATO PROTEIN, 2017 - 2029
- Figure 31:
- AFRICA PLANT PROTEIN INGREDIENTS MARKET, POTATO PROTEIN, VALUE SHARE (%), BY END USER, 2022 VS 2029
- Figure 32:
- AFRICA PLANT PROTEIN INGREDIENTS MARKET, VOLUME IN METRIC TONNES, RICE PROTEIN, 2017 - 2029
- Figure 33:
- AFRICA PLANT PROTEIN INGREDIENTS MARKET, VALUE IN USD, RICE PROTEIN, 2017 - 2029
- Figure 34:
- AFRICA PLANT PROTEIN INGREDIENTS MARKET, RICE PROTEIN, VALUE SHARE (%), BY END USER, 2022 VS 2029
- Figure 35:
- AFRICA PLANT PROTEIN INGREDIENTS MARKET, VOLUME IN METRIC TONNES, SOY PROTEIN, 2017 - 2029
- Figure 36:
- AFRICA PLANT PROTEIN INGREDIENTS MARKET, VALUE IN USD, SOY PROTEIN, 2017 - 2029
- Figure 37:
- AFRICA PLANT PROTEIN INGREDIENTS MARKET, SOY PROTEIN, VALUE SHARE (%), BY END USER, 2022 VS 2029
- Figure 38:
- AFRICA PLANT PROTEIN INGREDIENTS MARKET, VOLUME IN METRIC TONNES, WHEAT PROTEIN, 2017 - 2029
- Figure 39:
- AFRICA PLANT PROTEIN INGREDIENTS MARKET, VALUE IN USD, WHEAT PROTEIN, 2017 - 2029
- Figure 40:
- AFRICA PLANT PROTEIN INGREDIENTS MARKET, WHEAT PROTEIN, VALUE SHARE (%), BY END USER, 2022 VS 2029
- Figure 41:
- AFRICA PLANT PROTEIN INGREDIENTS MARKET, VOLUME IN METRIC TONNES, OTHER PLANT PROTEIN, 2017 - 2029
- Figure 42:
- AFRICA PLANT PROTEIN INGREDIENTS MARKET, VALUE IN USD, OTHER PLANT PROTEIN, 2017 - 2029
- Figure 43:
- AFRICA PLANT PROTEIN INGREDIENTS MARKET, OTHER PLANT PROTEIN, VALUE SHARE (%), BY END USER, 2022 VS 2029
- Figure 44:
- AFRICA PLANT PROTEIN INGREDIENTS MARKET, VOLUME IN METRIC TONNES, BY END USER, 2017 - 2029
- Figure 45:
- AFRICA PLANT PROTEIN INGREDIENTS MARKET, VALUE IN USD, BY END USER, 2017 - 2029
- Figure 46:
- AFRICA PLANT PROTEIN INGREDIENTS MARKET, VALUE SHARE (%), BY END USER, 2017 VS 2023 VS 2029
- Figure 47:
- AFRICA PLANT PROTEIN INGREDIENTS MARKET, VOLUME SHARE (%), BY END USER, 2017 VS 2023 VS 2029
- Figure 48:
- AFRICA PLANT PROTEIN INGREDIENTS MARKET, VOLUME IN METRIC TONNES, ANIMAL FEED, 2017 - 2029
- Figure 49:
- AFRICA PLANT PROTEIN INGREDIENTS MARKET, VALUE IN USD, ANIMAL FEED, 2017 - 2029
- Figure 50:
- AFRICA PLANT PROTEIN INGREDIENTS MARKET, ANIMAL FEED, VALUE SHARE (%), BY PROTEIN TYPE, 2022 VS 2029
- Figure 51:
- AFRICA PLANT PROTEIN INGREDIENTS MARKET, VOLUME IN METRIC TONNES, BY SUB END USER, 2017 - 2029
- Figure 52:
- AFRICA PLANT PROTEIN INGREDIENTS MARKET, VALUE IN USD, BY SUB END USER, 2017 - 2029
- Figure 53:
- AFRICA PLANT PROTEIN INGREDIENTS MARKET, VALUE SHARE (%), BY SUB END USER, 2017 VS 2023 VS 2029
- Figure 54:
- AFRICA PLANT PROTEIN INGREDIENTS MARKET, VOLUME SHARE (%), BY SUB END USER, 2017 VS 2023 VS 2029
- Figure 55:
- AFRICA PLANT PROTEIN INGREDIENTS MARKET, VOLUME IN METRIC TONNES, BAKERY, 2017 - 2029
- Figure 56:
- AFRICA PLANT PROTEIN INGREDIENTS MARKET, VALUE IN USD, BAKERY, 2017 - 2029
- Figure 57:
- AFRICA PLANT PROTEIN INGREDIENTS MARKET, BAKERY, VALUE SHARE (%), BY PROTEIN TYPE, 2022 VS 2029
- Figure 58:
- AFRICA PLANT PROTEIN INGREDIENTS MARKET, VOLUME IN METRIC TONNES, BEVERAGES, 2017 - 2029
- Figure 59:
- AFRICA PLANT PROTEIN INGREDIENTS MARKET, VALUE IN USD, BEVERAGES, 2017 - 2029
- Figure 60:
- AFRICA PLANT PROTEIN INGREDIENTS MARKET, BEVERAGES, VALUE SHARE (%), BY PROTEIN TYPE, 2022 VS 2029
- Figure 61:
- AFRICA PLANT PROTEIN INGREDIENTS MARKET, VOLUME IN METRIC TONNES, BREAKFAST CEREALS, 2017 - 2029
- Figure 62:
- AFRICA PLANT PROTEIN INGREDIENTS MARKET, VALUE IN USD, BREAKFAST CEREALS, 2017 - 2029
- Figure 63:
- AFRICA PLANT PROTEIN INGREDIENTS MARKET, BREAKFAST CEREALS, VALUE SHARE (%), BY PROTEIN TYPE, 2022 VS 2029
- Figure 64:
- AFRICA PLANT PROTEIN INGREDIENTS MARKET, VOLUME IN METRIC TONNES, CONDIMENTS/SAUCES, 2017 - 2029
- Figure 65:
- AFRICA PLANT PROTEIN INGREDIENTS MARKET, VALUE IN USD, CONDIMENTS/SAUCES, 2017 - 2029
- Figure 66:
- AFRICA PLANT PROTEIN INGREDIENTS MARKET, CONDIMENTS/SAUCES, VALUE SHARE (%), BY PROTEIN TYPE, 2022 VS 2029
- Figure 67:
- AFRICA PLANT PROTEIN INGREDIENTS MARKET, VOLUME IN METRIC TONNES, CONFECTIONERY, 2017 - 2029
- Figure 68:
- AFRICA PLANT PROTEIN INGREDIENTS MARKET, VALUE IN USD, CONFECTIONERY, 2017 - 2029
- Figure 69:
- AFRICA PLANT PROTEIN INGREDIENTS MARKET, CONFECTIONERY, VALUE SHARE (%), BY PROTEIN TYPE, 2022 VS 2029
- Figure 70:
- AFRICA PLANT PROTEIN INGREDIENTS MARKET, VOLUME IN METRIC TONNES, DAIRY AND DAIRY ALTERNATIVE PRODUCTS, 2017 - 2029
- Figure 71:
- AFRICA PLANT PROTEIN INGREDIENTS MARKET, VALUE IN USD, DAIRY AND DAIRY ALTERNATIVE PRODUCTS, 2017 - 2029
- Figure 72:
- AFRICA PLANT PROTEIN INGREDIENTS MARKET, DAIRY AND DAIRY ALTERNATIVE PRODUCTS, VALUE SHARE (%), BY PROTEIN TYPE, 2022 VS 2029
- Figure 73:
- AFRICA PLANT PROTEIN INGREDIENTS MARKET, VOLUME IN METRIC TONNES, MEAT/POULTRY/SEAFOOD AND MEAT ALTERNATIVE PRODUCTS, 2017 - 2029
- Figure 74:
- AFRICA PLANT PROTEIN INGREDIENTS MARKET, VALUE IN USD, MEAT/POULTRY/SEAFOOD AND MEAT ALTERNATIVE PRODUCTS, 2017 - 2029
- Figure 75:
- AFRICA PLANT PROTEIN INGREDIENTS MARKET, MEAT/POULTRY/SEAFOOD AND MEAT ALTERNATIVE PRODUCTS, VALUE SHARE (%), BY PROTEIN TYPE, 2022 VS 2029
- Figure 76:
- AFRICA PLANT PROTEIN INGREDIENTS MARKET, VOLUME IN METRIC TONNES, RTE/RTC FOOD PRODUCTS, 2017 - 2029
- Figure 77:
- AFRICA PLANT PROTEIN INGREDIENTS MARKET, VALUE IN USD, RTE/RTC FOOD PRODUCTS, 2017 - 2029
- Figure 78:
- AFRICA PLANT PROTEIN INGREDIENTS MARKET, RTE/RTC FOOD PRODUCTS, VALUE SHARE (%), BY PROTEIN TYPE, 2022 VS 2029
- Figure 79:
- AFRICA PLANT PROTEIN INGREDIENTS MARKET, VOLUME IN METRIC TONNES, SNACKS, 2017 - 2029
- Figure 80:
- AFRICA PLANT PROTEIN INGREDIENTS MARKET, VALUE IN USD, SNACKS, 2017 - 2029
- Figure 81:
- AFRICA PLANT PROTEIN INGREDIENTS MARKET, SNACKS, VALUE SHARE (%), BY PROTEIN TYPE, 2022 VS 2029
- Figure 82:
- AFRICA PLANT PROTEIN INGREDIENTS MARKET, VOLUME IN METRIC TONNES, PERSONAL CARE AND COSMETICS, 2017 - 2029
- Figure 83:
- AFRICA PLANT PROTEIN INGREDIENTS MARKET, VALUE IN USD, PERSONAL CARE AND COSMETICS, 2017 - 2029
- Figure 84:
- AFRICA PLANT PROTEIN INGREDIENTS MARKET, PERSONAL CARE AND COSMETICS, VALUE SHARE (%), BY PROTEIN TYPE, 2022 VS 2029
- Figure 85:
- AFRICA PLANT PROTEIN INGREDIENTS MARKET, VOLUME IN METRIC TONNES, BY SUB END USER, 2017 - 2029
- Figure 86:
- AFRICA PLANT PROTEIN INGREDIENTS MARKET, VALUE IN USD, BY SUB END USER, 2017 - 2029
- Figure 87:
- AFRICA PLANT PROTEIN INGREDIENTS MARKET, VALUE SHARE (%), BY SUB END USER, 2017 VS 2023 VS 2029
- Figure 88:
- AFRICA PLANT PROTEIN INGREDIENTS MARKET, VOLUME SHARE (%), BY SUB END USER, 2017 VS 2023 VS 2029
- Figure 89:
- AFRICA PLANT PROTEIN INGREDIENTS MARKET, VOLUME IN METRIC TONNES, BABY FOOD AND INFANT FORMULA, 2017 - 2029
- Figure 90:
- AFRICA PLANT PROTEIN INGREDIENTS MARKET, VALUE IN USD, BABY FOOD AND INFANT FORMULA, 2017 - 2029
- Figure 91:
- AFRICA PLANT PROTEIN INGREDIENTS MARKET, BABY FOOD AND INFANT FORMULA, VALUE SHARE (%), BY PROTEIN TYPE, 2022 VS 2029
- Figure 92:
- AFRICA PLANT PROTEIN INGREDIENTS MARKET, VOLUME IN METRIC TONNES, ELDERLY NUTRITION AND MEDICAL NUTRITION, 2017 - 2029
- Figure 93:
- AFRICA PLANT PROTEIN INGREDIENTS MARKET, VALUE IN USD, ELDERLY NUTRITION AND MEDICAL NUTRITION, 2017 - 2029
- Figure 94:
- AFRICA PLANT PROTEIN INGREDIENTS MARKET, ELDERLY NUTRITION AND MEDICAL NUTRITION, VALUE SHARE (%), BY PROTEIN TYPE, 2022 VS 2029
- Figure 95:
- AFRICA PLANT PROTEIN INGREDIENTS MARKET, VOLUME IN METRIC TONNES, SPORT/PERFORMANCE NUTRITION, 2017 - 2029
- Figure 96:
- AFRICA PLANT PROTEIN INGREDIENTS MARKET, VALUE IN USD, SPORT/PERFORMANCE NUTRITION, 2017 - 2029
- Figure 97:
- AFRICA PLANT PROTEIN INGREDIENTS MARKET, SPORT/PERFORMANCE NUTRITION, VALUE SHARE (%), BY PROTEIN TYPE, 2022 VS 2029
- Figure 98:
- AFRICA PLANT PROTEIN INGREDIENTS MARKET, VOLUME IN METRIC TONNES, BY COUNTRY, 2017 - 2029
- Figure 99:
- AFRICA PLANT PROTEIN INGREDIENTS MARKET, VALUE IN USD, BY COUNTRY, 2017 - 2029
- Figure 100:
- AFRICA PLANT PROTEIN INGREDIENTS MARKET, VALUE SHARE (%), BY COUNTRY, 2017 VS 2023 VS 2029
- Figure 101:
- AFRICA PLANT PROTEIN INGREDIENTS MARKET, VOLUME SHARE (%), BY COUNTRY, 2017 VS 2023 VS 2029
- Figure 102:
- AFRICA PLANT PROTEIN INGREDIENTS MARKET, VOLUME IN METRIC TONNES, NIGERIA, 2017 - 2029
- Figure 103:
- AFRICA PLANT PROTEIN INGREDIENTS MARKET, VALUE IN USD, NIGERIA, 2017 - 2029
- Figure 104:
- AFRICA PLANT PROTEIN INGREDIENTS MARKET, VALUE SHARE (%), NIGERIA, BY PROTEIN TYPE, 2022 VS 2029
- Figure 105:
- AFRICA PLANT PROTEIN INGREDIENTS MARKET, VOLUME IN METRIC TONNES, SOUTH AFRICA, 2017 - 2029
- Figure 106:
- AFRICA PLANT PROTEIN INGREDIENTS MARKET, VALUE IN USD, SOUTH AFRICA, 2017 - 2029
- Figure 107:
- AFRICA PLANT PROTEIN INGREDIENTS MARKET, VALUE SHARE (%), SOUTH AFRICA, BY PROTEIN TYPE, 2022 VS 2029
- Figure 108:
- AFRICA PLANT PROTEIN INGREDIENTS MARKET, VOLUME IN METRIC TONNES, REST OF AFRICA, 2017 - 2029
- Figure 109:
- AFRICA PLANT PROTEIN INGREDIENTS MARKET, VALUE IN USD, REST OF AFRICA, 2017 - 2029
- Figure 110:
- AFRICA PLANT PROTEIN INGREDIENTS MARKET, VALUE SHARE (%), REST OF AFRICA, BY PROTEIN TYPE, 2022 VS 2029
- Figure 111:
- AFRICA PLANT PROTEIN INGREDIENTS MARKET, MOST ACTIVE COMPANIES, BY NUMBER OF STRATEGIC MOVES, 2017 - 2022
- Figure 112:
- AFRICA PLANT PROTEIN INGREDIENTS MARKET, TOTAL NUMBER OF STRATEGIC MOVES, 2017 - 2022
- Figure 113:
- AFRICA PLANT PROTEIN INGREDIENTS MARKET SHARE(%), BY KEY PLAYERS, 2021
Africa Plant Protein Ingredients Industry Segmentation
Hemp Protein, Pea Protein, Potato Protein, Rice Protein, Soy Protein, Wheat Protein are covered as segments by Protein Type. Animal Feed, Food and Beverages, Personal Care and Cosmetics, Supplements are covered as segments by End User. Nigeria, South Africa are covered as segments by Country.| Protein Type | |
| Hemp Protein | |
| Pea Protein | |
| Potato Protein | |
| Rice Protein | |
| Soy Protein | |
| Wheat Protein | |
| Other Plant Protein |
| End User | |||||||||||||
| Animal Feed | |||||||||||||
| |||||||||||||
| Personal Care and Cosmetics | |||||||||||||
|
| Country | |
| Nigeria | |
| South Africa | |
| Rest of Africa |
Market Definition
- End User - The Protein Ingredients Market operates on a B2B basis. Food, Beverages, Supplements, Animal Feed, and Personal Care & Cosmetic manufacturers are considered to be end-consumers in the market studied. The scope excludes manufacturers buying liquid/dry whey to be used for application as a binding agent or thickener or other non-protein applications.
- Penetration Rate - Penetration Rate is defined as the percentage of Protein-Fortified End User Market Volume in the Overall End User Market Volume.
- Average Protein Content - It is the average protein content present in per 100 g of product manufactured by all end-user companies considered under the scope of this report.
Research Methodology
Mordor Intelligence follows a four-step methodology in all our reports.
- Step-1: Identify Key Variables: The quantifiable key variables (industry and extraneous) pertaining to the specific product segment and country are selected from a group of relevant variables & factors based on desk research & literature review; along with primary expert inputs. These variables are further confirmed through regression modeling (wherever required).
- Step-2: Build a Market Model: In order to build a robust forecasting methodology, the variables and factors identified in Step-1 are tested against available historical market numbers. Through an iterative process, the variables required for market forecast are set and the model is built on the basis of these variables.
- Step-3: Validate and Finalize: In this important step, all market numbers, variables and analyst calls are validated through an extensive network of primary research experts from the market studied. The respondents are selected across levels and functions to generate a holistic picture of the market studied.
- Step-4: Research Outputs: Syndicated Reports, Custom Consulting Assignments, Databases & Subscription Platforms


