Aramids Market Size

| Icons | Lable | Value |
|---|---|---|
|
|
Study Period | 2017 - 2029 |
|
|
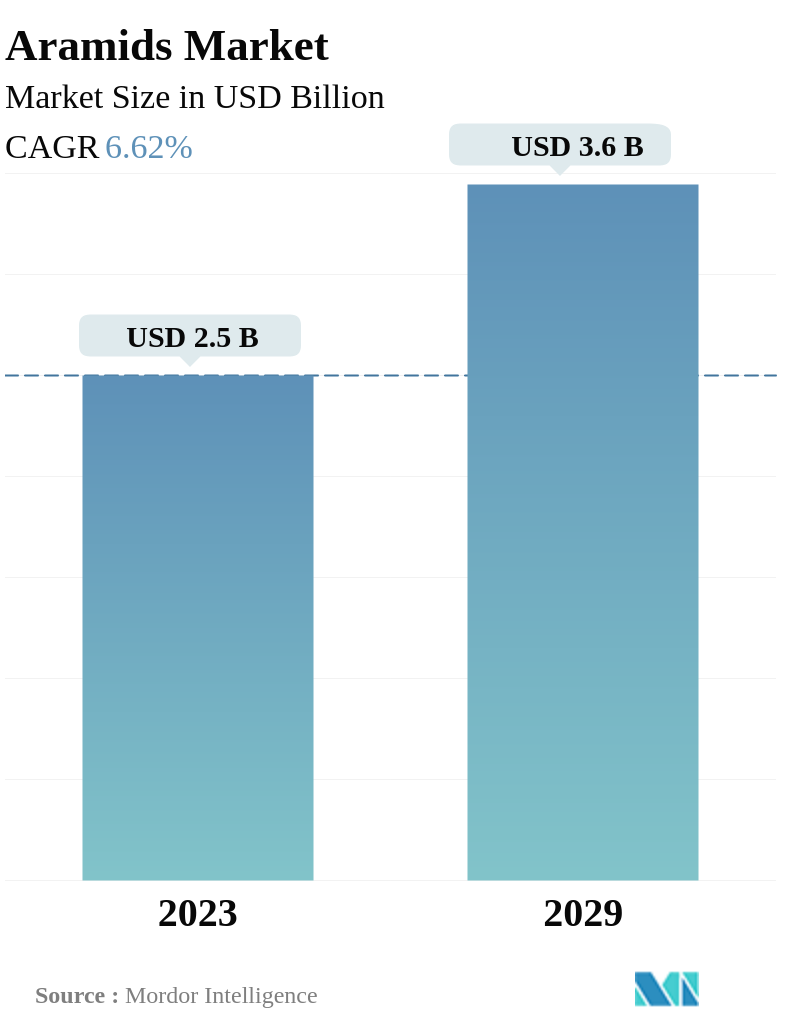
Market Size (2029) | USD 3.6 Billion |
|
|
Market Size (2023) | USD 2.5 Billion |
|
|
Largest Share by End User Industry | Electrical and Electronics |
|
|
CAGR (2023 - 2029) | 6.62 % |
|
|
Largest Share by Region | Asia-Pacific |
Major Players |
||
|
|
||
|
*Disclaimer: Major Players sorted in no particular order |
Aramids Market Analysis
The Aramids Market is projected to register a CAGR of 6.62%
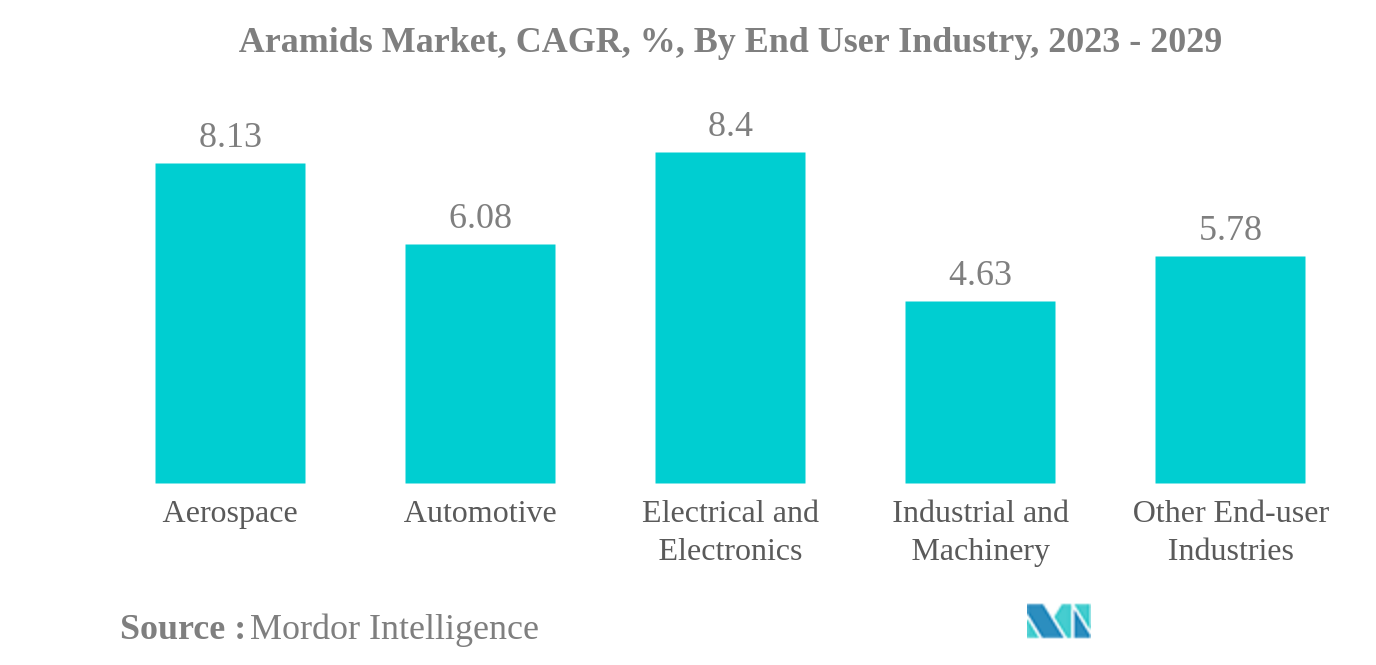
- Electrical and Electronics is the Largest End User Industry. Due to their mechanical, electrical, thermal, and chemical properties, aramids are compounded with different other plastics to be used in the electrical and electronics industry.
- Electrical and Electronics is the Fastest-growing End User Industry. Owing to the high temperature and electrical resistance, the demand for aramids is increasing in electronic applications. Thus, electronics is projected to be the fastest-growing industry.
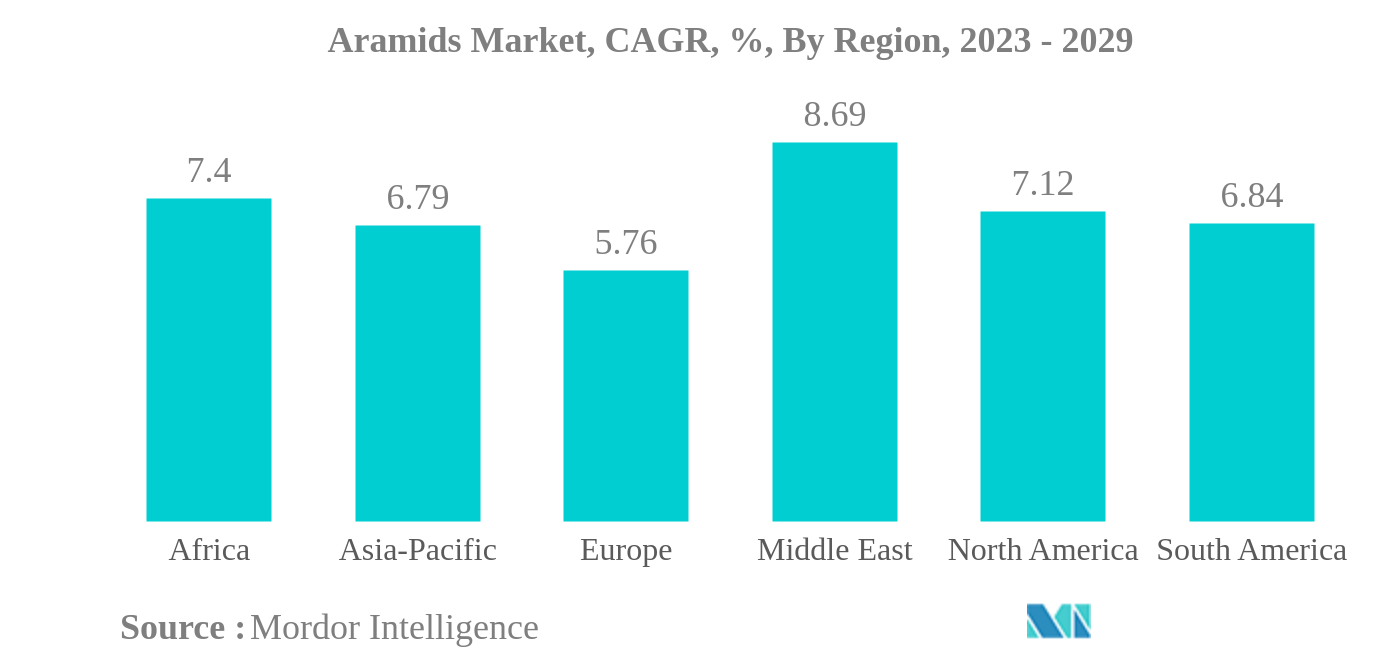
- Asia-Pacific is the Largest Region. Asia-Pacific was driven by major developing economies like India, China, Japan, and South Korea. These countries also happen to be the largest consumers of aramid in automotive, food and beverages, etc.
- Middle East is the Fastest-growing Region. The Middle East witnessed a significant increase in investments in various industries, including automotive and medical. It is projected to have the fastest growth in the market.
Aramids Market Trends
This section covers the major market trends shaping the Aramids Market according to our research experts:
GROWING DEMAND FROM THE ELECTRICAL AND ELECTRONICS INDUSTRY LEADING THE MARKET
- Aramids are sub-resins of polyamide that contain over 85% of an amide bond. They are known for their lightweight, high-strength, high-modulus, high-temperature resistance, and excellent corrosion resistance properties. Their consumption was recorded to be the highest in 2022, with a 9.91% increase in volume over 2021, primarily due to significantly higher demand from the automotive and industrial machinery end-user industry segments.
- The electrical and electronics industry is the largest end-user segment for aramids. It is a highly desirable material for applications such as tough and highly thermal-resistant electrical insulation, certain components in electronics, and primarily in optical fiber and cable reinforcement as a binder. Such high demand from the industry is attributed to the internet's popularity, usability, and dependability, which have increased dramatically over recent years, catalyzing the market for optical fiber cables globally. The demand for aramids is expected to grow at the fastest rate in the electrical and electronics industry, with an anticipated CAGR of 8.4% by value during the forecast period (2023-2029).
- The automotive industry is the second-largest segment of the aramids market, with a share of around 26%. This is owing majorly to properties such as high strength, low flammability, and superior resistance to abrasion and organic solvents. These properties make aramids highly beneficial for applications such as automobile hoses, belts, tire reinforcement, transmission boxes, braking systems, vehicle armor, and airbags. Reductions in rolling resistance, energy usage, and emissions are the significant advantages imparted by aramids in the automotive end-user industry segment, which is projected to register a CAGR of 6.08% by value during the forecast period (2023-2029).
AFRICAN CONSUMER ELECTRONICS INDUSTRY TO DRIVE MARKET EXPANSION
- Aramid is majorly used in the automotive and electrical and electronics end-user industries. Its flame resistance, lightweight, high strength, and corrosion resistance properties make it a highly desirable material for these industries. In 2022, the global demand for aramid grew by 9.19% by volume over the previous year.
- Asia-Pacific is the largest and most profitable region for aramid products, accounting for a consumption share of 74% in 2022. China and Japan are currently the largest consumer nations, owing primarily to their automotive, electrical and electronics, and industrial machinery end-use industry segments. Increasing production of electrical and electronic goods under government initiatives in India is also expected to result in the regional segment leading the market with the highest CAGR of 11.25% by volume during the forecast period.
- Europe is the second-largest regional market, and its primary end-user industries in the aramids market are electrical and electronics and automotive. A significant share of the European market is held by countries such as Germany, Italy, and France, resulting in the region accounting for a consumption share of 50% by volume in 2022. The rising expenditure on their respective aerospace industries by France and the United Kingdom is expected to drive market growth in the region, with CAGRs of 6.83% and 6.92%, respectively, by volume during the forecast period.
- Middle East is the fastest-growing consumer for aramids. It is likely to record a CAGR of 8.69% in terms of value during the forecast period, attributed to growing electrical and electronics industry and aerospace industry, which is expected to grow at a CAGR of 11.47% and 8.77% respectively.
Aramids Industry Overview
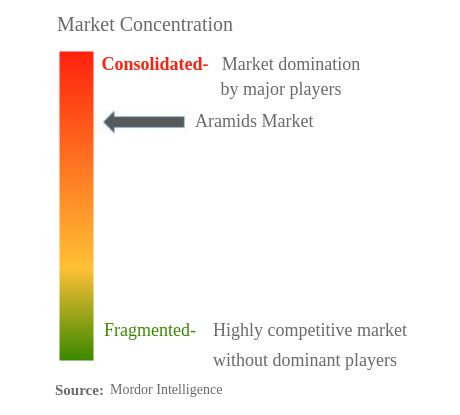
The Aramids Market is fairly consolidated, with the top five companies occupying 84.34%. The major players in this market are DuPont, HYOSUNG ADVANCED MATERIALS., Kolon Industries, Inc., Teijin Limited and Yantai Tayho Advanced Materials Co.,Ltd. (sorted alphabetically).
Aramids Market Leaders
DuPont
HYOSUNG ADVANCED MATERIALS.
Kolon Industries, Inc.
Teijin Limited
Yantai Tayho Advanced Materials Co.,Ltd.
*Disclaimer: Major Players sorted in no particular order
Aramids Market News
- November 2021: A new project of Newstar meta-aramid industrialization was put into production by Yantai Tayho Advanced Materials Co.,Ltd. The project makes use of third-generation meta-aramid manufacturing technology, which is at the forefront of the international market.
- November 2020: Teijin announced plans to expand its production capacity of Aramids by 25% and increase its sales volume across locations.
- April 2020: Yantai Tayho Advanced Materials Co.,Ltd. has successfully launched the trial production of Taparan para-aramid. The increase in capacity due to quality upgrading contributes to the increasing demand for high performance fiber both domestically and globally.
Aramids Market Report - Table of Contents
1. INTRODUCTION
1.1. Study Assumptions & Market Definition
1.2. Scope of the Study
1.3. Research Methodology
2. KEY INDUSTRY TRENDS
2.1. End User Trends
2.2. Regulatory Framework
2.3. Value Chain & Distribution Channel Analysis
3. MARKET SEGMENTATION
3.1. End User Industry
3.1.1. Aerospace
3.1.2. Automotive
3.1.3. Electrical and Electronics
3.1.4. Industrial and Machinery
3.1.5. Other End-user Industries
3.2. Region
3.2.1. Africa
3.2.1.1. By Country
3.2.1.1.1. Nigeria
3.2.1.1.2. South Africa
3.2.1.1.3. Rest of Africa
3.2.2. Asia-Pacific
3.2.2.1. By Country
3.2.2.1.1. Australia
3.2.2.1.2. China
3.2.2.1.3. India
3.2.2.1.4. Japan
3.2.2.1.5. Malaysia
3.2.2.1.6. South Korea
3.2.2.1.7. Rest of Asia-Pacific
3.2.3. Europe
3.2.3.1. By Country
3.2.3.1.1. France
3.2.3.1.2. Germany
3.2.3.1.3. Italy
3.2.3.1.4. Russia
3.2.3.1.5. United Kingdom
3.2.3.1.6. Rest of Europe
3.2.4. Middle East
3.2.4.1. By Country
3.2.4.1.1. Saudi Arabia
3.2.4.1.2. United Arab Emirates
3.2.4.1.3. Rest of Middle East
3.2.5. North America
3.2.5.1. By Country
3.2.5.1.1. Canada
3.2.5.1.2. Mexico
3.2.5.1.3. United States
3.2.6. South America
3.2.6.1. By Country
3.2.6.1.1. Argentina
3.2.6.1.2. Brazil
3.2.6.1.3. Rest of South America
4. COMPETITIVE LANDSCAPE
4.1. Key Strategic Moves
4.2. Market Share Analysis
4.3. Company Landscape
4.4. Company Profiles
4.4.1. China Petroleum & Chemical Corporation
4.4.2. DuPont
4.4.3. Huvis Corp.
4.4.4. HYOSUNG ADVANCED MATERIALS.
4.4.5. JSC "Kamenskvolokno"
4.4.6. Kolon Industries, Inc.
4.4.7. Taekwang Industrial Co., Ltd
4.4.8. Teijin Limited
4.4.9. X-FIPER NEW MATERIAL CO.,LTD
4.4.10. Yantai Tayho Advanced Materials Co.,Ltd.
5. KEY STRATEGIC QUESTIONS FOR ENGINEERING PLASTICS CEOS
6. APPENDIX
6.1. Global Overview
6.1.1. Overview
6.1.2. Porter’s Five Forces Framework
6.1.3. Global Value Chain Analysis
6.1.4. Market Dynamics (DROs)
6.2. Sources & References
6.3. List of Tables & Figures
6.4. Primary Insights
6.5. Data Pack
6.6. Glossary of Terms
List of Tables & Figures
- Figure 1:
- GLOBAL AEROSPACE COMPONENT PRODUCTION, VALUE IN USD, 2017-2029
- Figure 2:
- GLOBAL AUTOMOBILE PRODUCTION, VOLUME IN UNITS, 2017-2029
- Figure 3:
- GLOBAL NEW CONSTRUCTION FLOOR AREA, IN SQUARE FEET, 2017-2029
- Figure 4:
- GLOBAL ELECTRICAL AND ELECTRONICS PRODUCTION, VALUE IN USD, 2017-2029
- Figure 5:
- GLOBAL PLASTIC PACKAGING PRODUCTION, VOLUME IN TONS, 2017-2029
- Figure 6:
- GLOBAL ARAMIDS MARKET, VOLUME, TONS, 2017 - 2029
- Figure 7:
- GLOBAL ARAMIDS MARKET, VALUE, USD, 2017 - 2029
- Figure 8:
- GLOBAL ARAMIDS MARKET, BY END USER INDUSTRY, VOLUME, TONS, 2017 - 2029
- Figure 9:
- GLOBAL ARAMIDS MARKET, BY END USER INDUSTRY, VALUE, USD, 2017 - 2029
- Figure 10:
- GLOBAL ARAMIDS MARKET, BY END USER INDUSTRY, VOLUME SHARE(%), 2017 - 2029
- Figure 11:
- GLOBAL ARAMIDS MARKET, BY END USER INDUSTRY, VALUE SHARE(%), 2017 - 2029
- Figure 12:
- GLOBAL ARAMIDS MARKET, AEROSPACE, VOLUME, TONS, 2017 - 2029
- Figure 13:
- GLOBAL ARAMIDS MARKET, AEROSPACE, VALUE, USD, 2017 - 2029
- Figure 14:
- GLOBAL ARAMIDS MARKET, AEROSPACE, BY REGION, VALUE SHARE(%), 2022 VS 2029
- Figure 15:
- GLOBAL ARAMIDS MARKET, AUTOMOTIVE, VOLUME, TONS, 2017 - 2029
- Figure 16:
- GLOBAL ARAMIDS MARKET, AUTOMOTIVE, VALUE, USD, 2017 - 2029
- Figure 17:
- GLOBAL ARAMIDS MARKET, AUTOMOTIVE, BY REGION, VALUE SHARE(%), 2022 VS 2029
- Figure 18:
- GLOBAL ARAMIDS MARKET, ELECTRICAL AND ELECTRONICS, VOLUME, TONS, 2017 - 2029
- Figure 19:
- GLOBAL ARAMIDS MARKET, ELECTRICAL AND ELECTRONICS, VALUE, USD, 2017 - 2029
- Figure 20:
- GLOBAL ARAMIDS MARKET, ELECTRICAL AND ELECTRONICS, BY REGION, VALUE SHARE(%), 2022 VS 2029
- Figure 21:
- GLOBAL ARAMIDS MARKET, INDUSTRIAL AND MACHINERY, VOLUME, TONS, 2017 - 2029
- Figure 22:
- GLOBAL ARAMIDS MARKET, INDUSTRIAL AND MACHINERY, VALUE, USD, 2017 - 2029
- Figure 23:
- GLOBAL ARAMIDS MARKET, INDUSTRIAL AND MACHINERY, BY REGION, VALUE SHARE(%), 2022 VS 2029
- Figure 24:
- GLOBAL ARAMIDS MARKET, OTHER END-USER INDUSTRIES, VOLUME, TONS, 2017 - 2029
- Figure 25:
- GLOBAL ARAMIDS MARKET, OTHER END-USER INDUSTRIES, VALUE, USD, 2017 - 2029
- Figure 26:
- GLOBAL ARAMIDS MARKET, OTHER END-USER INDUSTRIES, BY REGION, VALUE SHARE(%), 2022 VS 2029
- Figure 27:
- GLOBAL ARAMIDS MARKET, BY REGION, VOLUME, TONS, 2017 - 2029
- Figure 28:
- GLOBAL ARAMIDS MARKET, BY REGION, VALUE, USD, 2017 - 2029
- Figure 29:
- GLOBAL ARAMIDS MARKET, BY REGION, VOLUME SHARE(%), 2017 - 2029
- Figure 30:
- GLOBAL ARAMIDS MARKET, BY REGION, VALUE SHARE(%), 2017 - 2029
- Figure 31:
- GLOBAL ARAMIDS MARKET, BY COUNTRY, AFRICA, VOLUME, TONS, 2017 - 2029
- Figure 32:
- GLOBAL ARAMIDS MARKET, BY COUNTRY, AFRICA, VALUE, USD, 2017 - 2029
- Figure 33:
- GLOBAL ARAMIDS MARKET, BY COUNTRY, AFRICA, VOLUME SHARE(%), 2017 - 2029
- Figure 34:
- GLOBAL ARAMIDS MARKET, BY COUNTRY, AFRICA, VALUE SHARE(%), 2017 - 2029
- Figure 35:
- GLOBAL ARAMIDS MARKET, NIGERIA, VOLUME, TONS, 2017 - 2029
- Figure 36:
- GLOBAL ARAMIDS MARKET, NIGERIA, VALUE, USD, 2017 - 2029
- Figure 37:
- GLOBAL ARAMIDS MARKET, NIGERIA, BY END USER INDUSTRY, VALUE SHARE(%), 2022 VS 2029
- Figure 38:
- GLOBAL ARAMIDS MARKET, SOUTH AFRICA, VOLUME, TONS, 2017 - 2029
- Figure 39:
- GLOBAL ARAMIDS MARKET, SOUTH AFRICA, VALUE, USD, 2017 - 2029
- Figure 40:
- GLOBAL ARAMIDS MARKET, SOUTH AFRICA, BY END USER INDUSTRY, VALUE SHARE(%), 2022 VS 2029
- Figure 41:
- GLOBAL ARAMIDS MARKET, REST OF AFRICA, VOLUME, TONS, 2017 - 2029
- Figure 42:
- GLOBAL ARAMIDS MARKET, REST OF AFRICA, VALUE, USD, 2017 - 2029
- Figure 43:
- GLOBAL ARAMIDS MARKET, REST OF AFRICA, BY END USER INDUSTRY, VALUE SHARE(%), 2022 VS 2029
- Figure 44:
- GLOBAL ARAMIDS MARKET, BY COUNTRY, ASIA-PACIFIC, VOLUME, TONS, 2017 - 2029
- Figure 45:
- GLOBAL ARAMIDS MARKET, BY COUNTRY, ASIA-PACIFIC, VALUE, USD, 2017 - 2029
- Figure 46:
- GLOBAL ARAMIDS MARKET, BY COUNTRY, ASIA-PACIFIC, VOLUME SHARE(%), 2017 - 2029
- Figure 47:
- GLOBAL ARAMIDS MARKET, BY COUNTRY, ASIA-PACIFIC, VALUE SHARE(%), 2017 - 2029
- Figure 48:
- GLOBAL ARAMIDS MARKET, AUSTRALIA, VOLUME, TONS, 2017 - 2029
- Figure 49:
- GLOBAL ARAMIDS MARKET, AUSTRALIA, VALUE, USD, 2017 - 2029
- Figure 50:
- GLOBAL ARAMIDS MARKET, AUSTRALIA, BY END USER INDUSTRY, VALUE SHARE(%), 2022 VS 2029
- Figure 51:
- GLOBAL ARAMIDS MARKET, CHINA, VOLUME, TONS, 2017 - 2029
- Figure 52:
- GLOBAL ARAMIDS MARKET, CHINA, VALUE, USD, 2017 - 2029
- Figure 53:
- GLOBAL ARAMIDS MARKET, CHINA, BY END USER INDUSTRY, VALUE SHARE(%), 2022 VS 2029
- Figure 54:
- GLOBAL ARAMIDS MARKET, INDIA, VOLUME, TONS, 2017 - 2029
- Figure 55:
- GLOBAL ARAMIDS MARKET, INDIA, VALUE, USD, 2017 - 2029
- Figure 56:
- GLOBAL ARAMIDS MARKET, INDIA, BY END USER INDUSTRY, VALUE SHARE(%), 2022 VS 2029
- Figure 57:
- GLOBAL ARAMIDS MARKET, JAPAN, VOLUME, TONS, 2017 - 2029
- Figure 58:
- GLOBAL ARAMIDS MARKET, JAPAN, VALUE, USD, 2017 - 2029
- Figure 59:
- GLOBAL ARAMIDS MARKET, JAPAN, BY END USER INDUSTRY, VALUE SHARE(%), 2022 VS 2029
- Figure 60:
- GLOBAL ARAMIDS MARKET, MALAYSIA, VOLUME, TONS, 2017 - 2029
- Figure 61:
- GLOBAL ARAMIDS MARKET, MALAYSIA, VALUE, USD, 2017 - 2029
- Figure 62:
- GLOBAL ARAMIDS MARKET, MALAYSIA, BY END USER INDUSTRY, VALUE SHARE(%), 2022 VS 2029
- Figure 63:
- GLOBAL ARAMIDS MARKET, SOUTH KOREA, VOLUME, TONS, 2017 - 2029
- Figure 64:
- GLOBAL ARAMIDS MARKET, SOUTH KOREA, VALUE, USD, 2017 - 2029
- Figure 65:
- GLOBAL ARAMIDS MARKET, SOUTH KOREA, BY END USER INDUSTRY, VALUE SHARE(%), 2022 VS 2029
- Figure 66:
- GLOBAL ARAMIDS MARKET, REST OF ASIA-PACIFIC, VOLUME, TONS, 2017 - 2029
- Figure 67:
- GLOBAL ARAMIDS MARKET, REST OF ASIA-PACIFIC, VALUE, USD, 2017 - 2029
- Figure 68:
- GLOBAL ARAMIDS MARKET, REST OF ASIA-PACIFIC, BY END USER INDUSTRY, VALUE SHARE(%), 2022 VS 2029
- Figure 69:
- GLOBAL ARAMIDS MARKET, BY COUNTRY, EUROPE, VOLUME, TONS, 2017 - 2029
- Figure 70:
- GLOBAL ARAMIDS MARKET, BY COUNTRY, EUROPE, VALUE, USD, 2017 - 2029
- Figure 71:
- GLOBAL ARAMIDS MARKET, BY COUNTRY, EUROPE, VOLUME SHARE(%), 2017 - 2029
- Figure 72:
- GLOBAL ARAMIDS MARKET, BY COUNTRY, EUROPE, VALUE SHARE(%), 2017 - 2029
- Figure 73:
- GLOBAL ARAMIDS MARKET, FRANCE, VOLUME, TONS, 2017 - 2029
- Figure 74:
- GLOBAL ARAMIDS MARKET, FRANCE, VALUE, USD, 2017 - 2029
- Figure 75:
- GLOBAL ARAMIDS MARKET, FRANCE, BY END USER INDUSTRY, VALUE SHARE(%), 2022 VS 2029
- Figure 76:
- GLOBAL ARAMIDS MARKET, GERMANY, VOLUME, TONS, 2017 - 2029
- Figure 77:
- GLOBAL ARAMIDS MARKET, GERMANY, VALUE, USD, 2017 - 2029
- Figure 78:
- GLOBAL ARAMIDS MARKET, GERMANY, BY END USER INDUSTRY, VALUE SHARE(%), 2022 VS 2029
- Figure 79:
- GLOBAL ARAMIDS MARKET, ITALY, VOLUME, TONS, 2017 - 2029
- Figure 80:
- GLOBAL ARAMIDS MARKET, ITALY, VALUE, USD, 2017 - 2029
- Figure 81:
- GLOBAL ARAMIDS MARKET, ITALY, BY END USER INDUSTRY, VALUE SHARE(%), 2022 VS 2029
- Figure 82:
- GLOBAL ARAMIDS MARKET, RUSSIA, VOLUME, TONS, 2017 - 2029
- Figure 83:
- GLOBAL ARAMIDS MARKET, RUSSIA, VALUE, USD, 2017 - 2029
- Figure 84:
- GLOBAL ARAMIDS MARKET, RUSSIA, BY END USER INDUSTRY, VALUE SHARE(%), 2022 VS 2029
- Figure 85:
- GLOBAL ARAMIDS MARKET, UNITED KINGDOM, VOLUME, TONS, 2017 - 2029
- Figure 86:
- GLOBAL ARAMIDS MARKET, UNITED KINGDOM, VALUE, USD, 2017 - 2029
- Figure 87:
- GLOBAL ARAMIDS MARKET, UNITED KINGDOM, BY END USER INDUSTRY, VALUE SHARE(%), 2022 VS 2029
- Figure 88:
- GLOBAL ARAMIDS MARKET, REST OF EUROPE, VOLUME, TONS, 2017 - 2029
- Figure 89:
- GLOBAL ARAMIDS MARKET, REST OF EUROPE, VALUE, USD, 2017 - 2029
- Figure 90:
- GLOBAL ARAMIDS MARKET, REST OF EUROPE, BY END USER INDUSTRY, VALUE SHARE(%), 2022 VS 2029
- Figure 91:
- GLOBAL ARAMIDS MARKET, BY COUNTRY, MIDDLE EAST, VOLUME, TONS, 2017 - 2029
- Figure 92:
- GLOBAL ARAMIDS MARKET, BY COUNTRY, MIDDLE EAST, VALUE, USD, 2017 - 2029
- Figure 93:
- GLOBAL ARAMIDS MARKET, BY COUNTRY, MIDDLE EAST, VOLUME SHARE(%), 2017 - 2029
- Figure 94:
- GLOBAL ARAMIDS MARKET, BY COUNTRY, MIDDLE EAST, VALUE SHARE(%), 2017 - 2029
- Figure 95:
- GLOBAL ARAMIDS MARKET, SAUDI ARABIA, VOLUME, TONS, 2017 - 2029
- Figure 96:
- GLOBAL ARAMIDS MARKET, SAUDI ARABIA, VALUE, USD, 2017 - 2029
- Figure 97:
- GLOBAL ARAMIDS MARKET, SAUDI ARABIA, BY END USER INDUSTRY, VALUE SHARE(%), 2022 VS 2029
- Figure 98:
- GLOBAL ARAMIDS MARKET, UNITED ARAB EMIRATES, VOLUME, TONS, 2017 - 2029
- Figure 99:
- GLOBAL ARAMIDS MARKET, UNITED ARAB EMIRATES, VALUE, USD, 2017 - 2029
- Figure 100:
- GLOBAL ARAMIDS MARKET, UNITED ARAB EMIRATES, BY END USER INDUSTRY, VALUE SHARE(%), 2022 VS 2029
- Figure 101:
- GLOBAL ARAMIDS MARKET, REST OF MIDDLE EAST, VOLUME, TONS, 2017 - 2029
- Figure 102:
- GLOBAL ARAMIDS MARKET, REST OF MIDDLE EAST, VALUE, USD, 2017 - 2029
- Figure 103:
- GLOBAL ARAMIDS MARKET, REST OF MIDDLE EAST, BY END USER INDUSTRY, VALUE SHARE(%), 2022 VS 2029
- Figure 104:
- GLOBAL ARAMIDS MARKET, BY COUNTRY, NORTH AMERICA, VOLUME, TONS, 2017 - 2029
- Figure 105:
- GLOBAL ARAMIDS MARKET, BY COUNTRY, NORTH AMERICA, VALUE, USD, 2017 - 2029
- Figure 106:
- GLOBAL ARAMIDS MARKET, BY COUNTRY, NORTH AMERICA, VOLUME SHARE(%), 2017 - 2029
- Figure 107:
- GLOBAL ARAMIDS MARKET, BY COUNTRY, NORTH AMERICA, VALUE SHARE(%), 2017 - 2029
- Figure 108:
- GLOBAL ARAMIDS MARKET, CANADA, VOLUME, TONS, 2017 - 2029
- Figure 109:
- GLOBAL ARAMIDS MARKET, CANADA, VALUE, USD, 2017 - 2029
- Figure 110:
- GLOBAL ARAMIDS MARKET, CANADA, BY END USER INDUSTRY, VALUE SHARE(%), 2022 VS 2029
- Figure 111:
- GLOBAL ARAMIDS MARKET, MEXICO, VOLUME, TONS, 2017 - 2029
- Figure 112:
- GLOBAL ARAMIDS MARKET, MEXICO, VALUE, USD, 2017 - 2029
- Figure 113:
- GLOBAL ARAMIDS MARKET, MEXICO, BY END USER INDUSTRY, VALUE SHARE(%), 2022 VS 2029
- Figure 114:
- GLOBAL ARAMIDS MARKET, UNITED STATES, VOLUME, TONS, 2017 - 2029
- Figure 115:
- GLOBAL ARAMIDS MARKET, UNITED STATES, VALUE, USD, 2017 - 2029
- Figure 116:
- GLOBAL ARAMIDS MARKET, UNITED STATES, BY END USER INDUSTRY, VALUE SHARE(%), 2022 VS 2029
- Figure 117:
- GLOBAL ARAMIDS MARKET, BY COUNTRY, SOUTH AMERICA, VOLUME, TONS, 2017 - 2029
- Figure 118:
- GLOBAL ARAMIDS MARKET, BY COUNTRY, SOUTH AMERICA, VALUE, USD, 2017 - 2029
- Figure 119:
- GLOBAL ARAMIDS MARKET, BY COUNTRY, SOUTH AMERICA, VOLUME SHARE(%), 2017 - 2029
- Figure 120:
- GLOBAL ARAMIDS MARKET, BY COUNTRY, SOUTH AMERICA, VALUE SHARE(%), 2017 - 2029
- Figure 121:
- GLOBAL ARAMIDS MARKET, ARGENTINA, VOLUME, TONS, 2017 - 2029
- Figure 122:
- GLOBAL ARAMIDS MARKET, ARGENTINA, VALUE, USD, 2017 - 2029
- Figure 123:
- GLOBAL ARAMIDS MARKET, ARGENTINA, BY END USER INDUSTRY, VALUE SHARE(%), 2022 VS 2029
- Figure 124:
- GLOBAL ARAMIDS MARKET, BRAZIL, VOLUME, TONS, 2017 - 2029
- Figure 125:
- GLOBAL ARAMIDS MARKET, BRAZIL, VALUE, USD, 2017 - 2029
- Figure 126:
- GLOBAL ARAMIDS MARKET, BRAZIL, BY END USER INDUSTRY, VALUE SHARE(%), 2022 VS 2029
- Figure 127:
- GLOBAL ARAMIDS MARKET, REST OF SOUTH AMERICA, VOLUME, TONS, 2017 - 2029
- Figure 128:
- GLOBAL ARAMIDS MARKET, REST OF SOUTH AMERICA, VALUE, USD, 2017 - 2029
- Figure 129:
- GLOBAL ARAMIDS MARKET, REST OF SOUTH AMERICA, BY END USER INDUSTRY, VALUE SHARE(%), 2022 VS 2029
- Figure 130:
- GLOBAL ARAMIDS MARKET, MOST ACTIVE COMPANIES, BY NUMBER OF STRATEGIC MOVES, 2019 - 2021
- Figure 131:
- GLOBAL ARAMIDS MARKET, MOST ADOPTED STRATEGIES, 2019 - 2021
- Figure 132:
- GLOBAL POLYAMIDE (PA) MARKET SHARE(%), BY MAJOR PLAYERS PRODUCTION CAPACITY, 2022
Aramids Industry Segmentation
Aerospace, Automotive, Electrical and Electronics, Industrial and Machinery are covered as segments by End User Industry. Africa, Asia-Pacific, Europe, Middle East, North America, South America are covered as segments by Region.| End User Industry | |
| Aerospace | |
| Automotive | |
| Electrical and Electronics | |
| Industrial and Machinery | |
| Other End-user Industries |
| Region | |||||||||||
| |||||||||||
| |||||||||||
| |||||||||||
| |||||||||||
| |||||||||||
|
Market Definition
- End-user Industry - Automotive, Electrical & Electronics, Industrial & Machinery, Aerospace, and Others are the end-user industries considered under the aramid market.
- Resin - Under the scope of the study, consumption of virgin aramid resin in the primary forms such as powder, pellet, etc. are considered.
Research Methodology
Mordor Intelligence follows a four-step methodology in all our reports.
- Step-1: Identify Key Variables: The quantifiable key variables (industry and extraneous) pertaining to the specific product segment and country are selected from a group of relevant variables & factors based on desk research & literature review; along with primary expert inputs. These variables are further confirmed through regression modeling (wherever required).
- Step-2: Build a Market Model: In order to build a robust forecasting methodology, the variables and factors identified in Step-1 are tested against available historical market numbers. Through an iterative process, the variables required for market forecast are set and the model is built on the basis of these variables.
- Step-3: Validate and Finalize: In this important step, all market numbers, variables and analyst calls are validated through an extensive network of primary research experts from the market studied. The respondents are selected across levels and functions to generate a holistic picture of the market studied.
- Step-4: Research Outputs: Syndicated Reports, Custom Consulting Assignments, Databases & Subscription Platforms


