Asia-Pacific Agricultural Biologicals Market Size

| Icons | Lable | Value |
|---|---|---|
|
|
Study Period | 2017 - 2029 |
|
|
Base Year For Estimation | 2022 |
|
|
CAGR | 8.72 % |
|
|
Largest Share by Function | Crop Nutrition |
|
|
Largest Share by Country | China |
|
|
Market Concentration | High |
Major Players |
||
|
|
||
|
*Disclaimer: Major Players sorted in no particular order |
Asia-Pacific Agricultural Biologicals Market Analysis
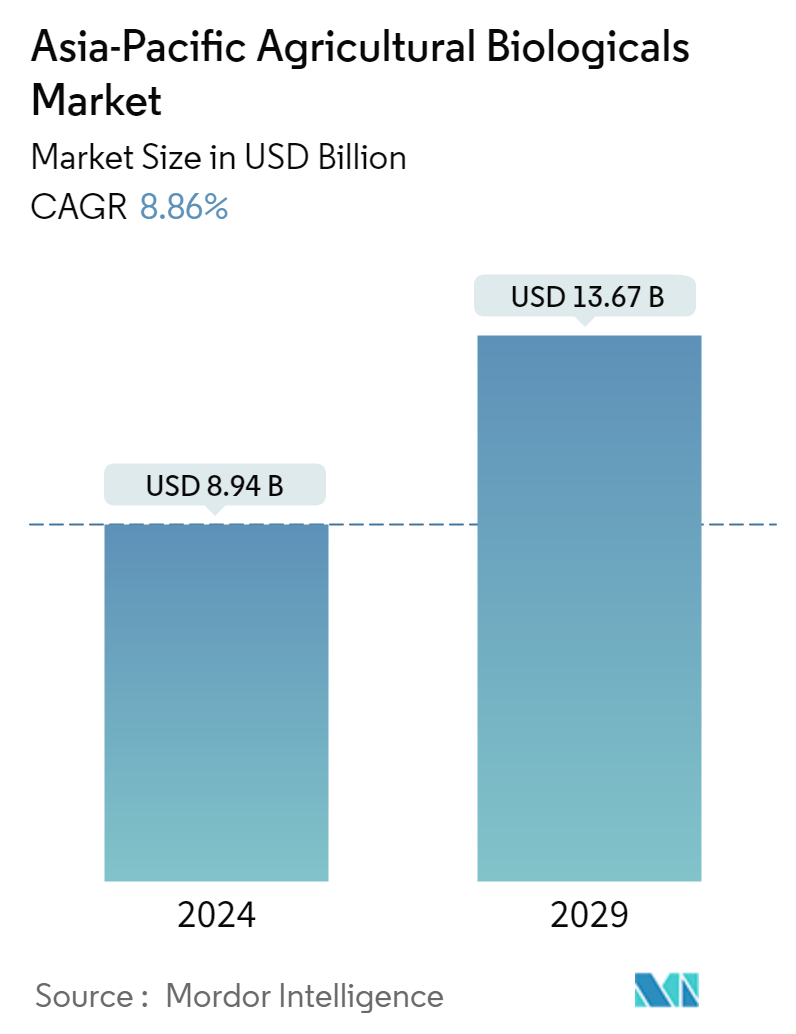
The Asia-Pacific Agricultural Biologicals Market is projected to register a CAGR of 8.72%
- Macrobials is the Largest Form : Predators dominated the macrobials segment with a market share of 87.1% in 2022. The dominance of the predators' segment is mainly due to their ability to attack pests.
- Organic Fertilizer is the Largest Type : Organic fertilizers are the most consumed fertilizers in Asia pacific region under agricultural biologicals. Manure as organic fertilizer is dominant in the region.
- Row Crops is the Largest Crop Type : The dominance of row crops is mostly attributable to their extensive organic cultivation area, which in 2022 accounted for 67.5% of all organic crop land in the region.
- China is the Largest Country : China is the major market for agricultural biologicals market in the region, and crop nutrition products are holding major market share in the country with 86.4% in 2022.
Asia-Pacific Agricultural Biologicals Market Trends
This section covers the major market trends shaping the Asia-Pacific Agricultural Biologicals Market according to our research experts:
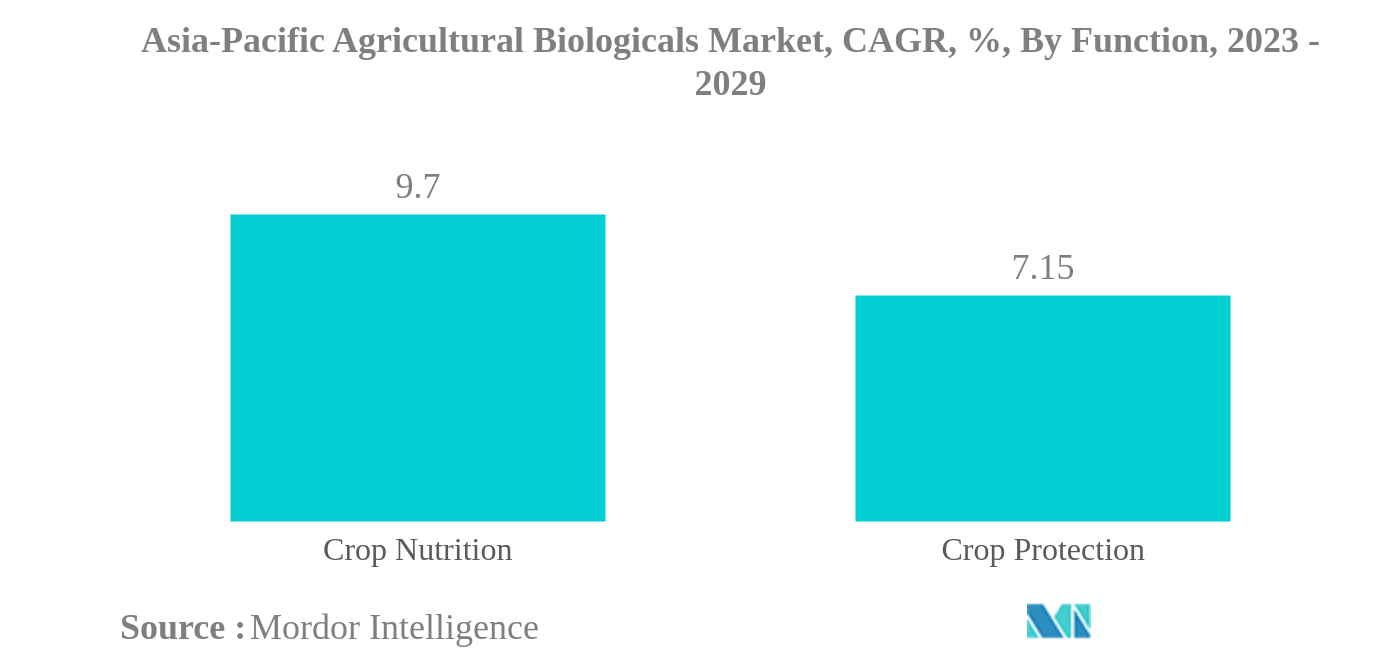
Crop Nutrition is the largest Function
- In the Asia-Pacific region, agricultural biologicals play a key role in sustainable agriculture. These products reduce the use of chemical fertilizers and pesticides by providing required nutrients and controlling pests and insects in crops. The agricultural biologicals market in the region is growing Y-o-Y. From 2017 to 2022, the market value increased by 9.4%.
- The demand for biological solutions in Asia-Pacific is being driven primarily by export markets such as the European Union, which is tightening regulations on the use of some conventional pesticides and local consumer and customer demand for more sustainably grown food. Thus, more growers are showing a growing interest in alternative solutions. The most promising segments are high-value fruits and vegetables (e.g., berries and grapes) eaten fresh and crops grown in greenhouses.
- PAN Asia Pacific (PANAP), one of five regional centers of the Pesticide Action Network, is creating an awareness campaign regarding the harmful effects of pesticides on humans and the environment and promoting biodiversity-based ecological agriculture.
- Countries such as China, India, Australia, and Indonesia are adopting organic farming strategies. China and India are the major countries holding shares of 51.3% and 31.6%, respectively, of the agricultural biologicals market in the region. These countries are implementing different initiatives to encourage organic farming and agricultural biologicals usage widely. For instance, China is planning to reduce 10% and 5% pesticide usage in horticultural crops and row crops, respectively. India, through many initiatives like PKVY and MOVCDNER, provides financial support to farmers to buy agricultural biologicals for organic farming.
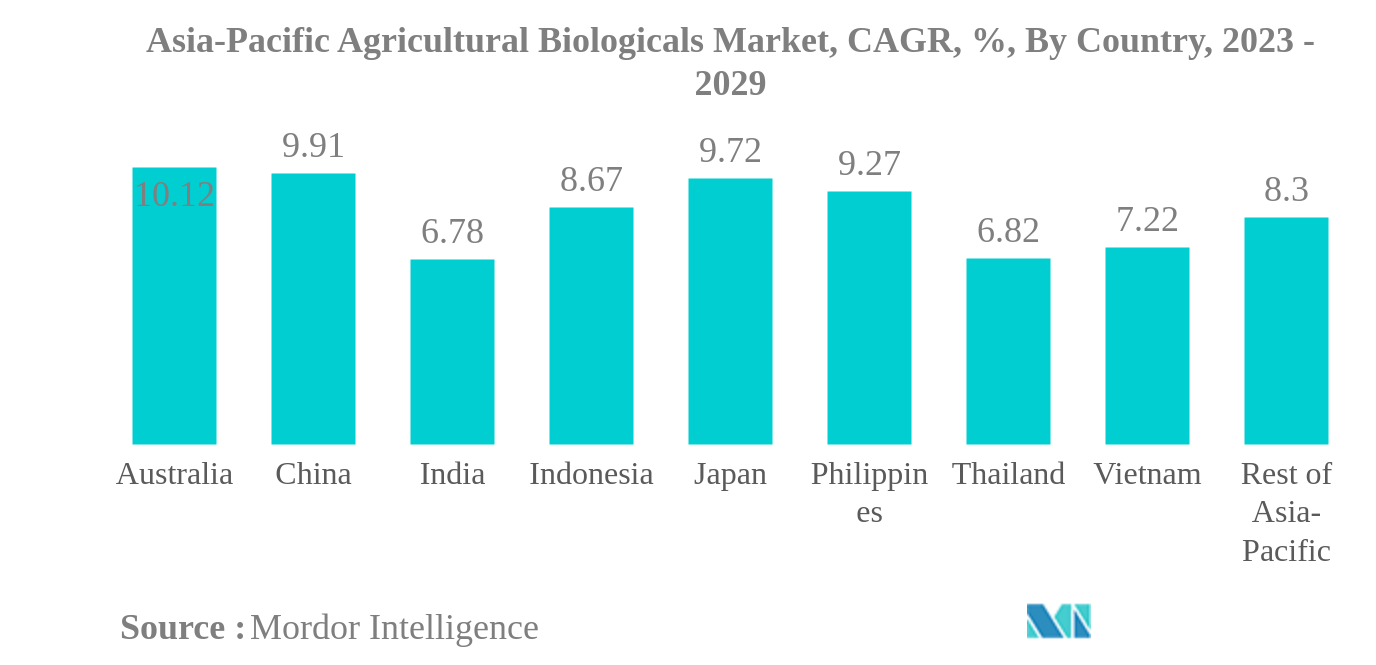
China is the largest Country
- The Asia-Pacific region is one of the world's major organic producers. Rice, sugarcane, and fresh fruits and vegetables are among the major organic crops cultivated in the region. China and India are the region's main organic crop producers and have the highest organic product consumption markets.
- The area of the region that was organically farmed increased significantly over the historical period (2017–2022), rising from 3.1 million hectares in 2017 to 3.8 million hectares in 2022. The region's biologicals market increased by 10.1% during the historical period and is expected to increase by about 65.1% over the forecast period, reaching USD 13.6 billion by the end of the forecast period.
- As an individual country, China dominated the Asia-Pacific agricultural biologicals market in 2022 by 75.6% of the market value and 80.7% of the market volume. India occupied second place with 16.9%, the Rest of Asia-Pacific held 3.3%, and Indonesia held 1.5% of the total Asia-Pacific biologicals market values the same year.
- In 2022, row crops in the Asia-Pacific region consumed more biological fertilizers, accounting for 80.3% of the total market value. This is due to the region's huge area under cultivation of field crops, as they are the stable food in many countries in the region. This is followed by cash crops and horticultural crops, which had 11.0% and 8.6% shares, respectively, in the same year.
- The rising trend in organic crop areas and the rising demand for organic products and organic fertilizers reduce overall chemical fertilizer use. The overall cost of crop production and government attempts to encourage organic farming are expected to drive the Asia-Pacific biologicals market during the forecast period.
Asia-Pacific Agricultural Biologicals Industry Overview
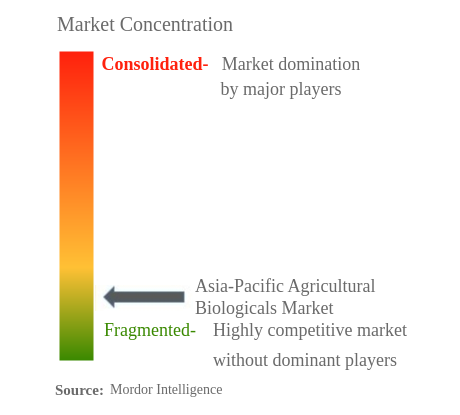
The Asia-Pacific Agricultural Biologicals Market is fragmented, with the top five companies occupying 6.30%. The major players in this market are Biolchim SpA, Coromandel International Ltd, Gujarat State Fertilizers & Chemicals Ltd, Indian Farmers Fertiliser Cooperative Limited and Koppert Biological Systems Inc. (sorted alphabetically).
Asia-Pacific Agricultural Biologicals Market Leaders
Biolchim SpA
Coromandel International Ltd
Gujarat State Fertilizers & Chemicals Ltd
Indian Farmers Fertiliser Cooperative Limited
Koppert Biological Systems Inc.
*Disclaimer: Major Players sorted in no particular order
Asia-Pacific Agricultural Biologicals Market News
- September 2022: To expand GSFC's agro-products portfolio, the company planned to enter into organic fertilizers by setting up a 2x200 MTPD PROM plant at a polymer unit by using available existing infrastructure.
- April 2022: The company approved the merger between Liberty Pesticides and Fertilizers Limited (LPFL) and Coromandel SQM (India) Private Limited (CSQM) (wholly-owned subsidiaries), which came into effect on April 01, 2021.
- February 2022: Gujarat State Fertilizers & Chemicals Ltd launched the Urban Sardar organic fertilizer, an eco-friendly and non-toxic product containing organic sources of nutrients best suitable for all flowering plants and ornamental plants, gardens, and kitchen gardening.
Asia-Pacific Agricultural Biologicals Market Report - Table of Contents
EXECUTIVE SUMMARY & KEY FINDINGS
REPORT OFFERS
1. INTRODUCTION
1.1. Study Assumptions & Market Definition
1.2. Scope of the Study
1.3. Research Methodology
2. KEY INDUSTRY TRENDS
2.1. Area Under Organic Cultivation
2.2. Per Capita Spending On Organic Products
2.3. Regulatory Framework
2.4. Value Chain & Distribution Channel Analysis
3. MARKET SEGMENTATION
3.1. Function
3.1.1. Crop Nutrition
3.1.1.1. Biofertilizer
3.1.1.1.1. Azospirillum
3.1.1.1.2. Azotobacter
3.1.1.1.3. Mycorrhiza
3.1.1.1.4. Phosphate Solubilizing Bacteria
3.1.1.1.5. Rhizobium
3.1.1.1.6. Other Biofertilizers
3.1.1.2. Biostimulants
3.1.1.2.1. Amino Acids
3.1.1.2.2. Fulvic Acid
3.1.1.2.3. Humic Acid
3.1.1.2.4. Protein Hydrolysates
3.1.1.2.5. Seaweed Extracts
3.1.1.2.6. Other Biostimulants
3.1.1.3. Organic Fertilizer
3.1.1.3.1. Manure
3.1.1.3.2. Meal Based Fertilizers
3.1.1.3.3. Oilcakes
3.1.1.3.4. Other Organic Fertilizers
3.1.2. Crop Protection
3.1.2.1. Biocontrol Agents
3.1.2.1.1. Macrobials
3.1.2.1.2. Microbials
3.1.2.2. Biopesticides
3.1.2.2.1. Biofungicides
3.1.2.2.2. Bioherbicides
3.1.2.2.3. Bioinsecticides
3.1.2.2.4. Other Biopesticides
3.2. Crop Type
3.2.1. Cash Crops
3.2.2. Horticultural Crops
3.2.3. Row Crops
3.3. Country
3.3.1. Australia
3.3.2. China
3.3.3. India
3.3.4. Indonesia
3.3.5. Japan
3.3.6. Philippines
3.3.7. Thailand
3.3.8. Vietnam
3.3.9. Rest Of Asia-Pacific
4. COMPETITIVE LANDSCAPE
4.1. Key Strategic Moves
4.2. Market Share Analysis
4.3. Company Landscape
4.4. Company Profiles
4.4.1. Biolchim SpA
4.4.2. Coromandel International Ltd
4.4.3. Genliduo Bio-tech Corporation Ltd
4.4.4. Gujarat State Fertilizers & Chemicals Ltd
4.4.5. Indian Farmers Fertiliser Cooperative Limited
4.4.6. Koppert Biological Systems Inc.
4.4.7. Novozymes
4.4.8. Suståne Natural Fertilizer Inc.
4.4.9. Valagro
4.4.10. Valent Biosciences LLC
5. KEY STRATEGIC QUESTIONS FOR AGRICULTURAL BIOLOGICALS CEOS
6. APPENDIX
6.1. Global Overview
6.1.1. Overview
6.1.2. Porter’s Five Forces Framework
6.1.3. Global Value Chain Analysis
6.1.4. Market Dynamics (DROs)
6.2. Sources & References
6.3. List of Tables & Figures
6.4. Primary Insights
6.5. Data Pack
6.6. Glossary of Terms
List of Tables & Figures
- Figure 1:
- ASIA-PACIFIC AGRICULTURAL BIOLOGICALS MARKET, AREA UNDER ORGANIC CULTIVATION, HECTARES, 2017 - 2022
- Figure 2:
- ASIA-PACIFIC AGRICULTURAL BIOLOGICALS MARKET, PER CAPITA SPENDING ON ORGANIC PRODUCTS, USD, 2017 - 2022
- Figure 3:
- ASIA-PACIFIC AGRICULTURAL BIOLOGICALS MARKET, VOLUME, METRIC TON, 2017 - 2029
- Figure 4:
- ASIA-PACIFIC AGRICULTURAL BIOLOGICALS MARKET, VALUE, USD, 2017 - 2029
- Figure 5:
- ASIA-PACIFIC AGRICULTURAL BIOLOGICALS MARKET, BY FUNCTION, VOLUME, METRIC TON, 2017 - 2029
- Figure 6:
- ASIA-PACIFIC AGRICULTURAL BIOLOGICALS MARKET, BY FUNCTION, VALUE, USD, 2017 - 2029
- Figure 7:
- ASIA-PACIFIC AGRICULTURAL BIOLOGICALS MARKET, VOLUME SHARE(%), BY FUNCTION, 2017 - 2029
- Figure 8:
- ASIA-PACIFIC AGRICULTURAL BIOLOGICALS MARKET, VALUE SHARE(%), BY FUNCTION, 2017 - 2029
- Figure 9:
- ASIA-PACIFIC AGRICULTURAL BIOLOGICALS MARKET, BY TYPE, VOLUME, METRIC TON, 2017 - 2029
- Figure 10:
- ASIA-PACIFIC AGRICULTURAL BIOLOGICALS MARKET, BY TYPE, VALUE, USD, 2017 - 2029
- Figure 11:
- ASIA-PACIFIC AGRICULTURAL BIOLOGICALS MARKET, VOLUME SHARE(%), BY TYPE, 2017 - 2029
- Figure 12:
- ASIA-PACIFIC AGRICULTURAL BIOLOGICALS MARKET, VALUE SHARE(%), BY TYPE, 2017 - 2029
- Figure 13:
- ASIA-PACIFIC AGRICULTURAL BIOLOGICALS MARKET, BY FORM, VOLUME, METRIC TON, 2017 - 2029
- Figure 14:
- ASIA-PACIFIC AGRICULTURAL BIOLOGICALS MARKET, BY FORM, VALUE, USD, 2017 - 2029
- Figure 15:
- ASIA-PACIFIC AGRICULTURAL BIOLOGICALS MARKET, VOLUME SHARE(%), BY FORM, 2017 - 2029
- Figure 16:
- ASIA-PACIFIC AGRICULTURAL BIOLOGICALS MARKET, VALUE SHARE(%), BY FORM, 2017 - 2029
- Figure 17:
- ASIA-PACIFIC AGRICULTURAL BIOLOGICALS MARKET, BY FORM, VOLUME, METRIC TON, 2017 - 2029
- Figure 18:
- ASIA-PACIFIC AGRICULTURAL BIOLOGICALS MARKET, BY FORM, VALUE, USD, 2017 - 2029
- Figure 19:
- ASIA-PACIFIC AGRICULTURAL BIOLOGICALS MARKET, VALUE SHARE(%), BY CROP TYPE, 2022 - 2029
- Figure 20:
- ASIA-PACIFIC AGRICULTURAL BIOLOGICALS MARKET, BY FORM, VOLUME, METRIC TON, 2017 - 2029
- Figure 21:
- ASIA-PACIFIC AGRICULTURAL BIOLOGICALS MARKET, BY FORM, VALUE, USD, 2017 - 2029
- Figure 22:
- ASIA-PACIFIC AGRICULTURAL BIOLOGICALS MARKET, VALUE SHARE(%), BY CROP TYPE, 2022 - 2029
- Figure 23:
- ASIA-PACIFIC AGRICULTURAL BIOLOGICALS MARKET, BY FORM, VOLUME, METRIC TON, 2017 - 2029
- Figure 24:
- ASIA-PACIFIC AGRICULTURAL BIOLOGICALS MARKET, BY FORM, VALUE, USD, 2017 - 2029
- Figure 25:
- ASIA-PACIFIC AGRICULTURAL BIOLOGICALS MARKET, VALUE SHARE(%), BY CROP TYPE, 2022 - 2029
- Figure 26:
- ASIA-PACIFIC AGRICULTURAL BIOLOGICALS MARKET, BY FORM, VOLUME, METRIC TON, 2017 - 2029
- Figure 27:
- ASIA-PACIFIC AGRICULTURAL BIOLOGICALS MARKET, BY FORM, VALUE, USD, 2017 - 2029
- Figure 28:
- ASIA-PACIFIC AGRICULTURAL BIOLOGICALS MARKET, VALUE SHARE(%), BY CROP TYPE, 2022 - 2029
- Figure 29:
- ASIA-PACIFIC AGRICULTURAL BIOLOGICALS MARKET, BY FORM, VOLUME, METRIC TON, 2017 - 2029
- Figure 30:
- ASIA-PACIFIC AGRICULTURAL BIOLOGICALS MARKET, BY FORM, VALUE, USD, 2017 - 2029
- Figure 31:
- ASIA-PACIFIC AGRICULTURAL BIOLOGICALS MARKET, VALUE SHARE(%), BY CROP TYPE, 2022 - 2029
- Figure 32:
- ASIA-PACIFIC AGRICULTURAL BIOLOGICALS MARKET, BY FORM, VOLUME, METRIC TON, 2017 - 2029
- Figure 33:
- ASIA-PACIFIC AGRICULTURAL BIOLOGICALS MARKET, BY FORM, VALUE, USD, 2017 - 2029
- Figure 34:
- ASIA-PACIFIC AGRICULTURAL BIOLOGICALS MARKET, VALUE SHARE(%), BY CROP TYPE, 2022 - 2029
- Figure 35:
- ASIA-PACIFIC AGRICULTURAL BIOLOGICALS MARKET, BY FORM, VOLUME, METRIC TON, 2017 - 2029
- Figure 36:
- ASIA-PACIFIC AGRICULTURAL BIOLOGICALS MARKET, BY FORM, VALUE, USD, 2017 - 2029
- Figure 37:
- ASIA-PACIFIC AGRICULTURAL BIOLOGICALS MARKET, VOLUME SHARE(%), BY FORM, 2017 - 2029
- Figure 38:
- ASIA-PACIFIC AGRICULTURAL BIOLOGICALS MARKET, VALUE SHARE(%), BY FORM, 2017 - 2029
- Figure 39:
- ASIA-PACIFIC AGRICULTURAL BIOLOGICALS MARKET, BY FORM, VOLUME, METRIC TON, 2017 - 2029
- Figure 40:
- ASIA-PACIFIC AGRICULTURAL BIOLOGICALS MARKET, BY FORM, VALUE, USD, 2017 - 2029
- Figure 41:
- ASIA-PACIFIC AGRICULTURAL BIOLOGICALS MARKET, VALUE SHARE(%), BY CROP TYPE, 2022 - 2029
- Figure 42:
- ASIA-PACIFIC AGRICULTURAL BIOLOGICALS MARKET, BY FORM, VOLUME, METRIC TON, 2017 - 2029
- Figure 43:
- ASIA-PACIFIC AGRICULTURAL BIOLOGICALS MARKET, BY FORM, VALUE, USD, 2017 - 2029
- Figure 44:
- ASIA-PACIFIC AGRICULTURAL BIOLOGICALS MARKET, VALUE SHARE(%), BY CROP TYPE, 2022 - 2029
- Figure 45:
- ASIA-PACIFIC AGRICULTURAL BIOLOGICALS MARKET, BY FORM, VOLUME, METRIC TON, 2017 - 2029
- Figure 46:
- ASIA-PACIFIC AGRICULTURAL BIOLOGICALS MARKET, BY FORM, VALUE, USD, 2017 - 2029
- Figure 47:
- ASIA-PACIFIC AGRICULTURAL BIOLOGICALS MARKET, VALUE SHARE(%), BY CROP TYPE, 2022 - 2029
- Figure 48:
- ASIA-PACIFIC AGRICULTURAL BIOLOGICALS MARKET, BY FORM, VOLUME, METRIC TON, 2017 - 2029
- Figure 49:
- ASIA-PACIFIC AGRICULTURAL BIOLOGICALS MARKET, BY FORM, VALUE, USD, 2017 - 2029
- Figure 50:
- ASIA-PACIFIC AGRICULTURAL BIOLOGICALS MARKET, VALUE SHARE(%), BY CROP TYPE, 2022 - 2029
- Figure 51:
- ASIA-PACIFIC AGRICULTURAL BIOLOGICALS MARKET, BY FORM, VOLUME, METRIC TON, 2017 - 2029
- Figure 52:
- ASIA-PACIFIC AGRICULTURAL BIOLOGICALS MARKET, BY FORM, VALUE, USD, 2017 - 2029
- Figure 53:
- ASIA-PACIFIC AGRICULTURAL BIOLOGICALS MARKET, VALUE SHARE(%), BY CROP TYPE, 2022 - 2029
- Figure 54:
- ASIA-PACIFIC AGRICULTURAL BIOLOGICALS MARKET, BY FORM, VOLUME, METRIC TON, 2017 - 2029
- Figure 55:
- ASIA-PACIFIC AGRICULTURAL BIOLOGICALS MARKET, BY FORM, VALUE, USD, 2017 - 2029
- Figure 56:
- ASIA-PACIFIC AGRICULTURAL BIOLOGICALS MARKET, VALUE SHARE(%), BY CROP TYPE, 2022 - 2029
- Figure 57:
- ASIA-PACIFIC AGRICULTURAL BIOLOGICALS MARKET, BY FORM, VOLUME, METRIC TON, 2017 - 2029
- Figure 58:
- ASIA-PACIFIC AGRICULTURAL BIOLOGICALS MARKET, BY FORM, VALUE, USD, 2017 - 2029
- Figure 59:
- ASIA-PACIFIC AGRICULTURAL BIOLOGICALS MARKET, VOLUME SHARE(%), BY FORM, 2017 - 2029
- Figure 60:
- ASIA-PACIFIC AGRICULTURAL BIOLOGICALS MARKET, VALUE SHARE(%), BY FORM, 2017 - 2029
- Figure 61:
- ASIA-PACIFIC AGRICULTURAL BIOLOGICALS MARKET, BY FORM, VOLUME, METRIC TON, 2017 - 2029
- Figure 62:
- ASIA-PACIFIC AGRICULTURAL BIOLOGICALS MARKET, BY FORM, VALUE, USD, 2017 - 2029
- Figure 63:
- ASIA-PACIFIC AGRICULTURAL BIOLOGICALS MARKET, VALUE SHARE(%), BY CROP TYPE, 2022 - 2029
- Figure 64:
- ASIA-PACIFIC AGRICULTURAL BIOLOGICALS MARKET, BY FORM, VOLUME, METRIC TON, 2017 - 2029
- Figure 65:
- ASIA-PACIFIC AGRICULTURAL BIOLOGICALS MARKET, BY FORM, VALUE, USD, 2017 - 2029
- Figure 66:
- ASIA-PACIFIC AGRICULTURAL BIOLOGICALS MARKET, VALUE SHARE(%), BY CROP TYPE, 2022 - 2029
- Figure 67:
- ASIA-PACIFIC AGRICULTURAL BIOLOGICALS MARKET, BY FORM, VOLUME, METRIC TON, 2017 - 2029
- Figure 68:
- ASIA-PACIFIC AGRICULTURAL BIOLOGICALS MARKET, BY FORM, VALUE, USD, 2017 - 2029
- Figure 69:
- ASIA-PACIFIC AGRICULTURAL BIOLOGICALS MARKET, VALUE SHARE(%), BY CROP TYPE, 2022 - 2029
- Figure 70:
- ASIA-PACIFIC AGRICULTURAL BIOLOGICALS MARKET, BY FORM, VOLUME, METRIC TON, 2017 - 2029
- Figure 71:
- ASIA-PACIFIC AGRICULTURAL BIOLOGICALS MARKET, BY FORM, VALUE, USD, 2017 - 2029
- Figure 72:
- ASIA-PACIFIC AGRICULTURAL BIOLOGICALS MARKET, VALUE SHARE(%), BY CROP TYPE, 2022 - 2029
- Figure 73:
- ASIA-PACIFIC AGRICULTURAL BIOLOGICALS MARKET, BY TYPE, VOLUME, METRIC TON, 2017 - 2029
- Figure 74:
- ASIA-PACIFIC AGRICULTURAL BIOLOGICALS MARKET, BY TYPE, VALUE, USD, 2017 - 2029
- Figure 75:
- ASIA-PACIFIC AGRICULTURAL BIOLOGICALS MARKET, VOLUME SHARE(%), BY TYPE, 2017 - 2029
- Figure 76:
- ASIA-PACIFIC AGRICULTURAL BIOLOGICALS MARKET, VALUE SHARE(%), BY TYPE, 2017 - 2029
- Figure 77:
- ASIA-PACIFIC AGRICULTURAL BIOLOGICALS MARKET, BY FORM, VOLUME, GRAM, 2017 - 2029
- Figure 78:
- ASIA-PACIFIC AGRICULTURAL BIOLOGICALS MARKET, BY FORM, VALUE, USD, 2017 - 2029
- Figure 79:
- ASIA-PACIFIC AGRICULTURAL BIOLOGICALS MARKET, VOLUME SHARE(%), BY FORM, 2017 - 2029
- Figure 80:
- ASIA-PACIFIC AGRICULTURAL BIOLOGICALS MARKET, VALUE SHARE(%), BY FORM, 2017 - 2029
- Figure 81:
- ASIA-PACIFIC AGRICULTURAL BIOLOGICALS MARKET, BY FORM, VOLUME, GRAM, 2017 - 2029
- Figure 82:
- ASIA-PACIFIC AGRICULTURAL BIOLOGICALS MARKET, BY FORM, VALUE, USD, 2017 - 2029
- Figure 83:
- ASIA-PACIFIC AGRICULTURAL BIOLOGICALS MARKET, VALUE SHARE(%), BY CROP TYPE, 2022 - 2029
- Figure 84:
- ASIA-PACIFIC AGRICULTURAL BIOLOGICALS MARKET, BY FORM, VOLUME, GRAM, 2017 - 2029
- Figure 85:
- ASIA-PACIFIC AGRICULTURAL BIOLOGICALS MARKET, BY FORM, VALUE, USD, 2017 - 2029
- Figure 86:
- ASIA-PACIFIC AGRICULTURAL BIOLOGICALS MARKET, VALUE SHARE(%), BY CROP TYPE, 2022 - 2029
- Figure 87:
- ASIA-PACIFIC AGRICULTURAL BIOLOGICALS MARKET, BY FORM, VOLUME, METRIC TON, 2017 - 2029
- Figure 88:
- ASIA-PACIFIC AGRICULTURAL BIOLOGICALS MARKET, BY FORM, VALUE, USD, 2017 - 2029
- Figure 89:
- ASIA-PACIFIC AGRICULTURAL BIOLOGICALS MARKET, VOLUME SHARE(%), BY FORM, 2017 - 2029
- Figure 90:
- ASIA-PACIFIC AGRICULTURAL BIOLOGICALS MARKET, VALUE SHARE(%), BY FORM, 2017 - 2029
- Figure 91:
- ASIA-PACIFIC AGRICULTURAL BIOLOGICALS MARKET, BY FORM, VOLUME, METRIC TON, 2017 - 2029
- Figure 92:
- ASIA-PACIFIC AGRICULTURAL BIOLOGICALS MARKET, BY FORM, VALUE, USD, 2017 - 2029
- Figure 93:
- ASIA-PACIFIC AGRICULTURAL BIOLOGICALS MARKET, VALUE SHARE(%), BY CROP TYPE, 2022 - 2029
- Figure 94:
- ASIA-PACIFIC AGRICULTURAL BIOLOGICALS MARKET, BY FORM, VOLUME, METRIC TON, 2017 - 2029
- Figure 95:
- ASIA-PACIFIC AGRICULTURAL BIOLOGICALS MARKET, BY FORM, VALUE, USD, 2017 - 2029
- Figure 96:
- ASIA-PACIFIC AGRICULTURAL BIOLOGICALS MARKET, VALUE SHARE(%), BY CROP TYPE, 2022 - 2029
- Figure 97:
- ASIA-PACIFIC AGRICULTURAL BIOLOGICALS MARKET, BY FORM, VOLUME, METRIC TON, 2017 - 2029
- Figure 98:
- ASIA-PACIFIC AGRICULTURAL BIOLOGICALS MARKET, BY FORM, VALUE, USD, 2017 - 2029
- Figure 99:
- ASIA-PACIFIC AGRICULTURAL BIOLOGICALS MARKET, VALUE SHARE(%), BY CROP TYPE, 2022 - 2029
- Figure 100:
- ASIA-PACIFIC AGRICULTURAL BIOLOGICALS MARKET, BY FORM, VOLUME, METRIC TON, 2017 - 2029
- Figure 101:
- ASIA-PACIFIC AGRICULTURAL BIOLOGICALS MARKET, BY FORM, VALUE, USD, 2017 - 2029
- Figure 102:
- ASIA-PACIFIC AGRICULTURAL BIOLOGICALS MARKET, VALUE SHARE(%), BY CROP TYPE, 2022 - 2029
- Figure 103:
- ASIA-PACIFIC AGRICULTURAL BIOLOGICALS MARKET, BY CROP TYPE, VOLUME, METRIC TON, 2017 - 2029
- Figure 104:
- ASIA-PACIFIC AGRICULTURAL BIOLOGICALS MARKET, BY CROP TYPE, VALUE, USD, 2017 - 2029
- Figure 105:
- ASIA-PACIFIC AGRICULTURAL BIOLOGICALS MARKET, VOLUME SHARE(%), BY CROP TYPE, 2017 - 2029
- Figure 106:
- ASIA-PACIFIC AGRICULTURAL BIOLOGICALS MARKET, VALUE SHARE(%), BY CROP TYPE, 2017 - 2029
- Figure 107:
- ASIA-PACIFIC AGRICULTURAL BIOLOGICALS MARKET, BY CROP TYPE, VOLUME, METRIC TON, 2017 - 2029
- Figure 108:
- ASIA-PACIFIC AGRICULTURAL BIOLOGICALS MARKET, BY CROP TYPE, VALUE, USD, 2017 - 2029
- Figure 109:
- ASIA-PACIFIC AGRICULTURAL BIOLOGICALS MARKET, VALUE SHARE(%), BY FUNCTION, 2022 - 2029
- Figure 110:
- ASIA-PACIFIC AGRICULTURAL BIOLOGICALS MARKET, BY CROP TYPE, VOLUME, METRIC TON, 2017 - 2029
- Figure 111:
- ASIA-PACIFIC AGRICULTURAL BIOLOGICALS MARKET, BY CROP TYPE, VALUE, USD, 2017 - 2029
- Figure 112:
- ASIA-PACIFIC AGRICULTURAL BIOLOGICALS MARKET, VALUE SHARE(%), BY FUNCTION, 2022 - 2029
- Figure 113:
- ASIA-PACIFIC AGRICULTURAL BIOLOGICALS MARKET, BY CROP TYPE, VOLUME, METRIC TON, 2017 - 2029
- Figure 114:
- ASIA-PACIFIC AGRICULTURAL BIOLOGICALS MARKET, BY CROP TYPE, VALUE, USD, 2017 - 2029
- Figure 115:
- ASIA-PACIFIC AGRICULTURAL BIOLOGICALS MARKET, VALUE SHARE(%), BY FUNCTION, 2022 - 2029
- Figure 116:
- ASIA-PACIFIC AGRICULTURAL BIOLOGICALS MARKET, BY COUNTRY, VOLUME, METRIC TON, 2017 - 2029
- Figure 117:
- ASIA-PACIFIC AGRICULTURAL BIOLOGICALS MARKET, BY COUNTRY, VALUE, USD, 2017 - 2029
- Figure 118:
- ASIA-PACIFIC AGRICULTURAL BIOLOGICALS MARKET, VOLUME SHARE(%), BY COUNTRY, 2017 - 2029
- Figure 119:
- ASIA-PACIFIC AGRICULTURAL BIOLOGICALS MARKET, VALUE SHARE(%), BY COUNTRY, 2017 - 2029
- Figure 120:
- ASIA-PACIFIC AGRICULTURAL BIOLOGICALS MARKET, BY COUNTRY, VOLUME, METRIC TON, 2017 - 2029
- Figure 121:
- ASIA-PACIFIC AGRICULTURAL BIOLOGICALS MARKET, BY COUNTRY, VALUE, USD, 2017 - 2029
- Figure 122:
- ASIA-PACIFIC AGRICULTURAL BIOLOGICALS MARKET, VALUE SHARE(%), BY FUNCTION, 2022 - 2029
- Figure 123:
- ASIA-PACIFIC AGRICULTURAL BIOLOGICALS MARKET, BY COUNTRY, VOLUME, METRIC TON, 2017 - 2029
- Figure 124:
- ASIA-PACIFIC AGRICULTURAL BIOLOGICALS MARKET, BY COUNTRY, VALUE, USD, 2017 - 2029
- Figure 125:
- ASIA-PACIFIC AGRICULTURAL BIOLOGICALS MARKET, VALUE SHARE(%), BY FUNCTION, 2022 - 2029
- Figure 126:
- ASIA-PACIFIC AGRICULTURAL BIOLOGICALS MARKET, BY COUNTRY, VOLUME, METRIC TON, 2017 - 2029
- Figure 127:
- ASIA-PACIFIC AGRICULTURAL BIOLOGICALS MARKET, BY COUNTRY, VALUE, USD, 2017 - 2029
- Figure 128:
- ASIA-PACIFIC AGRICULTURAL BIOLOGICALS MARKET, VALUE SHARE(%), BY FUNCTION, 2022 - 2029
- Figure 129:
- ASIA-PACIFIC AGRICULTURAL BIOLOGICALS MARKET, BY COUNTRY, VOLUME, METRIC TON, 2017 - 2029
- Figure 130:
- ASIA-PACIFIC AGRICULTURAL BIOLOGICALS MARKET, BY COUNTRY, VALUE, USD, 2017 - 2029
- Figure 131:
- ASIA-PACIFIC AGRICULTURAL BIOLOGICALS MARKET, VALUE SHARE(%), BY FUNCTION, 2022 - 2029
- Figure 132:
- ASIA-PACIFIC AGRICULTURAL BIOLOGICALS MARKET, BY COUNTRY, VOLUME, METRIC TON, 2017 - 2029
- Figure 133:
- ASIA-PACIFIC AGRICULTURAL BIOLOGICALS MARKET, BY COUNTRY, VALUE, USD, 2017 - 2029
- Figure 134:
- ASIA-PACIFIC AGRICULTURAL BIOLOGICALS MARKET, VALUE SHARE(%), BY FUNCTION, 2022 - 2029
- Figure 135:
- ASIA-PACIFIC AGRICULTURAL BIOLOGICALS MARKET, BY COUNTRY, VOLUME, METRIC TON, 2017 - 2029
- Figure 136:
- ASIA-PACIFIC AGRICULTURAL BIOLOGICALS MARKET, BY COUNTRY, VALUE, USD, 2017 - 2029
- Figure 137:
- ASIA-PACIFIC AGRICULTURAL BIOLOGICALS MARKET, VALUE SHARE(%), BY FUNCTION, 2022 - 2029
- Figure 138:
- ASIA-PACIFIC AGRICULTURAL BIOLOGICALS MARKET, BY COUNTRY, VOLUME, METRIC TON, 2017 - 2029
- Figure 139:
- ASIA-PACIFIC AGRICULTURAL BIOLOGICALS MARKET, BY COUNTRY, VALUE, USD, 2017 - 2029
- Figure 140:
- ASIA-PACIFIC AGRICULTURAL BIOLOGICALS MARKET, VALUE SHARE(%), BY FUNCTION, 2022 - 2029
- Figure 141:
- ASIA-PACIFIC AGRICULTURAL BIOLOGICALS MARKET, BY COUNTRY, VOLUME, METRIC TON, 2017 - 2029
- Figure 142:
- ASIA-PACIFIC AGRICULTURAL BIOLOGICALS MARKET, BY COUNTRY, VALUE, USD, 2017 - 2029
- Figure 143:
- ASIA-PACIFIC AGRICULTURAL BIOLOGICALS MARKET, VALUE SHARE(%), BY FUNCTION, 2022 - 2029
- Figure 144:
- ASIA-PACIFIC AGRICULTURAL BIOLOGICALS MARKET, BY COUNTRY, VOLUME, METRIC TON, 2017 - 2029
- Figure 145:
- ASIA-PACIFIC AGRICULTURAL BIOLOGICALS MARKET, BY COUNTRY, VALUE, USD, 2017 - 2029
- Figure 146:
- ASIA-PACIFIC AGRICULTURAL BIOLOGICALS MARKET, VALUE SHARE(%), BY FUNCTION, 2022 - 2029
- Figure 147:
- ASIA-PACIFIC AGRICULTURAL BIOLOGICALS MARKET, MOST ACTIVE COMPANIES, BY NUMBER OF STRATEGIC MOVES, 2017-2022
- Figure 148:
- ASIA-PACIFIC AGRICULTURAL BIOLOGICALS MARKET, MOST ADOPTED STRATEGIES, 2017-2022
- Figure 149:
- ASIA-PACIFIC AGRICULTURAL BIOLOGICALS MARKET SHARE(%), BY MAJOR PLAYERS, 2022
Asia-Pacific Agricultural Biologicals Industry Segmentation
Crop Nutrition, Crop Protection are covered as segments by Function. Cash Crops, Horticultural Crops, Row Crops are covered as segments by Crop Type. Australia, China, India, Indonesia, Japan, Philippines, Thailand, Vietnam are covered as segments by Country.| Function | ||||||||||||||||||||||||
| ||||||||||||||||||||||||
|
| Crop Type | |
| Cash Crops | |
| Horticultural Crops | |
| Row Crops |
| Country | |
| Australia | |
| China | |
| India | |
| Indonesia | |
| Japan | |
| Philippines | |
| Thailand | |
| Vietnam | |
| Rest Of Asia-Pacific |
Market Definition
- AVERAGE DOSAGE RATE - This refers to the average volume of agricultural biologicals applied per hectare of farmland in the respective region/country.
- CROP TYPE - Row Crops: Cereals, Pulses, Oilseeds, and Forage Crops Horticulture: Fruits, and Vegetables, Cash Crops: Plantation Crops and Spices.
- FUNCTIONS - Crop Nutrition: Organic Fertilizer, Biofertilizer, Biostimulants. Crop Protection: Biopesticides, Biocontrol Agents
- MARKET ESTIMATION LEVEL - Market Estimations for various types of agricultural biologicals has been done at the product-level.
Research Methodology
Mordor Intelligence follows a four-step methodology in all our reports.
- Step-1: Identify Key Variables: In order to build a robust forecasting methodology, the variables and factors identified in Step-1 are tested against available historical market numbers. Through an iterative process, the variables required for market forecast are set and the model is built on the basis of these variables.
- Step-2: Build a Market Model: Market-size estimations for the forecast years are in nominal terms. Inflation is not a part of the pricing, and the average selling price (ASP) is kept constant throughout the forecast period.
- Step-3: Validate and Finalize: In this important step, all market numbers, variables and analyst calls are validated through an extensive network of primary research experts from the market studied. The respondents are selected across levels and functions to generate a holistic picture of the market studied.
- Step-4: Research Outputs: Syndicated Reports, Custom Consulting Assignments, Databases & Subscription Platforms.


