Asia-Pacific Biostimulants Market Size

| Icons | Lable | Value |
|---|---|---|
|
|
Study Period | 2017 - 2029 |
|
|
Base Year For Estimation | 2022 |
|
|
CAGR | 10.17 % |
|
|
Largest Share by Form | Amino Acids |
|
|
Largest Share by Country | China |
|
|
Market Concentration | High |
Major Players |
||
|
|
||
|
*Disclaimer: Major Players sorted in no particular order |
Asia-Pacific Biostimulants Market Analysis
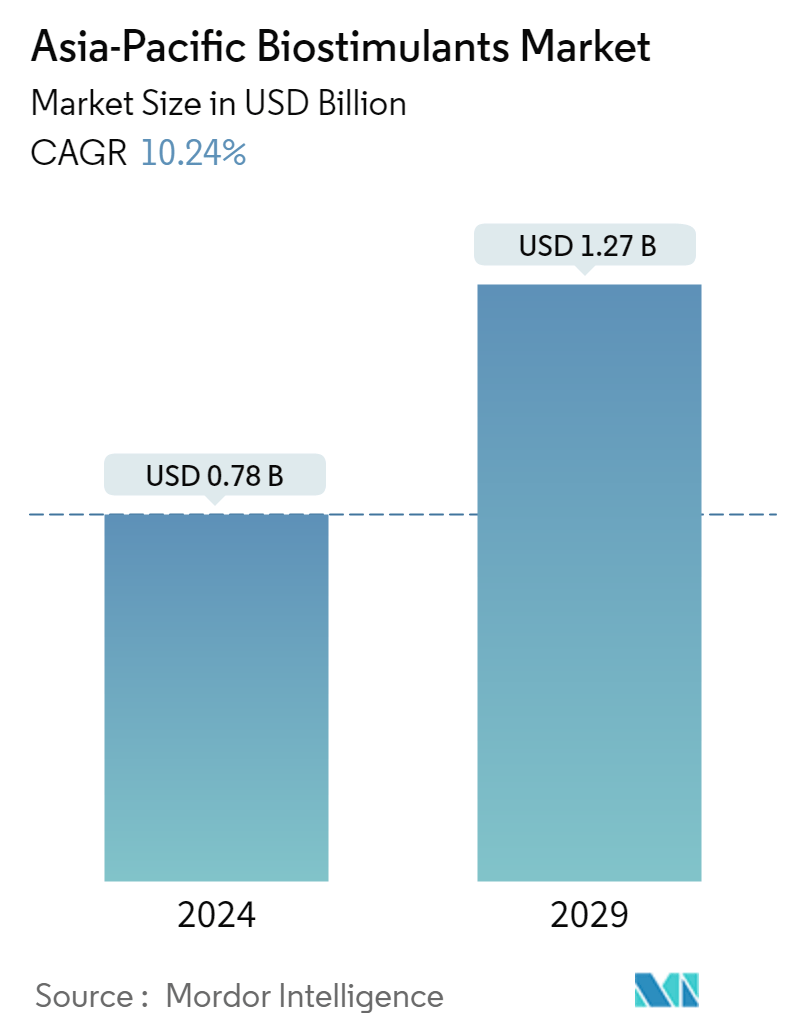
The Asia-Pacific Biostimulants Market is projected to register a CAGR of 10.17%
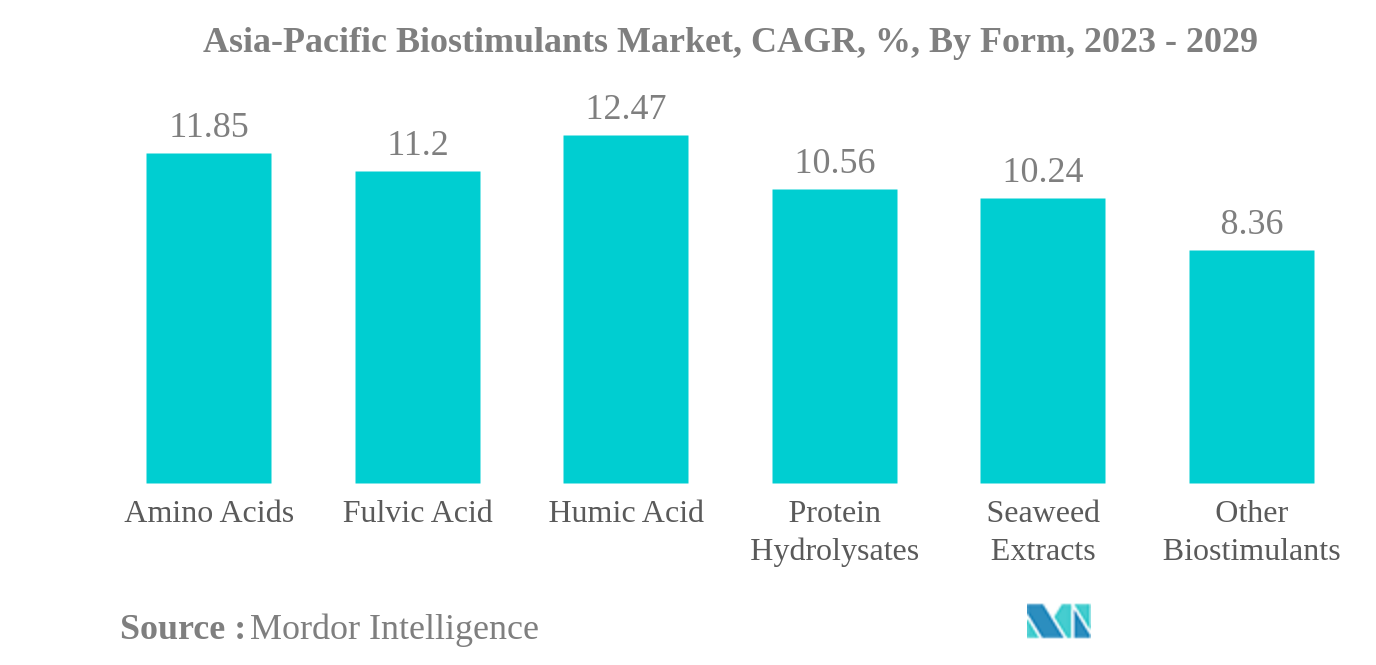
- Amino Acids is the Largest Form : Amino acids are the most used biostimulants in the region, because of their importance in enhancing plant productivity, especially under abiotic and biotic stress conditions.
- Humic Acid is the Fastest-growing Form : Humic acid biostimulants are component of humus and capable to bind insoluble metal ions, oxides, and hydroxides and to release them slowly to plants when required.
- Row Crops is the Largest Crop Type : The major row crops cultivated in the Asia-pacific Region include rice, wheat, canola, barley, corn, and soybeans. Amino acids are most consumed biostimulants in row crops.
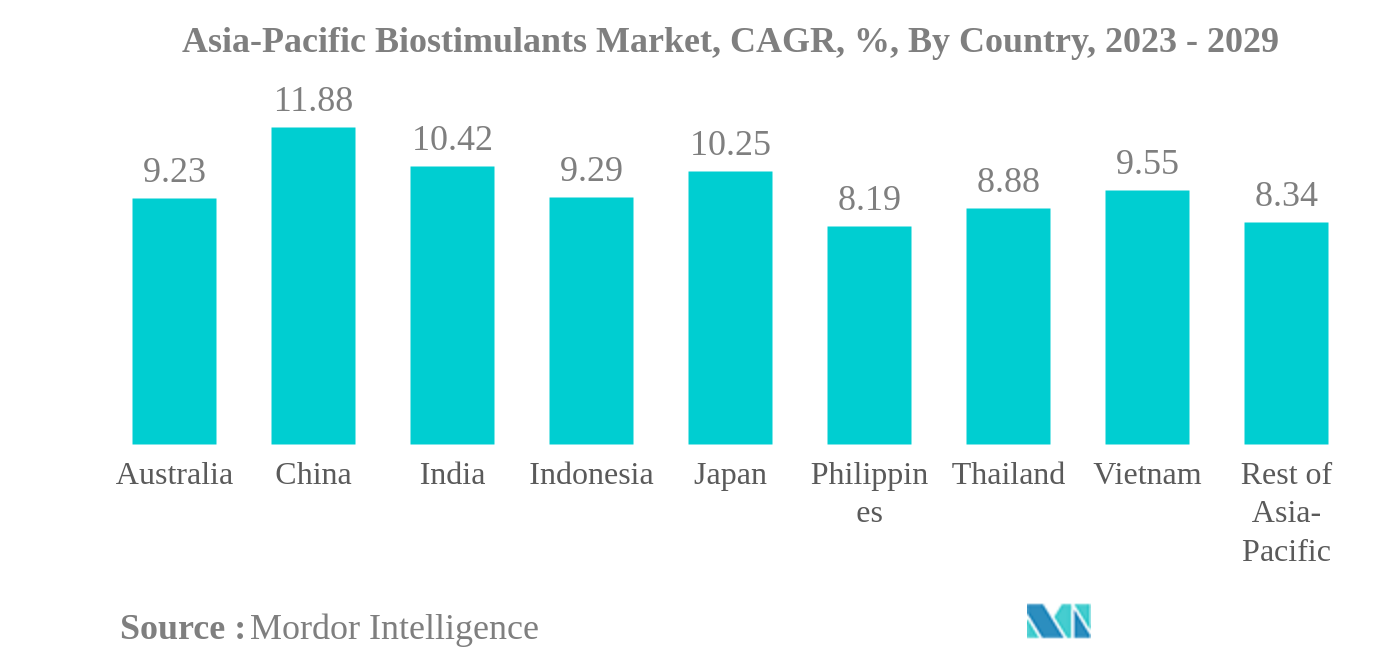
- China is the Largest Country : Humic acids are the most consumed biostimulants in the country with 25.3% in 2022, and row crops are dominating biostimulants market in the country with 82.3% in 2022.
Asia-Pacific Biostimulants Market Trends
This section covers the major market trends shaping the Asia-Pacific Biostimulants Market according to our research experts:
Amino Acids is the largest Form
- Modern agriculture plays a central role in solving some of humanity's most challenging problems. As the population in the Asia-Pacific region grows, the agricultural sector is under pressure to meet the rising demand for food and achieve food security goals.
- The deterioration of soil quality has become a major concern among farmers and agriculturists in the region. This has resulted in a loss of fertility, biodiversity, and production capacity. The agriculture sector's most significant challenge is the increasing use of synthetic fertilizers and pesticides to boost agricultural production. According to studies, excessive fertilizer use could hasten the climate crisis.
- As a result, environmentally friendly and sustainable farming practices with innovative solutions are now standard practices in modern agriculture. To ensure adequate food production, the agricultural sector must embrace new solutions and approaches to improve resource utilization efficiency. Biostimulants have emerged as an environmentally friendly and promising innovation for modern agriculture in this regard. Amino acids, humic acid, fulvic acid, seaweed extract, and protein hydrolysates are among the most commonly used biostimulants.
- Amino acids are the most commonly used biostimulants in the Asia-Pacific region, with the largest market share of 25.2% in 2022. This is due to their ability to enhance plant productivity, especially under abiotic and biotic stress conditions.
- Major agricultural countries in the region, such as India and China, have launched various initiatives to promote organic farming and the use of sustainable agricultural inputs. They offer various incentives that may drive the market, and as a result, the market value is anticipated to record a CAGR of 11.9% between 2023-2029.
China is the largest Country
- The Asia-Pacific region has witnessed a remarkable increase in the demand for organically grown food, resulting in a surge in the biostimulants market. With countries like India, China, Australia, and Japan promoting organic farming, the area under organic cultivation increased from 3.1 million hectares in 2017 to 3.8 million hectares in 2022. As a result, the biostimulants market experienced a growth rate of 11.5% between 2017-2022.
- The impact of climate change has severely affected crop production, making it imperative to use biostimulants to mitigate climate-induced stresses like drought, salinity, and temperature variations. The application of biostimulants has proven to have a positive impact on plants and helps maintain the ecological balance of agroecosystems, reducing the need for pesticides and chemical fertilizers.
- China, India, and Australia have emerged as the major business areas for biostimulants in the Asia-Pacific region. In 2022, China dominated the biostimulants market with a 27.6% share, followed by India and Australia. The governments of these countries are encouraging farmers to adopt sustainable agricultural practices by providing incentives, investing in research and development, and setting targets to meet. For instance, Japan has set a goal to reduce the usage of chemical fertilizers and pesticides by 30.0% and 50.0%, respectively, by 2050.
- The demand for biostimulants in the Asia-Pacific region is on the rise due to the increasing area under organic farming and the need for sustainable agricultural practices. The biostimulants market in the Asia-Pacific region is expected to witness further growth in the coming years, with the potential to help combat the adverse effects of climate change on agriculture.
Asia-Pacific Biostimulants Industry Overview
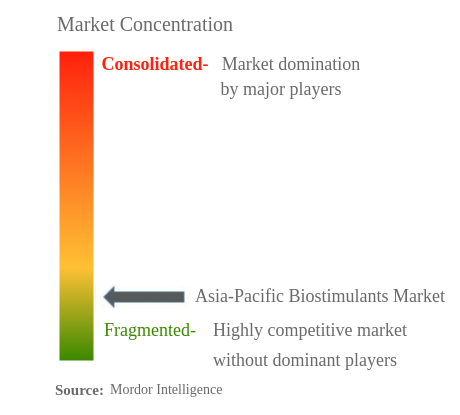
The Asia-Pacific Biostimulants Market is fragmented, with the top five companies occupying 8.79%. The major players in this market are Biolchim SpA, Biostadt India Limited, Gujarat State Fertilizers & Chemicals Ltd., T. Stanes and Company Limited and Valagro (sorted alphabetically).
Asia-Pacific Biostimulants Market Leaders
Biolchim SpA
Biostadt India Limited
Gujarat State Fertilizers & Chemicals Ltd.
T. Stanes and Company Limited
Valagro
*Disclaimer: Major Players sorted in no particular order
Asia-Pacific Biostimulants Market News
- February 2022: Gujarat State Fertilizers & Chemicals Ltd launched the Urban Sardar organic fertilizer, an eco-friendly and non-toxic product containing organic sources of nutrients best suitable for all flowering plants and ornamental plants, gardens, and kitchen gardening.
- February 2022: Plant Response was acquired by The Mosaic Company, which is a global fertilizer manufacturer. This acquisition strengthens the company's global presence and helps develop new products and solutions for the customers sustainably.
- January 2021: Atlántica Agrícola developed Micomix, a biostimulant composed primarily of mycorrhizal fungi, rhizobacteria, and chelated micronutrients. The presence and development of these microorganisms in the rhizosphere create a symbiotic relationship with the plant that favors the absorption of water and mineral nutrients and increases its tolerance to water and salt stress.
Asia-Pacific Biostimulants Market Report - Table of Contents
EXECUTIVE SUMMARY & KEY FINDINGS
REPORT OFFERS
1. INTRODUCTION
1.1. Study Assumptions & Market Definition
1.2. Scope of the Study
1.3. Research Methodology
2. KEY INDUSTRY TRENDS
2.1. Area Under Organic Cultivation
2.2. Per Capita Spending On Organic Products
2.3. Regulatory Framework
2.4. Value Chain & Distribution Channel Analysis
3. MARKET SEGMENTATION
3.1. Form
3.1.1. Amino Acids
3.1.2. Fulvic Acid
3.1.3. Humic Acid
3.1.4. Protein Hydrolysates
3.1.5. Seaweed Extracts
3.1.6. Other Biostimulants
3.2. Crop Type
3.2.1. Cash Crops
3.2.2. Horticultural Crops
3.2.3. Row Crops
3.3. Country
3.3.1. Australia
3.3.2. China
3.3.3. India
3.3.4. Indonesia
3.3.5. Japan
3.3.6. Philippines
3.3.7. Thailand
3.3.8. Vietnam
3.3.9. Rest Of Asia-Pacific
4. COMPETITIVE LANDSCAPE
4.1. Key Strategic Moves
4.2. Market Share Analysis
4.3. Company Landscape
4.4. Company Profiles
4.4.1. Agrinos
4.4.2. Atlántica Agrícola
4.4.3. Biolchim SpA
4.4.4. Biostadt India Limited
4.4.5. Coromandel International Ltd
4.4.6. Gujarat State Fertilizers & Chemicals Ltd.
4.4.7. Plant Response Biotech Inc.
4.4.8. Rallis India Ltd
4.4.9. T. Stanes and Company Limited
4.4.10. Valagro
5. KEY STRATEGIC QUESTIONS FOR AGRICULTURAL BIOLOGICALS CEOS
6. APPENDIX
6.1. Global Overview
6.1.1. Overview
6.1.2. Porter’s Five Forces Framework
6.1.3. Global Value Chain Analysis
6.1.4. Market Dynamics (DROs)
6.2. Sources & References
6.3. List of Tables & Figures
6.4. Primary Insights
6.5. Data Pack
6.6. Glossary of Terms
List of Tables & Figures
- Figure 1:
- ASIA-PACIFIC BIOSTIMULANTS MARKET, AREA UNDER ORGANIC CULTIVATION, HECTARES, 2017 - 2022
- Figure 2:
- ASIA-PACIFIC BIOSTIMULANTS MARKET, PER CAPITA SPENDING ON ORGANIC PRODUCTS, USD, 2017 - 2022
- Figure 3:
- ASIA-PACIFIC BIOSTIMULANTS MARKET, VOLUME, METRIC TON, 2017 - 2029
- Figure 4:
- ASIA-PACIFIC BIOSTIMULANTS MARKET, VALUE, USD, 2017 - 2029
- Figure 5:
- ASIA-PACIFIC BIOSTIMULANTS MARKET, BY FORM, VOLUME, METRIC TON, 2017 - 2029
- Figure 6:
- ASIA-PACIFIC BIOSTIMULANTS MARKET, BY FORM, VALUE, USD, 2017 - 2029
- Figure 7:
- ASIA-PACIFIC BIOSTIMULANTS MARKET, VOLUME SHARE(%), BY FORM, 2017 - 2029
- Figure 8:
- ASIA-PACIFIC BIOSTIMULANTS MARKET, VALUE SHARE(%), BY FORM, 2017 - 2029
- Figure 9:
- ASIA-PACIFIC BIOSTIMULANTS MARKET, BY FORM, VOLUME, METRIC TON, 2017 - 2029
- Figure 10:
- ASIA-PACIFIC BIOSTIMULANTS MARKET, BY FORM, VALUE, USD, 2017 - 2029
- Figure 11:
- ASIA-PACIFIC BIOSTIMULANTS MARKET, VALUE SHARE(%), BY CROP TYPE, 2022 - 2029
- Figure 12:
- ASIA-PACIFIC BIOSTIMULANTS MARKET, BY FORM, VOLUME, METRIC TON, 2017 - 2029
- Figure 13:
- ASIA-PACIFIC BIOSTIMULANTS MARKET, BY FORM, VALUE, USD, 2017 - 2029
- Figure 14:
- ASIA-PACIFIC BIOSTIMULANTS MARKET, VALUE SHARE(%), BY CROP TYPE, 2022 - 2029
- Figure 15:
- ASIA-PACIFIC BIOSTIMULANTS MARKET, BY FORM, VOLUME, METRIC TON, 2017 - 2029
- Figure 16:
- ASIA-PACIFIC BIOSTIMULANTS MARKET, BY FORM, VALUE, USD, 2017 - 2029
- Figure 17:
- ASIA-PACIFIC BIOSTIMULANTS MARKET, VALUE SHARE(%), BY CROP TYPE, 2022 - 2029
- Figure 18:
- ASIA-PACIFIC BIOSTIMULANTS MARKET, BY FORM, VOLUME, METRIC TON, 2017 - 2029
- Figure 19:
- ASIA-PACIFIC BIOSTIMULANTS MARKET, BY FORM, VALUE, USD, 2017 - 2029
- Figure 20:
- ASIA-PACIFIC BIOSTIMULANTS MARKET, VALUE SHARE(%), BY CROP TYPE, 2022 - 2029
- Figure 21:
- ASIA-PACIFIC BIOSTIMULANTS MARKET, BY FORM, VOLUME, METRIC TON, 2017 - 2029
- Figure 22:
- ASIA-PACIFIC BIOSTIMULANTS MARKET, BY FORM, VALUE, USD, 2017 - 2029
- Figure 23:
- ASIA-PACIFIC BIOSTIMULANTS MARKET, VALUE SHARE(%), BY CROP TYPE, 2022 - 2029
- Figure 24:
- ASIA-PACIFIC BIOSTIMULANTS MARKET, BY FORM, VOLUME, METRIC TON, 2017 - 2029
- Figure 25:
- ASIA-PACIFIC BIOSTIMULANTS MARKET, BY FORM, VALUE, USD, 2017 - 2029
- Figure 26:
- ASIA-PACIFIC BIOSTIMULANTS MARKET, VALUE SHARE(%), BY CROP TYPE, 2022 - 2029
- Figure 27:
- ASIA-PACIFIC BIOSTIMULANTS MARKET, BY CROP TYPE, VOLUME, METRIC TON, 2017 - 2029
- Figure 28:
- ASIA-PACIFIC BIOSTIMULANTS MARKET, BY CROP TYPE, VALUE, USD, 2017 - 2029
- Figure 29:
- ASIA-PACIFIC BIOSTIMULANTS MARKET, VOLUME SHARE(%), BY CROP TYPE, 2017 - 2029
- Figure 30:
- ASIA-PACIFIC BIOSTIMULANTS MARKET, VALUE SHARE(%), BY CROP TYPE, 2017 - 2029
- Figure 31:
- ASIA-PACIFIC BIOSTIMULANTS MARKET, BY CROP TYPE, VOLUME, METRIC TON, 2017 - 2029
- Figure 32:
- ASIA-PACIFIC BIOSTIMULANTS MARKET, BY CROP TYPE, VALUE, USD, 2017 - 2029
- Figure 33:
- ASIA-PACIFIC BIOSTIMULANTS MARKET, VALUE SHARE(%), BY FORM, 2022 - 2029
- Figure 34:
- ASIA-PACIFIC BIOSTIMULANTS MARKET, BY CROP TYPE, VOLUME, METRIC TON, 2017 - 2029
- Figure 35:
- ASIA-PACIFIC BIOSTIMULANTS MARKET, BY CROP TYPE, VALUE, USD, 2017 - 2029
- Figure 36:
- ASIA-PACIFIC BIOSTIMULANTS MARKET, VALUE SHARE(%), BY FORM, 2022 - 2029
- Figure 37:
- ASIA-PACIFIC BIOSTIMULANTS MARKET, BY CROP TYPE, VOLUME, METRIC TON, 2017 - 2029
- Figure 38:
- ASIA-PACIFIC BIOSTIMULANTS MARKET, BY CROP TYPE, VALUE, USD, 2017 - 2029
- Figure 39:
- ASIA-PACIFIC BIOSTIMULANTS MARKET, VALUE SHARE(%), BY FORM, 2022 - 2029
- Figure 40:
- ASIA-PACIFIC BIOSTIMULANTS MARKET, BY COUNTRY, VOLUME, METRIC TON, 2017 - 2029
- Figure 41:
- ASIA-PACIFIC BIOSTIMULANTS MARKET, BY COUNTRY, VALUE, USD, 2017 - 2029
- Figure 42:
- ASIA-PACIFIC BIOSTIMULANTS MARKET, VOLUME SHARE(%), BY COUNTRY, 2017 - 2029
- Figure 43:
- ASIA-PACIFIC BIOSTIMULANTS MARKET, VALUE SHARE(%), BY COUNTRY, 2017 - 2029
- Figure 44:
- ASIA-PACIFIC BIOSTIMULANTS MARKET, BY COUNTRY, VOLUME, METRIC TON, 2017 - 2029
- Figure 45:
- ASIA-PACIFIC BIOSTIMULANTS MARKET, BY COUNTRY, VALUE, USD, 2017 - 2029
- Figure 46:
- ASIA-PACIFIC BIOSTIMULANTS MARKET, VALUE SHARE(%), BY FORM, 2022 - 2029
- Figure 47:
- ASIA-PACIFIC BIOSTIMULANTS MARKET, BY COUNTRY, VOLUME, METRIC TON, 2017 - 2029
- Figure 48:
- ASIA-PACIFIC BIOSTIMULANTS MARKET, BY COUNTRY, VALUE, USD, 2017 - 2029
- Figure 49:
- ASIA-PACIFIC BIOSTIMULANTS MARKET, VALUE SHARE(%), BY FORM, 2022 - 2029
- Figure 50:
- ASIA-PACIFIC BIOSTIMULANTS MARKET, BY COUNTRY, VOLUME, METRIC TON, 2017 - 2029
- Figure 51:
- ASIA-PACIFIC BIOSTIMULANTS MARKET, BY COUNTRY, VALUE, USD, 2017 - 2029
- Figure 52:
- ASIA-PACIFIC BIOSTIMULANTS MARKET, VALUE SHARE(%), BY FORM, 2022 - 2029
- Figure 53:
- ASIA-PACIFIC BIOSTIMULANTS MARKET, BY COUNTRY, VOLUME, METRIC TON, 2017 - 2029
- Figure 54:
- ASIA-PACIFIC BIOSTIMULANTS MARKET, BY COUNTRY, VALUE, USD, 2017 - 2029
- Figure 55:
- ASIA-PACIFIC BIOSTIMULANTS MARKET, VALUE SHARE(%), BY FORM, 2022 - 2029
- Figure 56:
- ASIA-PACIFIC BIOSTIMULANTS MARKET, BY COUNTRY, VOLUME, METRIC TON, 2017 - 2029
- Figure 57:
- ASIA-PACIFIC BIOSTIMULANTS MARKET, BY COUNTRY, VALUE, USD, 2017 - 2029
- Figure 58:
- ASIA-PACIFIC BIOSTIMULANTS MARKET, VALUE SHARE(%), BY FORM, 2022 - 2029
- Figure 59:
- ASIA-PACIFIC BIOSTIMULANTS MARKET, BY COUNTRY, VOLUME, METRIC TON, 2017 - 2029
- Figure 60:
- ASIA-PACIFIC BIOSTIMULANTS MARKET, BY COUNTRY, VALUE, USD, 2017 - 2029
- Figure 61:
- ASIA-PACIFIC BIOSTIMULANTS MARKET, VALUE SHARE(%), BY FORM, 2022 - 2029
- Figure 62:
- ASIA-PACIFIC BIOSTIMULANTS MARKET, BY COUNTRY, VOLUME, METRIC TON, 2017 - 2029
- Figure 63:
- ASIA-PACIFIC BIOSTIMULANTS MARKET, BY COUNTRY, VALUE, USD, 2017 - 2029
- Figure 64:
- ASIA-PACIFIC BIOSTIMULANTS MARKET, VALUE SHARE(%), BY FORM, 2022 - 2029
- Figure 65:
- ASIA-PACIFIC BIOSTIMULANTS MARKET, BY COUNTRY, VOLUME, METRIC TON, 2017 - 2029
- Figure 66:
- ASIA-PACIFIC BIOSTIMULANTS MARKET, BY COUNTRY, VALUE, USD, 2017 - 2029
- Figure 67:
- ASIA-PACIFIC BIOSTIMULANTS MARKET, VALUE SHARE(%), BY FORM, 2022 - 2029
- Figure 68:
- ASIA-PACIFIC BIOSTIMULANTS MARKET, BY COUNTRY, VOLUME, METRIC TON, 2017 - 2029
- Figure 69:
- ASIA-PACIFIC BIOSTIMULANTS MARKET, BY COUNTRY, VALUE, USD, 2017 - 2029
- Figure 70:
- ASIA-PACIFIC BIOSTIMULANTS MARKET, VALUE SHARE(%), BY FORM, 2022 - 2029
- Figure 71:
- ASIA-PACIFIC BIOSTIMULANTS MARKET, MOST ACTIVE COMPANIES, BY NUMBER OF STRATEGIC MOVES, 2017-2022
- Figure 72:
- ASIA-PACIFIC BIOSTIMULANTS MARKET, MOST ADOPTED STRATEGIES, 2017-2022
- Figure 73:
- ASIA-PACIFIC BIOSTIMULANTS MARKET SHARE(%), BY MAJOR PLAYERS, 2022
Asia-Pacific Biostimulants Industry Segmentation
Amino Acids, Fulvic Acid, Humic Acid, Protein Hydrolysates, Seaweed Extracts are covered as segments by Form. Cash Crops, Horticultural Crops, Row Crops are covered as segments by Crop Type. Australia, China, India, Indonesia, Japan, Philippines, Thailand, Vietnam are covered as segments by Country.| Form | |
| Amino Acids | |
| Fulvic Acid | |
| Humic Acid | |
| Protein Hydrolysates | |
| Seaweed Extracts | |
| Other Biostimulants |
| Crop Type | |
| Cash Crops | |
| Horticultural Crops | |
| Row Crops |
| Country | |
| Australia | |
| China | |
| India | |
| Indonesia | |
| Japan | |
| Philippines | |
| Thailand | |
| Vietnam | |
| Rest Of Asia-Pacific |
Market Definition
- AVERAGE DOSAGE RATE - This refers to the average volume of biostimulants applied per hectare of farmland in the respective region/country.
- CROP TYPE - Row Crops: Cereals, Pulses, Oilseeds, and Forage Crops Horticulture: Fruits, and Vegetables, Cash Crops: Plantation Crops and Spices.
- FUNCTIONS - Biostimulants
- MARKET ESTIMATION LEVEL - Market Estimations for various types of biostimulants has been done at the product-level.
Research Methodology
Mordor Intelligence follows a four-step methodology in all our reports.
- Step-1: Identify Key Variables: In order to build a robust forecasting methodology, the variables and factors identified in Step-1 are tested against available historical market numbers. Through an iterative process, the variables required for market forecast are set and the model is built on the basis of these variables.
- Step-2: Build a Market Model: Market-size estimations for the forecast years are in nominal terms. Inflation is not a part of the pricing, and the average selling price (ASP) is kept constant throughout the forecast period.
- Step-3: Validate and Finalize: In this important step, all market numbers, variables and analyst calls are validated through an extensive network of primary research experts from the market studied. The respondents are selected across levels and functions to generate a holistic picture of the market studied.
- Step-4: Research Outputs: Syndicated Reports, Custom Consulting Assignments, Databases & Subscription Platforms.


