Asia-Pacific Business Jet Market Size

| Icons | Lable | Value |
|---|---|---|
|
|
Study Period | 2016 - 2028 |
|
|
Market Size (2023) | USD 1.67 Billion |
|
|
Market Size (2028) | USD 4.14 Billion |
|
|
CAGR (2023 - 2028) | 19.91 % |
|
|
Largest Share by Body Type | Large Jet |
|
|
Largest Share by Country | China |
Major Players |
||
|
|
||
|
*Disclaimer: Major Players sorted in no particular order |
Asia-Pacific Business Jet Market Analysis
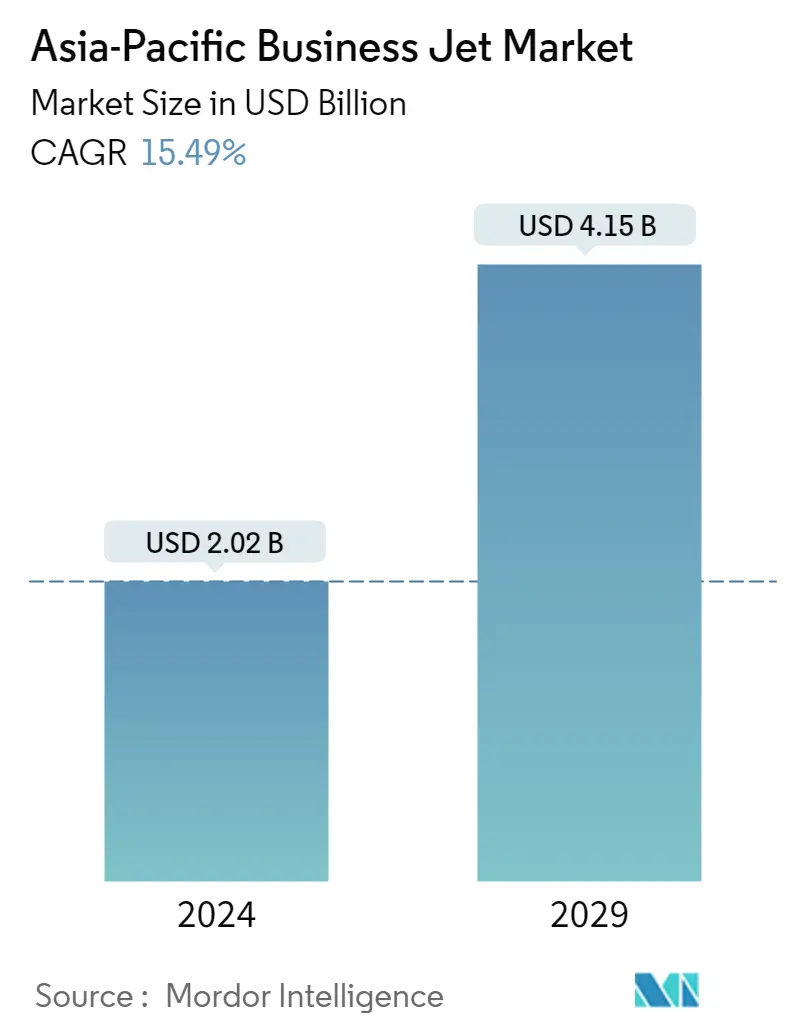
The Asia-Pacific Business Jet Market size is expected to grow from USD 1.67 billion in 2023 to USD 4.14 billion by 2028, at a CAGR of 19.91% during the forecast period (2023-2028).
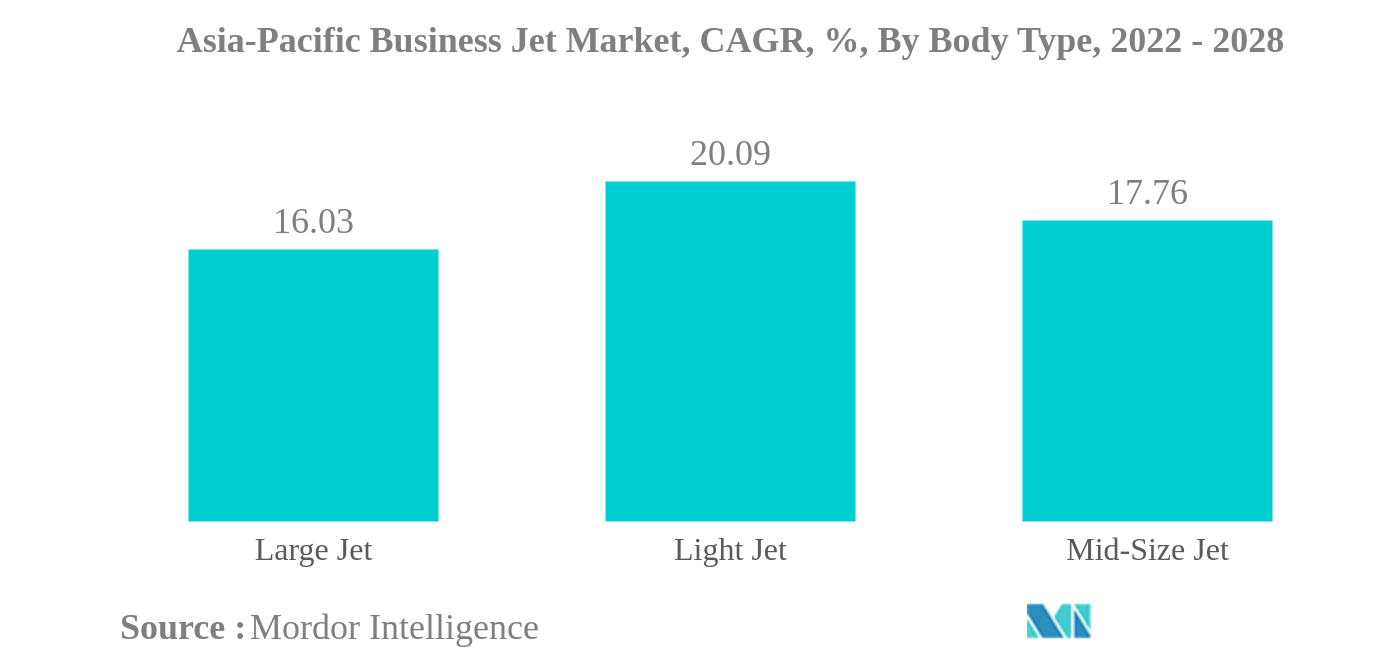
- Largest Market by Body Type - Large Jet : The increasing popularity of large jets because of their comfort, convenience, and ability to travel long distances is projected to drive the demand for large jets in the region.
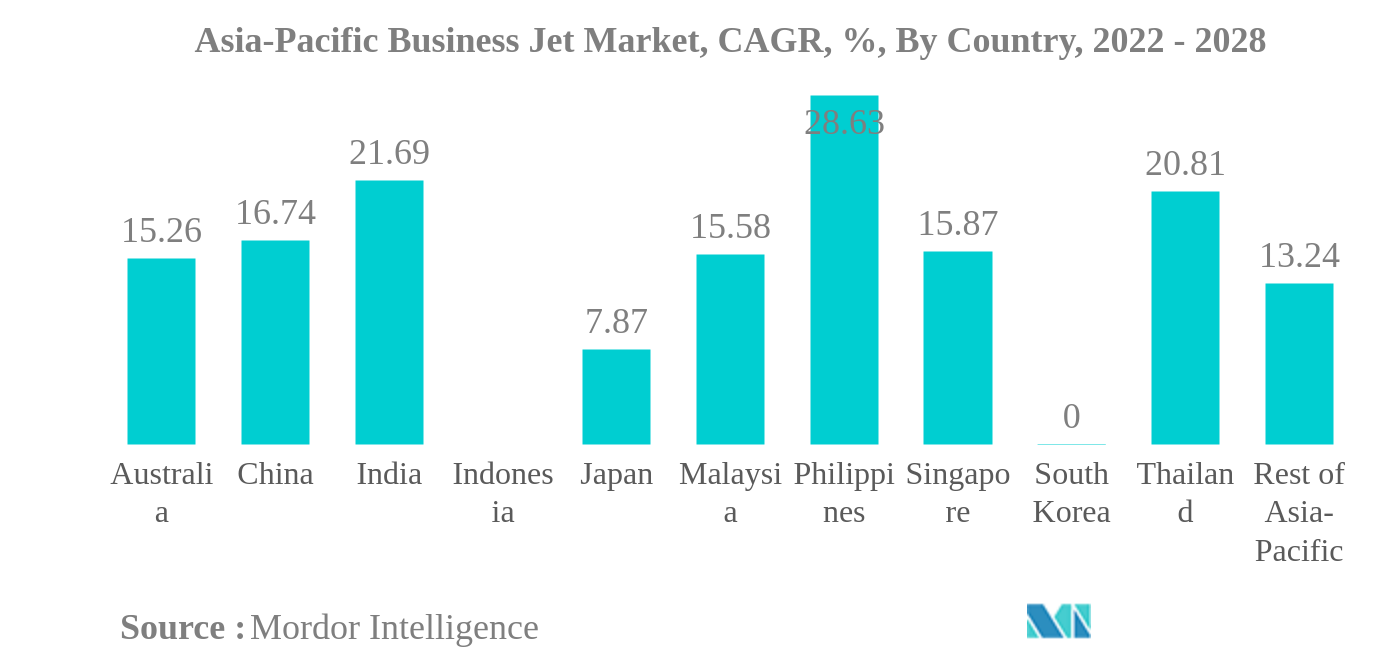
- Largest Market by Country - China : As the country's economy is recovering, companies and wealthy individuals in China have sharply increased their use of private jets, thereby prompting an upward shift in business travel.
Asia-Pacific Business Jet Market Trends
This section covers the major market trends shaping the Asia-Pacific Business Jet Market according to our research experts:
Large Jet is the largest Body Type
- Business jets are private jets designed to carry small groups of people. They can be used for various other roles as well. As of July 2022, business jets in Asia-Pacific accounted for 6% of the active global fleet. Out of these, the large jet segment accounted for a major market share of 52%, followed by 22% for light jets and 17% for mid-size jets.
- The large jet segment dominates as a large portion of business jets fall into the category of charter, private, or corporate use. The UHNWIs are the major users who value these jets primarily due to their range, technology, cabin size, and efficiency. Some of the most delivered jets are Gulfstream G500/550/650/650ER, Global 6000/7500 Express, Challenger 604/605/650, and Dassault Aviation SA's Falcon series.
- During the study period, Cessna (a subsidiary of Textron Inc.) was the major OEM in terms of deliveries in the light jet segment, with 21 jets. Bombardier was the major OEM in the mid-size segment with six jets, followed and Gulfstream Aerospace Corporation, a wholly-owned subsidiary of General Dynamics, with six jets. Gulfstream Aerospace Corporation is a major OEM in the large jet segment, with 97 jets, followed by Bombardier with 45 jets.
- Gulfstream Aerospace Corporation, Bombardier, and Cessna dominate the business jet market, together accounting for 64% of the total new business jet deliveries between 2016 and 2021. Out of the total operational business jets in Asia-Pacific, 98% are wholly owned, while the remaining are shared and fractional ownership.
China is the largest Country
- The overall deliveries for new business jets in Asia-Pacific declined during 2016-19. They further declined in 2020 due to the COVID-19 pandemic. During the pandemic, the reduction in economic activities in the region, along with travel-related restrictions, affected the demand for and utilization of business jets. However, post-pandemic, strong recovery in the economy and the removal of travel restrictions fueled the demand for private jets, especially in Southeast Asia. There is a surge of foreign investments, especially in Singapore, Thailand, Cambodia, and Malaysia, which is resulting in higher demand for private charters. Due to the large customer base, business jet OEMs are largely targeting this region and are expecting high demand for new business jets over the next decade.
- The HNWIs and UHNWIs prefer private jets for personal or business travel, and the rise in the number of HNWI individuals in the Asia-Pacific region aided in the procurement of new business jets. From 2016 to 2021, the HNWI population in the region increased by 117%.
- In terms of the current operational fleet of 1,240 jets in Asia-Pacific, China accounts for 21%, followed by Australia, India, and Japan, with around 18%, 13%, and 9%, respectively. Bombardier, Textron, and Gulfstream together account for 66% of the current operational business jet fleet in the region. In 2021, China, Australia, and Japan were the major countries in terms of new business jet deliveries.
- Over 460 new business jets are expected to be delivered in the region during 2022-2028. The economic recovery in the developing economies in the region, such as China and Southeast Asia, is expected to boost the growth of the business jet market in the region during the forecast period.
Asia-Pacific Business Jet Industry Overview
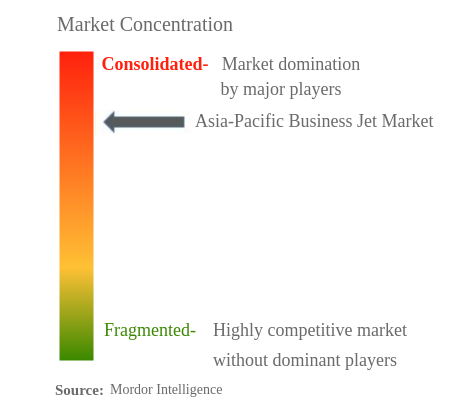
The Asia-Pacific Business Jet Market is fairly consolidated, with the top five companies occupying 98.87%. The major players in this market are Bombardier Inc., Cirrus Design Corporation, Dassault Aviation, General Dynamics Corporation and Textron Inc. (sorted alphabetically).
Asia-Pacific Business Jet Market Leaders
Bombardier Inc.
Cirrus Design Corporation
Dassault Aviation
General Dynamics Corporation
Textron Inc.
*Disclaimer: Major Players sorted in no particular order
Asia-Pacific Business Jet Market News
- May 2022: Bombardier unveiled the aircraft Global 8000.
- October 2021: Gulfstream Aerospace announced the expansion of its existing business jet portfolio with the launch of the Gulfstream G800 and the Gulfstream G400 aircraft.
- September 2021: Bombardier officially placed an order for 20 Challenger 3500 business jets.
Asia-Pacific Business Jet Market Report - Table of Contents
1. INTRODUCTION
1.1. Study Assumptions & Market Definition
1.2. Scope of the Study
1.3. Research Methodology
2. KEY INDUSTRY TRENDS
2.1. High-Net-Worth Individual (HNWI)
2.2. Regulatory Framework
2.3. Value Chain Analysis
3. MARKET SEGMENTATION
3.1. Body Type
3.1.1. Large Jet
3.1.2. Light Jet
3.1.3. Mid-Size Jet
3.2. Country
3.2.1. Australia
3.2.2. China
3.2.3. India
3.2.4. Indonesia
3.2.5. Japan
3.2.6. Malaysia
3.2.7. Philippines
3.2.8. Singapore
3.2.9. South Korea
3.2.10. Thailand
3.2.11. Rest Of Asia-Pacific
4. COMPETITIVE LANDSCAPE
4.1. Key Strategic Moves
4.2. Market Share Analysis
4.3. Company Landscape
4.4. Company Profiles
4.4.1. Airbus SE
4.4.2. Bombardier Inc.
4.4.3. Cirrus Design Corporation
4.4.4. Dassault Aviation
4.4.5. General Dynamics Corporation
4.4.6. Honda Motor Co., Ltd.
4.4.7. Textron Inc.
4.4.8. The Boeing Company
4.4.9. United Aircraft Corporation
5. KEY STRATEGIC QUESTIONS FOR AVIATION CEOS
6. APPENDIX
6.1. Global Overview
6.1.1. Overview
6.1.2. Porter’s Five Forces Framework
6.1.3. Global Value Chain Analysis
6.1.4. Market Dynamics (DROs)
6.2. Sources & References
6.3. List of Tables & Figures
6.4. Primary Insights
6.5. Data Pack
6.6. Glossary of Terms
List of Tables & Figures
- Figure 1:
- ASIA-PACIFIC BUSINESS JET MARKET, HIGH-NET-WORTH INDIVIDUAL (HNWI), POPULATION, 2016 – 2028
- Figure 2:
- ASIA-PACIFIC BUSINESS JET MARKET, VOLUME, UNITS, 2016 - 2028
- Figure 3:
- ASIA-PACIFIC BUSINESS JET MARKET, VALUE, USD, 2016 - 2028
- Figure 4:
- ASIA-PACIFIC BUSINESS JET MARKET, BY BODY TYPE, VOLUME, UNITS, 2016 - 2028
- Figure 5:
- ASIA-PACIFIC BUSINESS JET MARKET, BY BODY TYPE, VALUE, USD, 2016 - 2028
- Figure 6:
- ASIA-PACIFIC BUSINESS JET MARKET, BY BODY TYPE, VOLUME, %, 2016 VS 2022 VS 2028
- Figure 7:
- ASIA-PACIFIC BUSINESS JET MARKET, BY BODY TYPE, VALUE, %, 2016 VS 2022 VS 2028
- Figure 8:
- ASIA-PACIFIC BUSINESS JET MARKET, BY LARGE JET, VOLUME, UNITS, 2016 - 2028
- Figure 9:
- ASIA-PACIFIC BUSINESS JET MARKET, BY LARGE JET, VALUE, USD, 2016 - 2028
- Figure 10:
- ASIA-PACIFIC BUSINESS JET MARKET, BY LARGE JET, VALUE, %, 2021 VS 2028
- Figure 11:
- ASIA-PACIFIC BUSINESS JET MARKET, BY LIGHT JET, VOLUME, UNITS, 2016 - 2028
- Figure 12:
- ASIA-PACIFIC BUSINESS JET MARKET, BY LIGHT JET, VALUE, USD, 2016 - 2028
- Figure 13:
- ASIA-PACIFIC BUSINESS JET MARKET, BY LIGHT JET, VALUE, %, 2021 VS 2028
- Figure 14:
- ASIA-PACIFIC BUSINESS JET MARKET, BY MID-SIZE JET, VOLUME, UNITS, 2016 - 2028
- Figure 15:
- ASIA-PACIFIC BUSINESS JET MARKET, BY MID-SIZE JET, VALUE, USD, 2016 - 2028
- Figure 16:
- ASIA-PACIFIC BUSINESS JET MARKET, BY MID-SIZE JET, VALUE, %, 2021 VS 2028
- Figure 17:
- ASIA-PACIFIC BUSINESS JET MARKET, BY COUNTRY, VOLUME, UNITS, 2016 - 2028
- Figure 18:
- ASIA-PACIFIC BUSINESS JET MARKET, BY COUNTRY, VALUE, USD, 2016 - 2028
- Figure 19:
- ASIA-PACIFIC BUSINESS JET MARKET, BY COUNTRY, VOLUME, %, 2016 VS 2022 VS 2028
- Figure 20:
- ASIA-PACIFIC BUSINESS JET MARKET, BY COUNTRY, VALUE, %, 2016 VS 2022 VS 2028
- Figure 21:
- ASIA-PACIFIC BUSINESS JET MARKET, BY AUSTRALIA, VOLUME, UNITS, 2016 - 2028
- Figure 22:
- ASIA-PACIFIC BUSINESS JET MARKET, BY AUSTRALIA, VALUE, USD, 2016 - 2028
- Figure 23:
- ASIA-PACIFIC BUSINESS JET MARKET, BY AUSTRALIA, VALUE, %, 2021 VS 2028
- Figure 24:
- ASIA-PACIFIC BUSINESS JET MARKET, BY CHINA, VOLUME, UNITS, 2016 - 2028
- Figure 25:
- ASIA-PACIFIC BUSINESS JET MARKET, BY CHINA, VALUE, USD, 2016 - 2028
- Figure 26:
- ASIA-PACIFIC BUSINESS JET MARKET, BY CHINA, VALUE, %, 2021 VS 2028
- Figure 27:
- ASIA-PACIFIC BUSINESS JET MARKET, BY INDIA, VOLUME, UNITS, 2016 - 2028
- Figure 28:
- ASIA-PACIFIC BUSINESS JET MARKET, BY INDIA, VALUE, USD, 2016 - 2028
- Figure 29:
- ASIA-PACIFIC BUSINESS JET MARKET, BY INDIA, VALUE, %, 2021 VS 2028
- Figure 30:
- ASIA-PACIFIC BUSINESS JET MARKET, BY INDONESIA, VOLUME, UNITS, 2016 - 2028
- Figure 31:
- ASIA-PACIFIC BUSINESS JET MARKET, BY INDONESIA, VALUE, USD, 2016 - 2028
- Figure 32:
- ASIA-PACIFIC BUSINESS JET MARKET, BY INDONESIA, VALUE, %, 2021 VS 2028
- Figure 33:
- ASIA-PACIFIC BUSINESS JET MARKET, BY JAPAN, VOLUME, UNITS, 2016 - 2028
- Figure 34:
- ASIA-PACIFIC BUSINESS JET MARKET, BY JAPAN, VALUE, USD, 2016 - 2028
- Figure 35:
- ASIA-PACIFIC BUSINESS JET MARKET, BY JAPAN, VALUE, %, 2021 VS 2028
- Figure 36:
- ASIA-PACIFIC BUSINESS JET MARKET, BY MALAYSIA, VOLUME, UNITS, 2016 - 2028
- Figure 37:
- ASIA-PACIFIC BUSINESS JET MARKET, BY MALAYSIA, VALUE, USD, 2016 - 2028
- Figure 38:
- ASIA-PACIFIC BUSINESS JET MARKET, BY MALAYSIA, VALUE, %, 2021 VS 2028
- Figure 39:
- ASIA-PACIFIC BUSINESS JET MARKET, BY PHILIPPINES, VOLUME, UNITS, 2016 - 2028
- Figure 40:
- ASIA-PACIFIC BUSINESS JET MARKET, BY PHILIPPINES, VALUE, USD, 2016 - 2028
- Figure 41:
- ASIA-PACIFIC BUSINESS JET MARKET, BY PHILIPPINES, VALUE, %, 2021 VS 2028
- Figure 42:
- ASIA-PACIFIC BUSINESS JET MARKET, BY SINGAPORE, VOLUME, UNITS, 2016 - 2028
- Figure 43:
- ASIA-PACIFIC BUSINESS JET MARKET, BY SINGAPORE, VALUE, USD, 2016 - 2028
- Figure 44:
- ASIA-PACIFIC BUSINESS JET MARKET, BY SINGAPORE, VALUE, %, 2021 VS 2028
- Figure 45:
- ASIA-PACIFIC BUSINESS JET MARKET, BY SOUTH KOREA, VOLUME, UNITS, 2016 - 2028
- Figure 46:
- ASIA-PACIFIC BUSINESS JET MARKET, BY SOUTH KOREA, VALUE, USD, 2016 - 2028
- Figure 47:
- ASIA-PACIFIC BUSINESS JET MARKET, BY SOUTH KOREA, VALUE, %, 2021 VS 2028
- Figure 48:
- ASIA-PACIFIC BUSINESS JET MARKET, BY THAILAND, VOLUME, UNITS, 2016 - 2028
- Figure 49:
- ASIA-PACIFIC BUSINESS JET MARKET, BY THAILAND, VALUE, USD, 2016 - 2028
- Figure 50:
- ASIA-PACIFIC BUSINESS JET MARKET, BY THAILAND, VALUE, %, 2021 VS 2028
- Figure 51:
- ASIA-PACIFIC BUSINESS JET MARKET, BY REST OF ASIA-PACIFIC, VOLUME, UNITS, 2016 - 2028
- Figure 52:
- ASIA-PACIFIC BUSINESS JET MARKET, BY REST OF ASIA-PACIFIC, VALUE, USD, 2016 - 2028
- Figure 53:
- ASIA-PACIFIC BUSINESS JET MARKET, BY REST OF ASIA-PACIFIC, VALUE, %, 2021 VS 2028
- Figure 54:
- ASIA-PACIFIC BUSINESS JET MARKET, MOST ACTIVE COMPANIES, BY NUMBER OF STRATEGIC MOVES, 2018 - 2021
- Figure 55:
- ASIA-PACIFIC BUSINESS JET MARKET, MOST ADOPTED STRATEGIES, 2018 - 2021
- Figure 56:
- ASIA-PACIFIC BUSINESS JET MARKET SHARE(%), BY MAJOR PLAYERS, 2021
Asia-Pacific Business Jet Industry Segmentation
Large Jet, Light Jet, Mid-Size Jet are covered as segments by Body Type. Australia, China, India, Indonesia, Japan, Malaysia, Philippines, Singapore, South Korea, Thailand are covered as segments by Country.| Body Type | |
| Large Jet | |
| Light Jet | |
| Mid-Size Jet |
| Country | |
| Australia | |
| China | |
| India | |
| Indonesia | |
| Japan | |
| Malaysia | |
| Philippines | |
| Singapore | |
| South Korea | |
| Thailand | |
| Rest Of Asia-Pacific |
Market Definition
- Aircraft Type - General Aviation includes aircraft used for corporate aviation, business aviation and other aerial works.
- Body Type - Light Jets, Mid-Size Jets, and Large Jets according to their ability to carry passengers and flying distance ranges have been included under this study.
- Sub-Aircraft Type - Business Jets which are private jets and are designed to carry small groups of people and are used for various roles are included in this study.
Research Methodology
Mordor Intelligence follows a four-step methodology in all our reports.
- Step-1: Identify Key Variables: In order to build a robust forecasting methodology, the variables and factors identified in Step-1 are tested against available historical market numbers. Through an iterative process, the variables required for market forecast are set and the model is built on the basis of these variables.
- Step-2: Build a Market Model: Market-size estimations for the historical and forecast years have been provided in revenue and volume terms. For sales conversion to volume, the average selling price (ASP) is kept constant throughout the forecast period for each country, and inflation is not a part of the pricing.
- Step-3: Validate and Finalize: In this important step, all market numbers, variables and analyst calls are validated through an extensive network of primary research experts from the market studied. The respondents are selected across levels and functions to generate a holistic picture of the market studied.
- Step-4: Research Outputs: Syndicated Reports, Custom Consulting Assignments, Databases & Subscription Platforms


