Asia-pacific Feed Acidifiers Market Size

| Icons | Lable | Value |
|---|---|---|
|
|
Study Period | 2017 - 2029 |
|
|
Base Year For Estimation | 2022 |
|
|
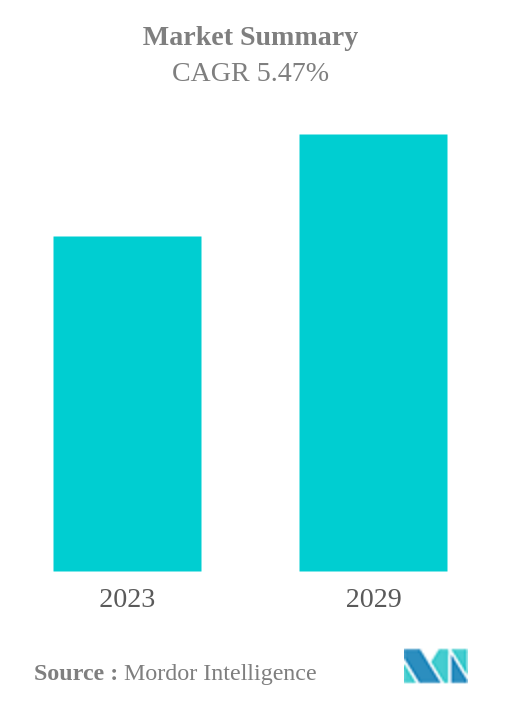
CAGR | 5.47 % |
|
|
Largest Share by Sub Additive | Propionic Acid |
|
|
Largest Share by Country | China |
|
|
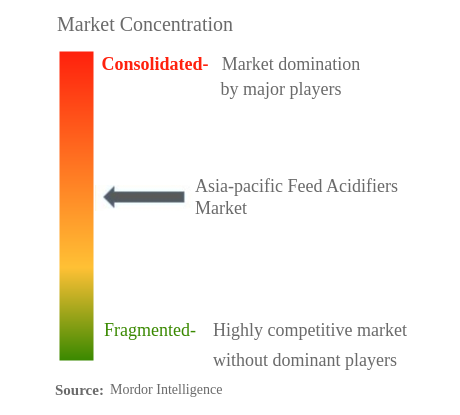
Market Concentration | High |
Major Players |
||
|
|
||
|
*Disclaimer: Major Players sorted in no particular order |
Asia-pacific Feed Acidifiers Market Analysis
The Asia-pacific Feed Acidifiers Market is projected to register a CAGR of 5.47%
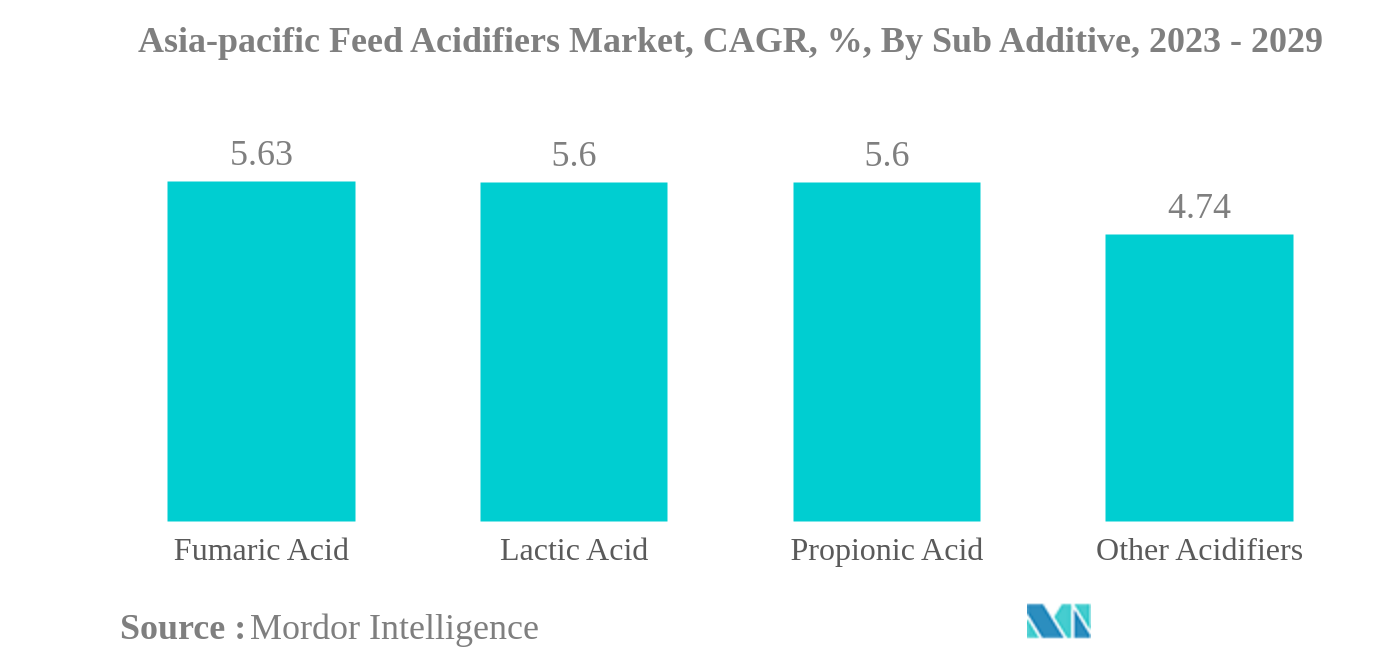
- Propionic Acid is the Largest Sub Additive: Propionic acid is the largest segment as it is an alternative to antibiotics due to restrictions on the usage of feed antibiotics and rising demand for animal products.
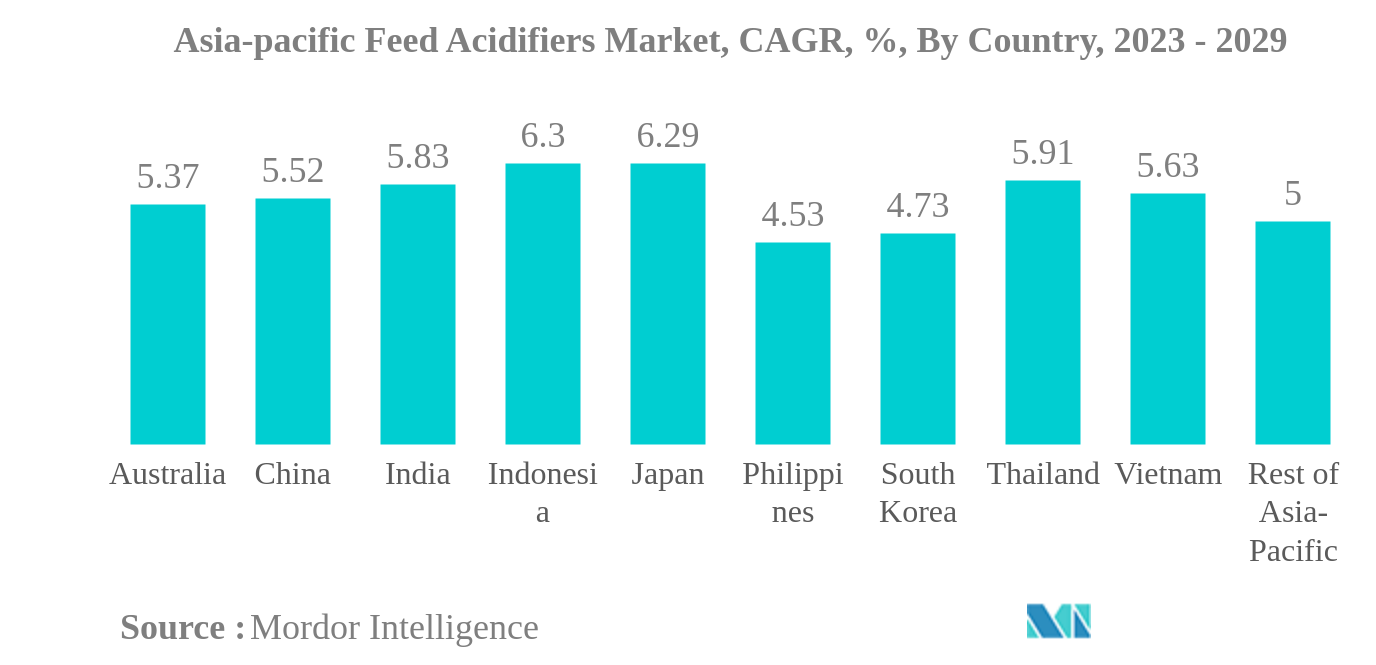
- China is the Largest Country: China is the largest because of the increased livestock population. Feed production in the country is expected to increase by 7.7% during 2022-2029.
- Fumaric Acid is the Fastest-growing Sub Additive: Fumaric acid is the fastest-growing segment because its consumption helps improve the immune system, gut health, and nutrient digestion. It is also used as a preservative in feed.
- Indonesia is the Fastest-growing Country: Indonesia is the fastest-growing country due to the growing demand for animal products, the Indonesian feed mill association's policies, and the livestock increase.
Asia-pacific Feed Acidifiers Market Trends
This section covers the major market trends shaping the Asia-pacific Feed Acidifiers Market according to our research experts:
Propionic Acid is the largest Sub Additive
- The acidifiers segment of the Asia-Pacific feed additives market held a 7.0% market share in 2022. This group of additives is highly valued in animal nutrition as it improves feed performance and reduces the uptake of pathogenic organisms and toxic metabolites. Among the feed acidifiers, propionic acid held a significant market value of USD 238.0 million in 2022, which grew by 47.8% between 2017 and 2022 in the Asia-Pacific region due to its role in improving nutrient absorption and reducing pathogenic microbes.
- Poultry birds were the largest animal type segment in the region, with 49.9% of the market share value in the Asia-Pacific feed acidifiers market in 2022. This segment is projected to record a CAGR of 6.1% during the forecast period due to the higher usage of feed acidifiers in poultry birds, which promote growth, boost metabolism and feed intake, and provide resistance to harmful pathogens.
- Indonesia is expected to register the fastest growth rate of 6.5% during the forecast period, with respect to lactic acid, due to a 21.5% increase in feed production between 2017 and 2022. Lactic acid helps improve gastrointestinal tract health, digestibility, and nutrient utilization when added to compound feed.
- China held the largest market share of 44.2% with respect to the acidifiers market in 2022 due to the increased headcount of poultry by 1.6% in the country between 2017 and 2022.
- Based on the above-mentioned factors and the importance of feed acidifiers in animal nutrition, the Asia-Pacific feed acidifiers market is anticipated to record a CAGR of 5.5% during the forecast period.
China is the largest Country
- The Asia-Pacific witnessed significant growth in the feed acidifiers market, with China, India, and Japan being the top countries in terms of market share. In 2022, these countries collectively accounted for 59.3% of the market share in the region. China, particularly, had a market value of USD 321.8 million in 2022, which is expected to reach USD 468.1 million in 2029. The country's high share can be attributed to its large livestock population, with China accounting for 39.7% of the Asia-Pacific's poultry population in 2022.
- Poultry birds were the largest animal types in the Asia-Pacific feed acidifiers market, with a 50% market share in 2022, followed by swine and ruminants at 31% and 9.7%, respectively. The higher market share for poultry birds and swine was due to their higher commercial cultivation and demand for meat and eggs in the food industry. Poultry birds are anticipated to witness the fastest growth during the forecast period. Layers, shrimp, and fish are growing at a faster pace, anticipated to register a CAGR of 6.6%, 6.4%, and 6.2%, respectively, during the forecast period.
- Propionic and fumaric acid were the most consumed feed acidifier types in the region, with 32.7% and 26.8% market share, respectively. This was associated with their higher penetration rates and higher utilization of feed for poultry and aquaculture species.
- During the forecast period, Japan and Indonesia are expected to be the fastest-growing segments in the Asia-Pacific feed acidifiers market, with a CAGR of 6.3% each, due to increased feed production in both countries. The Asia-Pacific feed acidifiers market is expected to grow at a CAGR of 5.5% during the forecast period, driven by an increase in the usage of acidifiers.
Asia-pacific Feed Acidifiers Industry Overview
The Asia-pacific Feed Acidifiers Market is moderately consolidated, with the top five companies occupying 42.36%. The major players in this market are Adisseo, BASF SE, Cargill Inc., DSM Nutritional Products AG and SHV (Nutreco NV) (sorted alphabetically).
Asia-pacific Feed Acidifiers Market Leaders
Adisseo
BASF SE
Cargill Inc.
DSM Nutritional Products AG
SHV (Nutreco NV)
*Disclaimer: Major Players sorted in no particular order
Asia-pacific Feed Acidifiers Market News
- January 2022: DSM and CPF have agreed on a Memorandum of Understanding to enhance animal protein production by applying DSM's Intelligent Sustainability Service (Sustell).
- December 2021: Nutreco partnered with the tech start-up Stellapps. This will give accessibility for the company to sell feed products, premixes, and feed additives to three million smallholder farmers using Stellapps’ technology.
- December 2020: The acquisition of Erber Group’s Biomin further strengthens DSM's product portfolio by expanding its product offerings. The enterprise value of the combined company is about USD 1,046.1 million.
Asia-pacific Feed Acidifiers Market Report - Table of Contents
1. INTRODUCTION
1.1. Study Assumptions & Market Definition
1.2. Scope of the Study
1.3. Research Methodology
2. KEY INDUSTRY TRENDS
2.1. Animal Headcount
2.2. Feed Production
2.3. Regulatory Framework
2.4. Value Chain & Distribution Channel Analysis
3. MARKET SEGMENTATION
3.1. Sub Additive
3.1.1. Fumaric Acid
3.1.2. Lactic Acid
3.1.3. Propionic Acid
3.1.4. Other Acidifiers
3.2. Animal
3.2.1. Aquaculture
3.2.1.1. By Sub Animal
3.2.1.1.1. Fish
3.2.1.1.2. Shrimp
3.2.1.1.3. Other Aquaculture Species
3.2.2. Poultry
3.2.2.1. By Sub Animal
3.2.2.1.1. Broiler
3.2.2.1.2. Layer
3.2.2.1.3. Other Poultry Birds
3.2.3. Ruminants
3.2.3.1. By Sub Animal
3.2.3.1.1. Beef Cattle
3.2.3.1.2. Dairy Cattle
3.2.3.1.3. Other Ruminants
3.2.4. Swine
3.2.5. Other Animals
3.3. Country
3.3.1. Australia
3.3.2. China
3.3.3. India
3.3.4. Indonesia
3.3.5. Japan
3.3.6. Philippines
3.3.7. South Korea
3.3.8. Thailand
3.3.9. Vietnam
3.3.10. Rest of Asia-Pacific
4. COMPETITIVE LANDSCAPE
4.1. Key Strategic Moves
4.2. Market Share Analysis
4.3. Company Landscape
4.4. Company Profiles
4.4.1. Adisseo
4.4.2. BASF SE
4.4.3. Brenntag SE
4.4.4. Cargill Inc.
4.4.5. DSM Nutritional Products AG
4.4.6. EW Nutrition
4.4.7. Kemin Industries
4.4.8. MIAVIT Stefan Niemeyer GmbH
4.4.9. SHV (Nutreco NV)
4.4.10. Yara International ASA
5. KEY STRATEGIC QUESTIONS FOR FEED ADDITIVE CEOS
6. APPENDIX
6.1. Global Overview
6.1.1. Overview
6.1.2. Porter’s Five Forces Framework
6.1.3. Global Value Chain Analysis
6.1.4. Global Market Size and DROs
6.2. Sources & References
6.3. List of Tables & Figures
6.4. Primary Insights
6.5. Data Pack
6.6. Glossary of Terms
List of Tables & Figures
- Figure 1:
- ASIA-PACIFIC FEED ACIDIFIERS MARKET, ANIMAL HEAD COUNT, NUMBER, BY POULTRY, 2017-2022
- Figure 2:
- ASIA-PACIFIC FEED ACIDIFIERS MARKET, ANIMAL HEAD COUNT, NUMBER, BY RUMINANTS, 2017-2022
- Figure 3:
- ASIA-PACIFIC FEED ACIDIFIERS MARKET, ANIMAL HEAD COUNT, NUMBER, BY SWINE, 2017-2022
- Figure 4:
- ASIA-PACIFIC FEED ACIDIFIERS MARKET, FEED PRODUCTION, METRIC TON, BY AQUACULTURE, 2017-2022
- Figure 5:
- ASIA-PACIFIC FEED ACIDIFIERS MARKET, FEED PRODUCTION, METRIC TON, BY POULTRY, 2017-2022
- Figure 6:
- ASIA-PACIFIC FEED ACIDIFIERS MARKET, FEED PRODUCTION, METRIC TON, BY RUMINANTS, 2017-2022
- Figure 7:
- ASIA-PACIFIC FEED ACIDIFIERS MARKET, FEED PRODUCTION, METRIC TON, BY SWINE, 2017-2022
- Figure 8:
- ASIA-PACIFIC FEED ACIDIFIERS MARKET, VOLUME, METRIC TON, 2017 - 2029
- Figure 9:
- ASIA-PACIFIC FEED ACIDIFIERS MARKET, VALUE, USD, 2017 - 2029
- Figure 10:
- ASIA-PACIFIC FEED ACIDIFIERS MARKET, BY SUB ADDITIVE, VOLUME, METRIC TON, 2017 - 2029
- Figure 11:
- ASIA-PACIFIC FEED ACIDIFIERS MARKET, BY SUB ADDITIVE, VALUE, USD, 2017 - 2029
- Figure 12:
- ASIA-PACIFIC FEED ACIDIFIERS MARKET, VOLUME SHARE(%), BY SUB ADDITIVE, 2017 - 2029
- Figure 13:
- ASIA-PACIFIC FEED ACIDIFIERS MARKET, VALUE SHARE(%), BY SUB ADDITIVE, 2017 - 2029
- Figure 14:
- ASIA-PACIFIC FEED ACIDIFIERS MARKET, BY SUB ADDITIVE, VOLUME, METRIC TON, 2017 - 2029
- Figure 15:
- ASIA-PACIFIC FEED ACIDIFIERS MARKET, BY SUB ADDITIVE, VALUE, USD, 2017 - 2029
- Figure 16:
- ASIA-PACIFIC FEED ACIDIFIERS MARKET, VALUE SHARE(%), BY ANIMAL, 2022 - 2029
- Figure 17:
- ASIA-PACIFIC FEED ACIDIFIERS MARKET, BY SUB ADDITIVE, VOLUME, METRIC TON, 2017 - 2029
- Figure 18:
- ASIA-PACIFIC FEED ACIDIFIERS MARKET, BY SUB ADDITIVE, VALUE, USD, 2017 - 2029
- Figure 19:
- ASIA-PACIFIC FEED ACIDIFIERS MARKET, VALUE SHARE(%), BY ANIMAL, 2022 - 2029
- Figure 20:
- ASIA-PACIFIC FEED ACIDIFIERS MARKET, BY SUB ADDITIVE, VOLUME, METRIC TON, 2017 - 2029
- Figure 21:
- ASIA-PACIFIC FEED ACIDIFIERS MARKET, BY SUB ADDITIVE, VALUE, USD, 2017 - 2029
- Figure 22:
- ASIA-PACIFIC FEED ACIDIFIERS MARKET, VALUE SHARE(%), BY ANIMAL, 2022 - 2029
- Figure 23:
- ASIA-PACIFIC FEED ACIDIFIERS MARKET, BY SUB ADDITIVE, VOLUME, METRIC TON, 2017 - 2029
- Figure 24:
- ASIA-PACIFIC FEED ACIDIFIERS MARKET, BY SUB ADDITIVE, VALUE, USD, 2017 - 2029
- Figure 25:
- ASIA-PACIFIC FEED ACIDIFIERS MARKET, VALUE SHARE(%), BY ANIMAL, 2022 - 2029
- Figure 26:
- ASIA-PACIFIC FEED ACIDIFIERS MARKET, BY ANIMAL, VOLUME, METRIC TON, 2017 - 2029
- Figure 27:
- ASIA-PACIFIC FEED ACIDIFIERS MARKET, BY ANIMAL, VALUE, USD, 2017 - 2029
- Figure 28:
- ASIA-PACIFIC FEED ACIDIFIERS MARKET, VOLUME SHARE(%), BY ANIMAL, 2017 - 2029
- Figure 29:
- ASIA-PACIFIC FEED ACIDIFIERS MARKET, VALUE SHARE(%), BY ANIMAL, 2017 - 2029
- Figure 30:
- ASIA-PACIFIC FEED ACIDIFIERS MARKET, BY SUB ANIMAL, VOLUME, METRIC TON, 2017 - 2029
- Figure 31:
- ASIA-PACIFIC FEED ACIDIFIERS MARKET, BY SUB ANIMAL, VALUE, USD, 2017 - 2029
- Figure 32:
- ASIA-PACIFIC FEED ACIDIFIERS MARKET, VOLUME SHARE(%), BY SUB ANIMAL, 2017 - 2029
- Figure 33:
- ASIA-PACIFIC FEED ACIDIFIERS MARKET, VALUE SHARE(%), BY SUB ANIMAL, 2017 - 2029
- Figure 34:
- ASIA-PACIFIC FEED ACIDIFIERS MARKET, BY SUB ANIMAL, VOLUME, METRIC TON, 2017 - 2029
- Figure 35:
- ASIA-PACIFIC FEED ACIDIFIERS MARKET, BY SUB ANIMAL, VALUE, USD, 2017 - 2029
- Figure 36:
- ASIA-PACIFIC FEED ACIDIFIERS MARKET, VALUE SHARE(%), BY SUB ADDITIVE, 2022 - 2029
- Figure 37:
- ASIA-PACIFIC FEED ACIDIFIERS MARKET, BY SUB ANIMAL, VOLUME, METRIC TON, 2017 - 2029
- Figure 38:
- ASIA-PACIFIC FEED ACIDIFIERS MARKET, BY SUB ANIMAL, VALUE, USD, 2017 - 2029
- Figure 39:
- ASIA-PACIFIC FEED ACIDIFIERS MARKET, VALUE SHARE(%), BY SUB ADDITIVE, 2022 - 2029
- Figure 40:
- ASIA-PACIFIC FEED ACIDIFIERS MARKET, BY SUB ANIMAL, VOLUME, METRIC TON, 2017 - 2029
- Figure 41:
- ASIA-PACIFIC FEED ACIDIFIERS MARKET, BY SUB ANIMAL, VALUE, USD, 2017 - 2029
- Figure 42:
- ASIA-PACIFIC FEED ACIDIFIERS MARKET, VALUE SHARE(%), BY SUB ADDITIVE, 2022 - 2029
- Figure 43:
- ASIA-PACIFIC FEED ACIDIFIERS MARKET, BY SUB ANIMAL, VOLUME, METRIC TON, 2017 - 2029
- Figure 44:
- ASIA-PACIFIC FEED ACIDIFIERS MARKET, BY SUB ANIMAL, VALUE, USD, 2017 - 2029
- Figure 45:
- ASIA-PACIFIC FEED ACIDIFIERS MARKET, VOLUME SHARE(%), BY SUB ANIMAL, 2017 - 2029
- Figure 46:
- ASIA-PACIFIC FEED ACIDIFIERS MARKET, VALUE SHARE(%), BY SUB ANIMAL, 2017 - 2029
- Figure 47:
- ASIA-PACIFIC FEED ACIDIFIERS MARKET, BY SUB ANIMAL, VOLUME, METRIC TON, 2017 - 2029
- Figure 48:
- ASIA-PACIFIC FEED ACIDIFIERS MARKET, BY SUB ANIMAL, VALUE, USD, 2017 - 2029
- Figure 49:
- ASIA-PACIFIC FEED ACIDIFIERS MARKET, VALUE SHARE(%), BY SUB ADDITIVE, 2022 - 2029
- Figure 50:
- ASIA-PACIFIC FEED ACIDIFIERS MARKET, BY SUB ANIMAL, VOLUME, METRIC TON, 2017 - 2029
- Figure 51:
- ASIA-PACIFIC FEED ACIDIFIERS MARKET, BY SUB ANIMAL, VALUE, USD, 2017 - 2029
- Figure 52:
- ASIA-PACIFIC FEED ACIDIFIERS MARKET, VALUE SHARE(%), BY SUB ADDITIVE, 2022 - 2029
- Figure 53:
- ASIA-PACIFIC FEED ACIDIFIERS MARKET, BY SUB ANIMAL, VOLUME, METRIC TON, 2017 - 2029
- Figure 54:
- ASIA-PACIFIC FEED ACIDIFIERS MARKET, BY SUB ANIMAL, VALUE, USD, 2017 - 2029
- Figure 55:
- ASIA-PACIFIC FEED ACIDIFIERS MARKET, VALUE SHARE(%), BY SUB ADDITIVE, 2022 - 2029
- Figure 56:
- ASIA-PACIFIC FEED ACIDIFIERS MARKET, BY SUB ANIMAL, VOLUME, METRIC TON, 2017 - 2029
- Figure 57:
- ASIA-PACIFIC FEED ACIDIFIERS MARKET, BY SUB ANIMAL, VALUE, USD, 2017 - 2029
- Figure 58:
- ASIA-PACIFIC FEED ACIDIFIERS MARKET, VOLUME SHARE(%), BY SUB ANIMAL, 2017 - 2029
- Figure 59:
- ASIA-PACIFIC FEED ACIDIFIERS MARKET, VALUE SHARE(%), BY SUB ANIMAL, 2017 - 2029
- Figure 60:
- ASIA-PACIFIC FEED ACIDIFIERS MARKET, BY SUB ANIMAL, VOLUME, METRIC TON, 2017 - 2029
- Figure 61:
- ASIA-PACIFIC FEED ACIDIFIERS MARKET, BY SUB ANIMAL, VALUE, USD, 2017 - 2029
- Figure 62:
- ASIA-PACIFIC FEED ACIDIFIERS MARKET, VALUE SHARE(%), BY SUB ADDITIVE, 2022 - 2029
- Figure 63:
- ASIA-PACIFIC FEED ACIDIFIERS MARKET, BY SUB ANIMAL, VOLUME, METRIC TON, 2017 - 2029
- Figure 64:
- ASIA-PACIFIC FEED ACIDIFIERS MARKET, BY SUB ANIMAL, VALUE, USD, 2017 - 2029
- Figure 65:
- ASIA-PACIFIC FEED ACIDIFIERS MARKET, VALUE SHARE(%), BY SUB ADDITIVE, 2022 - 2029
- Figure 66:
- ASIA-PACIFIC FEED ACIDIFIERS MARKET, BY SUB ANIMAL, VOLUME, METRIC TON, 2017 - 2029
- Figure 67:
- ASIA-PACIFIC FEED ACIDIFIERS MARKET, BY SUB ANIMAL, VALUE, USD, 2017 - 2029
- Figure 68:
- ASIA-PACIFIC FEED ACIDIFIERS MARKET, VALUE SHARE(%), BY SUB ADDITIVE, 2022 - 2029
- Figure 69:
- ASIA-PACIFIC FEED ACIDIFIERS MARKET, BY ANIMAL, VOLUME, METRIC TON, 2017 - 2029
- Figure 70:
- ASIA-PACIFIC FEED ACIDIFIERS MARKET, BY ANIMAL, VALUE, USD, 2017 - 2029
- Figure 71:
- ASIA-PACIFIC FEED ACIDIFIERS MARKET, VALUE SHARE(%), BY SUB ADDITIVE, 2022 - 2029
- Figure 72:
- ASIA-PACIFIC FEED ACIDIFIERS MARKET, BY ANIMAL, VOLUME, METRIC TON, 2017 - 2029
- Figure 73:
- ASIA-PACIFIC FEED ACIDIFIERS MARKET, BY ANIMAL, VALUE, USD, 2017 - 2029
- Figure 74:
- ASIA-PACIFIC FEED ACIDIFIERS MARKET, VALUE SHARE(%), BY SUB ADDITIVE, 2022 - 2029
- Figure 75:
- ASIA-PACIFIC FEED ACIDIFIERS MARKET, BY COUNTRY, VOLUME, METRIC TON, 2017 - 2029
- Figure 76:
- ASIA-PACIFIC FEED ACIDIFIERS MARKET, BY COUNTRY, VALUE, USD, 2017 - 2029
- Figure 77:
- ASIA-PACIFIC FEED ACIDIFIERS MARKET, VOLUME SHARE(%), BY COUNTRY, 2017 - 2029
- Figure 78:
- ASIA-PACIFIC FEED ACIDIFIERS MARKET, VALUE SHARE(%), BY COUNTRY, 2017 - 2029
- Figure 79:
- ASIA-PACIFIC FEED ACIDIFIERS MARKET, BY COUNTRY, VOLUME, METRIC TON, 2017 - 2029
- Figure 80:
- ASIA-PACIFIC FEED ACIDIFIERS MARKET, BY COUNTRY, VALUE, USD, 2017 - 2029
- Figure 81:
- ASIA-PACIFIC FEED ACIDIFIERS MARKET, VALUE SHARE(%), BY SUB ADDITIVE, 2022 - 2029
- Figure 82:
- ASIA-PACIFIC FEED ACIDIFIERS MARKET, BY COUNTRY, VOLUME, METRIC TON, 2017 - 2029
- Figure 83:
- ASIA-PACIFIC FEED ACIDIFIERS MARKET, BY COUNTRY, VALUE, USD, 2017 - 2029
- Figure 84:
- ASIA-PACIFIC FEED ACIDIFIERS MARKET, VALUE SHARE(%), BY SUB ADDITIVE, 2022 - 2029
- Figure 85:
- ASIA-PACIFIC FEED ACIDIFIERS MARKET, BY COUNTRY, VOLUME, METRIC TON, 2017 - 2029
- Figure 86:
- ASIA-PACIFIC FEED ACIDIFIERS MARKET, BY COUNTRY, VALUE, USD, 2017 - 2029
- Figure 87:
- ASIA-PACIFIC FEED ACIDIFIERS MARKET, VALUE SHARE(%), BY SUB ADDITIVE, 2022 - 2029
- Figure 88:
- ASIA-PACIFIC FEED ACIDIFIERS MARKET, BY COUNTRY, VOLUME, METRIC TON, 2017 - 2029
- Figure 89:
- ASIA-PACIFIC FEED ACIDIFIERS MARKET, BY COUNTRY, VALUE, USD, 2017 - 2029
- Figure 90:
- ASIA-PACIFIC FEED ACIDIFIERS MARKET, VALUE SHARE(%), BY SUB ADDITIVE, 2022 - 2029
- Figure 91:
- ASIA-PACIFIC FEED ACIDIFIERS MARKET, BY COUNTRY, VOLUME, METRIC TON, 2017 - 2029
- Figure 92:
- ASIA-PACIFIC FEED ACIDIFIERS MARKET, BY COUNTRY, VALUE, USD, 2017 - 2029
- Figure 93:
- ASIA-PACIFIC FEED ACIDIFIERS MARKET, VALUE SHARE(%), BY SUB ADDITIVE, 2022 - 2029
- Figure 94:
- ASIA-PACIFIC FEED ACIDIFIERS MARKET, BY COUNTRY, VOLUME, METRIC TON, 2017 - 2029
- Figure 95:
- ASIA-PACIFIC FEED ACIDIFIERS MARKET, BY COUNTRY, VALUE, USD, 2017 - 2029
- Figure 96:
- ASIA-PACIFIC FEED ACIDIFIERS MARKET, VALUE SHARE(%), BY SUB ADDITIVE, 2022 - 2029
- Figure 97:
- ASIA-PACIFIC FEED ACIDIFIERS MARKET, BY COUNTRY, VOLUME, METRIC TON, 2017 - 2029
- Figure 98:
- ASIA-PACIFIC FEED ACIDIFIERS MARKET, BY COUNTRY, VALUE, USD, 2017 - 2029
- Figure 99:
- ASIA-PACIFIC FEED ACIDIFIERS MARKET, VALUE SHARE(%), BY SUB ADDITIVE, 2022 - 2029
- Figure 100:
- ASIA-PACIFIC FEED ACIDIFIERS MARKET, BY COUNTRY, VOLUME, METRIC TON, 2017 - 2029
- Figure 101:
- ASIA-PACIFIC FEED ACIDIFIERS MARKET, BY COUNTRY, VALUE, USD, 2017 - 2029
- Figure 102:
- ASIA-PACIFIC FEED ACIDIFIERS MARKET, VALUE SHARE(%), BY SUB ADDITIVE, 2022 - 2029
- Figure 103:
- ASIA-PACIFIC FEED ACIDIFIERS MARKET, BY COUNTRY, VOLUME, METRIC TON, 2017 - 2029
- Figure 104:
- ASIA-PACIFIC FEED ACIDIFIERS MARKET, BY COUNTRY, VALUE, USD, 2017 - 2029
- Figure 105:
- ASIA-PACIFIC FEED ACIDIFIERS MARKET, VALUE SHARE(%), BY SUB ADDITIVE, 2022 - 2029
- Figure 106:
- ASIA-PACIFIC FEED ACIDIFIERS MARKET, BY COUNTRY, VOLUME, METRIC TON, 2017 - 2029
- Figure 107:
- ASIA-PACIFIC FEED ACIDIFIERS MARKET, BY COUNTRY, VALUE, USD, 2017 - 2029
- Figure 108:
- ASIA-PACIFIC FEED ACIDIFIERS MARKET, VALUE SHARE(%), BY SUB ADDITIVE, 2022 - 2029
- Figure 109:
- ASIA-PACIFIC FEED ACIDIFIERS MARKET, MOST ACTIVE COMPANIES, BY NUMBER OF STRATEGIC MOVES, 2016 - 2022
- Figure 110:
- ASIA-PACIFIC FEED ACIDIFIERS MARKET, MOST ADOPTED STRATEGIES, 2016 - 2022
- Figure 111:
- ASIA-PACIFIC FEED ACIDIFIERS MARKET SHARE(%), BY MAJOR PLAYERS, 2022
Asia-pacific Feed Acidifiers Industry Segmentation
Fumaric Acid, Lactic Acid, Propionic Acid are covered as segments by Sub Additive. Aquaculture, Poultry, Ruminants, Swine are covered as segments by Animal. Australia, China, India, Indonesia, Japan, Philippines, South Korea, Thailand, Vietnam are covered as segments by Country.| Sub Additive | |
| Fumaric Acid | |
| Lactic Acid | |
| Propionic Acid | |
| Other Acidifiers |
| Animal | |||||||
| |||||||
| |||||||
| |||||||
| Swine | |||||||
| Other Animals |
| Country | |
| Australia | |
| China | |
| India | |
| Indonesia | |
| Japan | |
| Philippines | |
| South Korea | |
| Thailand | |
| Vietnam | |
| Rest of Asia-Pacific |
Market Definition
- FUNCTIONS - For the purpose of the study, feed additives are considered to be commercially-manufactured products that are used to enhance the characteristics such as weight gain, feed conversion ratio, and feed intake when fed in appropriate proportions.
- RESELLERS - Companies engaged in reselling of feed additives without value addition have been excluded from the market scope, in order to avoid double counting.
- END CONSUMERS - Compound feed manufacturers are considered to be end-consumers in the market studied. The scope excludes farmers buying feed additives to be used directly as supplements or premixes.
- INTERNAL COMPANY CONSUMPTION - Companies engaged in the production of compound feed as well as the manufacturing of feed additives are part of the study. However, while estimating the market sizes, the internal consumption of feed additives by such companies has been excluded.
Research Methodology
Mordor Intelligence follows a four-step methodology in all our reports.
- Step-1: Identify Key Variables: The quantifiable key variables (industry and extraneous) pertaining to the specific product segment and country are selected from a group of relevant variables & factors based on desk research & literature review; along with primary expert inputs. These variables are further confirmed through regression modeling (wherever required).
- Step-2: Build a Market Model: In order to build a robust forecasting methodology, the variables and factors identified in Step-1 are tested against available historical market numbers. Through an iterative process, the variables required for market forecast are set and the model is built on the basis of these variables.
- Step-3: Validate and Finalize: In this important step, all market numbers, variables and analyst calls are validated through an extensive network of primary research experts from the market studied. The respondents are selected across levels and functions to generate a holistic picture of the market studied.
- Step-4: Research Outputs: Syndicated Reports, Custom Consulting Assignments, Databases & Subscription Platforms


