Asia-Pacific General Aviation Market Size

| Icons | Lable | Value |
|---|---|---|
|
|
Study Period | 2016 - 2028 |
|
|
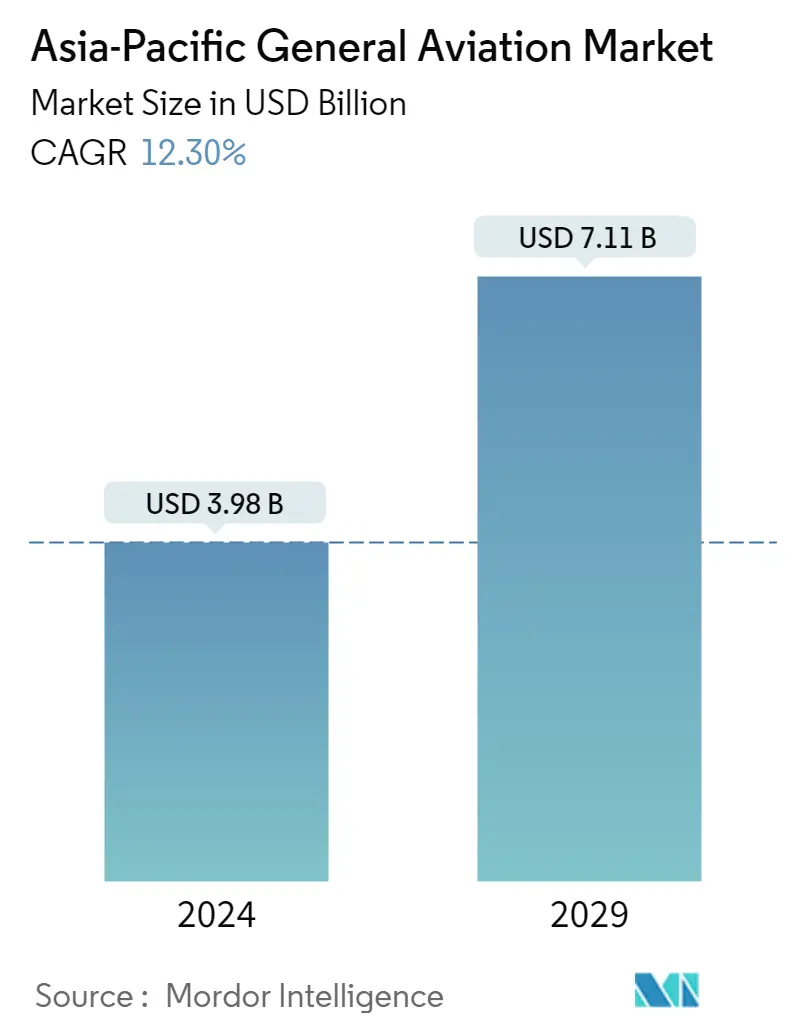
Market Size (2023) | USD 3.98 Billion |
|
|
Market Size (2028) | USD 7.10 Billion |
|
|
CAGR (2023 - 2028) | 12.30 % |
|
|
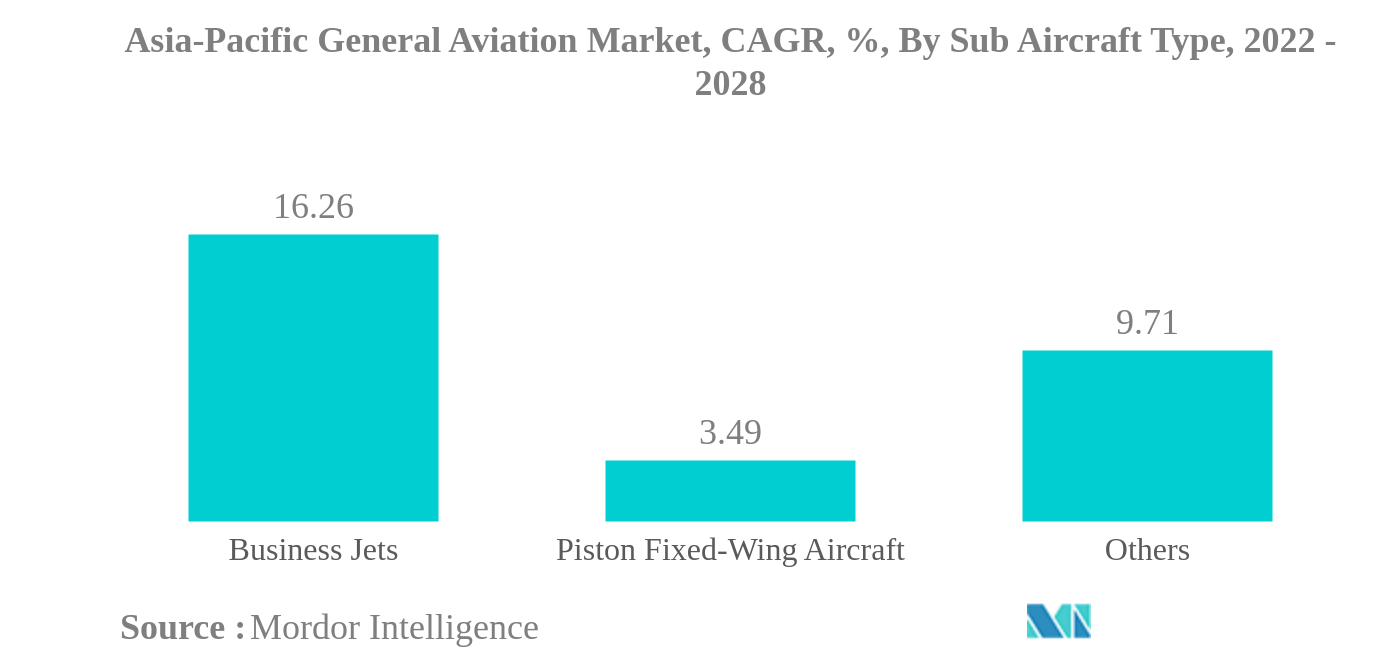
Largest Share by Sub Aircraft Type | Business Jets |
|
|
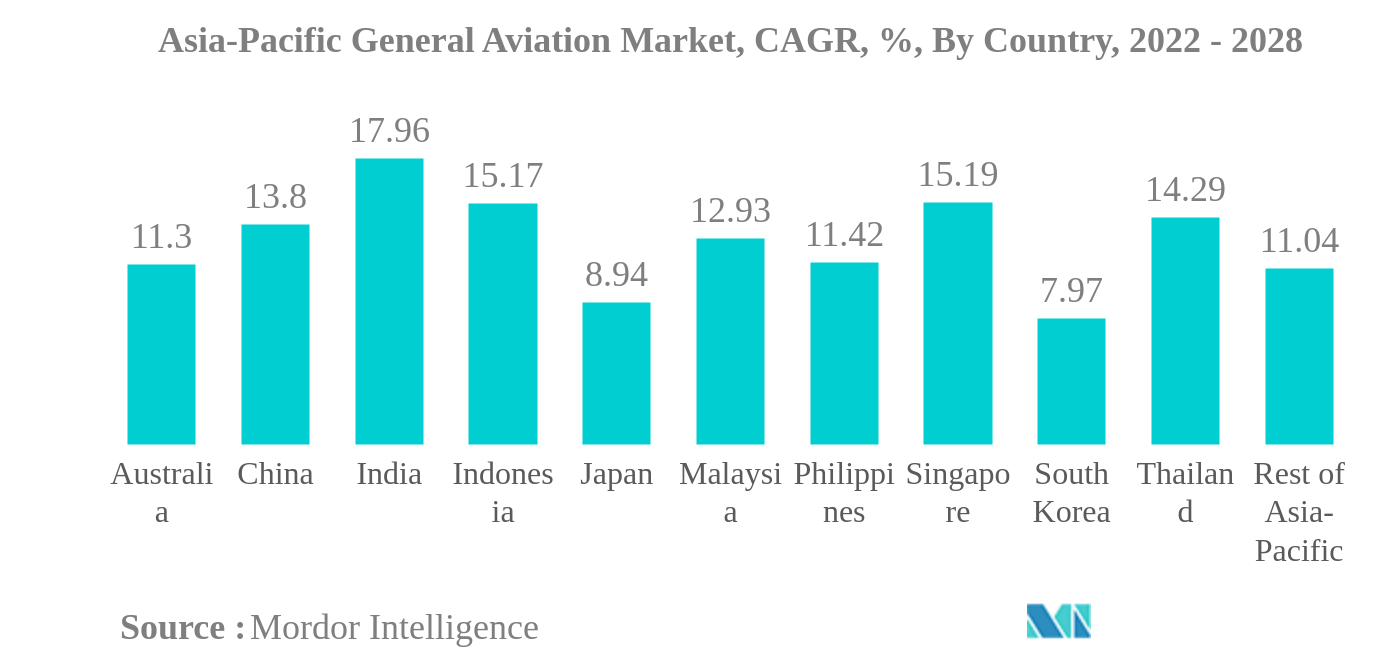
Largest Share by Country | Australia |
Major Players |
||
|
|
||
|
*Disclaimer: Major Players sorted in no particular order |
Asia-Pacific General Aviation Market Analysis
The Asia-Pacific General Aviation Market size is expected to grow from USD 3.98 billion in 2023 to USD 7.10 billion by 2028, at a CAGR of 12.30% during the forecast period (2023-2028).
- Largest Market by Sub-Aircraft Type - Business Jets : An increasing number of HNWIs and UHNWIs in the region are mainly driving the market's growth.
- Largest Market by Body Type - Large Jet : The consumers' preference for large jets across the region is driving the demand. Therefore, manufacturers offer consumers a wide range of products according to their convenience.
- Largest Market by Country - Australia : A large number of helicopters and business jet procurement in the country is anticipated to occupy a major share of the regional general aviation market.
Asia-Pacific General Aviation Market Trends
This section covers the major market trends shaping the Asia-Pacific General Aviation Market according to our research experts:
Business Jets is the largest Sub Aircraft Type
- Asia-Pacific accounted for around 4% of the global business jet deliveries in 2021. Similarly, turboprop and piston aircraft accounted for 13% and 14% of global deliveries.
- The COVID-19 pandemic adversely impacted the general aviation sector in the Asia-Pacific region. Global restrictions on travel and pandemic-induced lockdown affected the demand in the general aviation sector. The deliveries of business jets declined by 47% in 2020 compared to 2019. Similarly, the deliveries of turboprop aircraft declined by 24%, and the helicopters category witnessed a fall of around 59%. However, with the ease of travel restrictions, there is increasing momentum in the number of people traveling and the adoption of private jets.
- The rising number of HNWIs and UHNWIs in the region and their preference for private jets and helicopters for personal or business travel are also helping boost the procurement of private jets in the general aviation sector. For instance, the HNWI population in the region increased from 7.2 million in 2016 to 15.6 million in 2021.
- Bombardier was the leading OEM, with 24% of the current operational fleet size, followed by Gulfstream and Textron, with 21.2% and 20.3%, respectively, in the Asia-Pacific business jet fleet as of July 2022. In terms of current operational fleet size in the business jet category, large jets dominated with a fleet size of 565 aircraft, followed by light jets and mid-size jets with 364 and 133 aircraft, respectively.
Australia is the largest Country
- The overall aircraft deliveries in the general aviation sector were affected during the COVID-19 pandemic, and the growth between 2019 and 2021 was -7.8%. The reduced economic activities in Asia-Pacific, along with travel-related restrictions, affected the utilization and procurement of business jets, helicopters, and turboprop aircraft in the region.
- The rise of HNWIs and UHNWIs, who prefer private jets and helicopters for personal or business travel in Asia-Pacific, aided in the procurement of aircraft in the general aviation sector. From 2016 to 2021, the HNWI population in the region increased by 117%.
- In terms of the current operational fleet, China was the leading country with around 21% of the overall Asia-Pacific business jet fleet, followed by Australia, India, and Japan with around 18%, 13%, and 9% of the deliveries, respectively, as of July 2022. In the helicopter category, Australia was the leading country with around 32% of the overall helicopter fleet, followed by China, Japan, and New Zealand with around 18%, 12%, and 11% of the deliveries, respectively, as of July 2022.
- The helicopter category was dominated by single-engine helicopters, which accounted for 70% of the current operational Asia-Pacific helicopter fleet. The large-scale utilization of single-engine helicopters in corporate aviation aided in the procurement of single-engine helicopters.
- Approximately 1,600 aircraft are expected to be delivered in China during 2022-2028. The economic recovery in the developing economies in the region, such as China and India, is expected to aid the growth of the general aviation sector in Asia-Pacific during the forecast period.
Asia-Pacific General Aviation Industry Overview
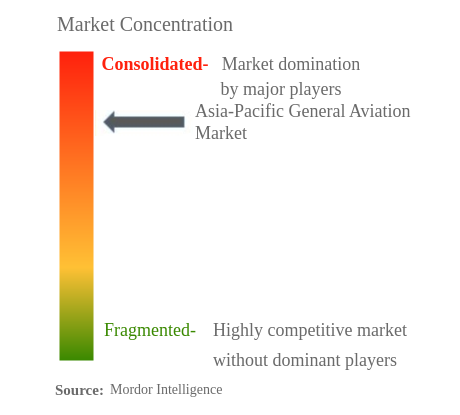
The Asia-Pacific General Aviation Market is fairly consolidated, with the top five companies occupying 70.23%. The major players in this market are Airbus SE, Bombardier Inc., General Dynamics Corporation, Robinson Helicopter Company Inc. and Textron Inc. (sorted alphabetically).
Asia-Pacific General Aviation Market Leaders
Airbus SE
Bombardier Inc.
General Dynamics Corporation
Robinson Helicopter Company Inc.
Textron Inc.
*Disclaimer: Major Players sorted in no particular order
Asia-Pacific General Aviation Market News
- July 2022: In July 2022, the Cessna Citation Longitude Marine Patrol Aircraft was introduced by Textron Aviation Special Missions.
- June 2022: The largest OEM business aviation facility in Asia Pacific, the Bombardier Singapore Service Center, was inaugurated.
- June 2022: The Emergency Rescue Helicopter Service (ERHS) of Western Australia has ordered three Leonardo AW139 intermediate twin-engine helicopters as part of a fleet modernization effort to achieve enhanced airborne capabilities by expanding Leonardo's AW139 fleet. Helicopters will be supplied by leading helicopter operator CHC Australia to the ERHS to conduct HEMS, Search and Rescue, and Inter-Hospital Patient Transport missions from Jandakot and Bunbury Airports.
Asia-Pacific General Aviation Market Report - Table of Contents
1. INTRODUCTION
1.1. Study Assumptions & Market Definition
1.2. Scope of the Study
1.3. Research Methodology
2. KEY INDUSTRY TRENDS
2.1. High-Net-Worth Individual (HNWI)
2.2. Regulatory Framework
2.3. Value Chain Analysis
3. MARKET SEGMENTATION
3.1. Sub Aircraft Type
3.1.1. Business Jets
3.1.1.1. Large Jet
3.1.1.2. Light Jet
3.1.1.3. Mid-Size Jet
3.1.2. Piston Fixed-Wing Aircraft
3.1.3. Others
3.2. Country
3.2.1. Australia
3.2.2. China
3.2.3. India
3.2.4. Indonesia
3.2.5. Japan
3.2.6. Malaysia
3.2.7. Philippines
3.2.8. Singapore
3.2.9. South Korea
3.2.10. Thailand
3.2.11. Rest Of Asia-Pacific
4. COMPETITIVE LANDSCAPE
4.1. Key Strategic Moves
4.2. Market Share Analysis
4.3. Company Landscape
4.4. Company Profiles
4.4.1. Airbus SE
4.4.2. Bombardier Inc.
4.4.3. Cirrus Design Corporation
4.4.4. General Dynamics Corporation
4.4.5. Honda Motor Co., Ltd.
4.4.6. Leonardo S.p.A
4.4.7. MD Helicopters LLC.
4.4.8. Robinson Helicopter Company Inc.
4.4.9. Textron Inc.
5. KEY STRATEGIC QUESTIONS FOR AVIATION CEOS
6. APPENDIX
6.1. Global Overview
6.1.1. Overview
6.1.2. Porter’s Five Forces Framework
6.1.3. Global Value Chain Analysis
6.1.4. Market Dynamics (DROs)
6.2. Sources & References
6.3. List of Tables & Figures
6.4. Primary Insights
6.5. Data Pack
6.6. Glossary of Terms
List of Tables & Figures
- Figure 1:
- ASIA-PACIFIC GENERAL AVIATION MARKET, HIGH-NET-WORTH INDIVIDUAL (HNWI), POPULATION, 2016 – 2028
- Figure 2:
- ASIA-PACIFIC GENERAL AVIATION MARKET, VOLUME, UNITS, 2016 - 2028
- Figure 3:
- ASIA-PACIFIC GENERAL AVIATION MARKET, VALUE, USD, 2016 - 2028
- Figure 4:
- ASIA-PACIFIC GENERAL AVIATION MARKET, BY SUB AIRCRAFT TYPE, VOLUME, UNITS, 2016 - 2028
- Figure 5:
- ASIA-PACIFIC GENERAL AVIATION MARKET, BY SUB AIRCRAFT TYPE, VALUE, USD, 2016 - 2028
- Figure 6:
- ASIA-PACIFIC GENERAL AVIATION MARKET, BY SUB AIRCRAFT TYPE, VOLUME, %, 2016 VS 2022 VS 2028
- Figure 7:
- ASIA-PACIFIC GENERAL AVIATION MARKET, BY SUB AIRCRAFT TYPE, VALUE, %, 2016 VS 2022 VS 2028
- Figure 8:
- ASIA-PACIFIC GENERAL AVIATION MARKET, BY BODY TYPE, VOLUME, UNITS, 2016 - 2028
- Figure 9:
- ASIA-PACIFIC GENERAL AVIATION MARKET, BY BODY TYPE, VALUE, USD, 2016 - 2028
- Figure 10:
- ASIA-PACIFIC GENERAL AVIATION MARKET, BY BODY TYPE, VOLUME, %, 2016 VS 2022 VS 2028
- Figure 11:
- ASIA-PACIFIC GENERAL AVIATION MARKET, BY BODY TYPE, VALUE, %, 2016 VS 2022 VS 2028
- Figure 12:
- ASIA-PACIFIC GENERAL AVIATION MARKET, BY LARGE JET, VOLUME, UNITS, 2016 - 2028
- Figure 13:
- ASIA-PACIFIC GENERAL AVIATION MARKET, BY LARGE JET, VALUE, USD, 2016 - 2028
- Figure 14:
- ASIA-PACIFIC GENERAL AVIATION MARKET, BY LARGE JET, VALUE, %, 2021 VS 2028
- Figure 15:
- ASIA-PACIFIC GENERAL AVIATION MARKET, BY LIGHT JET, VOLUME, UNITS, 2016 - 2028
- Figure 16:
- ASIA-PACIFIC GENERAL AVIATION MARKET, BY LIGHT JET, VALUE, USD, 2016 - 2028
- Figure 17:
- ASIA-PACIFIC GENERAL AVIATION MARKET, BY LIGHT JET, VALUE, %, 2021 VS 2028
- Figure 18:
- ASIA-PACIFIC GENERAL AVIATION MARKET, BY MID-SIZE JET, VOLUME, UNITS, 2016 - 2028
- Figure 19:
- ASIA-PACIFIC GENERAL AVIATION MARKET, BY MID-SIZE JET, VALUE, USD, 2016 - 2028
- Figure 20:
- ASIA-PACIFIC GENERAL AVIATION MARKET, BY MID-SIZE JET, VALUE, %, 2021 VS 2028
- Figure 21:
- ASIA-PACIFIC GENERAL AVIATION MARKET, BY PISTON FIXED-WING AIRCRAFT, VOLUME, UNITS, 2016 - 2028
- Figure 22:
- ASIA-PACIFIC GENERAL AVIATION MARKET, BY PISTON FIXED-WING AIRCRAFT, VALUE, USD, 2016 - 2028
- Figure 23:
- ASIA-PACIFIC GENERAL AVIATION MARKET, BY PISTON FIXED-WING AIRCRAFT, VALUE, %, 2021 VS 2028
- Figure 24:
- ASIA-PACIFIC GENERAL AVIATION MARKET, BY OTHERS, VOLUME, UNITS, 2016 - 2028
- Figure 25:
- ASIA-PACIFIC GENERAL AVIATION MARKET, BY OTHERS, VALUE, USD, 2016 - 2028
- Figure 26:
- ASIA-PACIFIC GENERAL AVIATION MARKET, BY OTHERS, VALUE, %, 2021 VS 2028
- Figure 27:
- ASIA-PACIFIC GENERAL AVIATION MARKET, BY COUNTRY, VOLUME, UNITS, 2016 - 2028
- Figure 28:
- ASIA-PACIFIC GENERAL AVIATION MARKET, BY COUNTRY, VALUE, USD, 2016 - 2028
- Figure 29:
- ASIA-PACIFIC GENERAL AVIATION MARKET, BY COUNTRY, VOLUME, %, 2016 VS 2022 VS 2028
- Figure 30:
- ASIA-PACIFIC GENERAL AVIATION MARKET, BY COUNTRY, VALUE, %, 2016 VS 2022 VS 2028
- Figure 31:
- ASIA-PACIFIC GENERAL AVIATION MARKET, BY AUSTRALIA, VOLUME, UNITS, 2016 - 2028
- Figure 32:
- ASIA-PACIFIC GENERAL AVIATION MARKET, BY AUSTRALIA, VALUE, USD, 2016 - 2028
- Figure 33:
- ASIA-PACIFIC GENERAL AVIATION MARKET, BY AUSTRALIA, VALUE, %, 2021 VS 2028
- Figure 34:
- ASIA-PACIFIC GENERAL AVIATION MARKET, BY CHINA, VOLUME, UNITS, 2016 - 2028
- Figure 35:
- ASIA-PACIFIC GENERAL AVIATION MARKET, BY CHINA, VALUE, USD, 2016 - 2028
- Figure 36:
- ASIA-PACIFIC GENERAL AVIATION MARKET, BY CHINA, VALUE, %, 2021 VS 2028
- Figure 37:
- ASIA-PACIFIC GENERAL AVIATION MARKET, BY INDIA, VOLUME, UNITS, 2016 - 2028
- Figure 38:
- ASIA-PACIFIC GENERAL AVIATION MARKET, BY INDIA, VALUE, USD, 2016 - 2028
- Figure 39:
- ASIA-PACIFIC GENERAL AVIATION MARKET, BY INDIA, VALUE, %, 2021 VS 2028
- Figure 40:
- ASIA-PACIFIC GENERAL AVIATION MARKET, BY INDONESIA, VOLUME, UNITS, 2016 - 2028
- Figure 41:
- ASIA-PACIFIC GENERAL AVIATION MARKET, BY INDONESIA, VALUE, USD, 2016 - 2028
- Figure 42:
- ASIA-PACIFIC GENERAL AVIATION MARKET, BY INDONESIA, VALUE, %, 2021 VS 2028
- Figure 43:
- ASIA-PACIFIC GENERAL AVIATION MARKET, BY JAPAN, VOLUME, UNITS, 2016 - 2028
- Figure 44:
- ASIA-PACIFIC GENERAL AVIATION MARKET, BY JAPAN, VALUE, USD, 2016 - 2028
- Figure 45:
- ASIA-PACIFIC GENERAL AVIATION MARKET, BY JAPAN, VALUE, %, 2021 VS 2028
- Figure 46:
- ASIA-PACIFIC GENERAL AVIATION MARKET, BY MALAYSIA, VOLUME, UNITS, 2016 - 2028
- Figure 47:
- ASIA-PACIFIC GENERAL AVIATION MARKET, BY MALAYSIA, VALUE, USD, 2016 - 2028
- Figure 48:
- ASIA-PACIFIC GENERAL AVIATION MARKET, BY MALAYSIA, VALUE, %, 2021 VS 2028
- Figure 49:
- ASIA-PACIFIC GENERAL AVIATION MARKET, BY PHILIPPINES, VOLUME, UNITS, 2016 - 2028
- Figure 50:
- ASIA-PACIFIC GENERAL AVIATION MARKET, BY PHILIPPINES, VALUE, USD, 2016 - 2028
- Figure 51:
- ASIA-PACIFIC GENERAL AVIATION MARKET, BY PHILIPPINES, VALUE, %, 2021 VS 2028
- Figure 52:
- ASIA-PACIFIC GENERAL AVIATION MARKET, BY SINGAPORE, VOLUME, UNITS, 2016 - 2028
- Figure 53:
- ASIA-PACIFIC GENERAL AVIATION MARKET, BY SINGAPORE, VALUE, USD, 2016 - 2028
- Figure 54:
- ASIA-PACIFIC GENERAL AVIATION MARKET, BY SINGAPORE, VALUE, %, 2021 VS 2028
- Figure 55:
- ASIA-PACIFIC GENERAL AVIATION MARKET, BY SOUTH KOREA, VOLUME, UNITS, 2016 - 2028
- Figure 56:
- ASIA-PACIFIC GENERAL AVIATION MARKET, BY SOUTH KOREA, VALUE, USD, 2016 - 2028
- Figure 57:
- ASIA-PACIFIC GENERAL AVIATION MARKET, BY SOUTH KOREA, VALUE, %, 2021 VS 2028
- Figure 58:
- ASIA-PACIFIC GENERAL AVIATION MARKET, BY THAILAND, VOLUME, UNITS, 2016 - 2028
- Figure 59:
- ASIA-PACIFIC GENERAL AVIATION MARKET, BY THAILAND, VALUE, USD, 2016 - 2028
- Figure 60:
- ASIA-PACIFIC GENERAL AVIATION MARKET, BY THAILAND, VALUE, %, 2021 VS 2028
- Figure 61:
- ASIA-PACIFIC GENERAL AVIATION MARKET, BY REST OF ASIA-PACIFIC, VOLUME, UNITS, 2016 - 2028
- Figure 62:
- ASIA-PACIFIC GENERAL AVIATION MARKET, BY REST OF ASIA-PACIFIC, VALUE, USD, 2016 - 2028
- Figure 63:
- ASIA-PACIFIC GENERAL AVIATION MARKET, BY REST OF ASIA-PACIFIC, VALUE, %, 2021 VS 2028
- Figure 64:
- ASIA-PACIFIC GENERAL AVIATION MARKET, MOST ACTIVE COMPANIES, BY NUMBER OF STRATEGIC MOVES, 2018 - 2021
- Figure 65:
- ASIA-PACIFIC GENERAL AVIATION MARKET, MOST ADOPTED STRATEGIES, 2018 - 2021
- Figure 66:
- ASIA-PACIFIC GENERAL AVIATION MARKET SHARE(%), BY MAJOR PLAYERS, 2021
Asia-Pacific General Aviation Industry Segmentation
Business Jets, Piston Fixed-Wing Aircraft, Others are covered as segments by Sub Aircraft Type. Australia, China, India, Indonesia, Japan, Malaysia, Philippines, Singapore, South Korea, Thailand are covered as segments by Country.| Sub Aircraft Type | |||||
| |||||
| Piston Fixed-Wing Aircraft | |||||
| Others |
| Country | |
| Australia | |
| China | |
| India | |
| Indonesia | |
| Japan | |
| Malaysia | |
| Philippines | |
| Singapore | |
| South Korea | |
| Thailand | |
| Rest Of Asia-Pacific |
Market Definition
- Aircraft Type - General Aviation includes aircraft used for corporate aviation, business aviation and other aerial works.
- Body Type - Light Jets, Mid-Size Jets, and Large Jets according to their ability to carry passengers and flying distance ranges have been included under this study.
- Sub-Aircraft Type - Business Jets, Piston Fixed-Wing Aircraft, and helicopters and turboprop aircraft are taken into consideration.
Research Methodology
Mordor Intelligence follows a four-step methodology in all our reports.
- Step-1: Identify Key Variables: In order to build a robust forecasting methodology, the variables and factors identified in Step-1 are tested against available historical market numbers. Through an iterative process, the variables required for market forecast are set and the model is built on the basis of these variables.
- Step-2: Build a Market Model: Market-size estimations for the historical and forecast years have been provided in revenue and volume terms. For sales conversion to volume, the average selling price (ASP) is kept constant throughout the forecast period for each country, and inflation is not a part of the pricing.
- Step-3: Validate and Finalize: In this important step, all market numbers, variables and analyst calls are validated through an extensive network of primary research experts from the market studied. The respondents are selected across levels and functions to generate a holistic picture of the market studied.
- Step-4: Research Outputs: Syndicated Reports, Custom Consulting Assignments, Databases & Subscription Platforms


