Asia-Pacific Pea Protein Market Size

| Icons | Lable | Value |
|---|---|---|
|
|
Study Period | 2017 - 2029 |
|
|
Base Year For Estimation | 2022 |
|
|
CAGR | 6.49 % |
|
|
Largest Share by End User | Food and Beverages |
|
|
Largest Share by Country | China |
|
|
Market Concentration | High |
Major Players |
||
|
|
||
|
*Disclaimer: Major Players sorted in no particular order |
Asia-Pacific Pea Protein Market Analysis
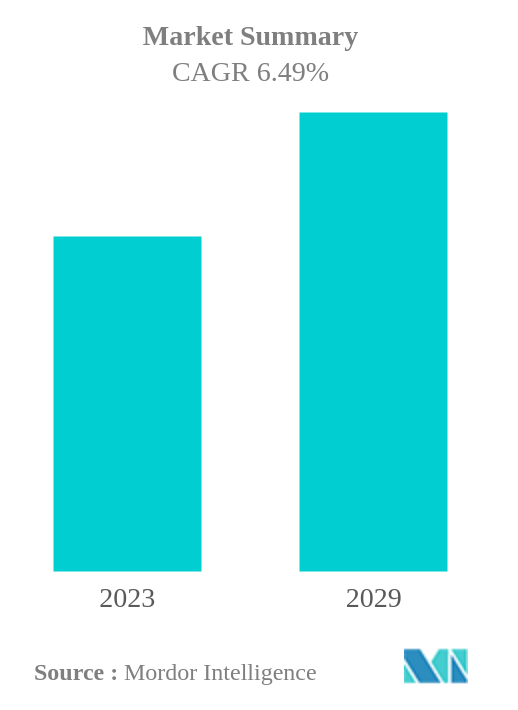
The Asia-Pacific Pea Protein Market is projected to register a CAGR of 6.49%
- Isolates is the Largest Form: Higher protein content and lower carbohydrate content in pea isolates, compared to other forms, have increased their demand, making them the largest segment by form.
- Food and Beverages is the Largest End User: The F&B sector dominates the market with its high demand for pea protein in meat alternative products due to its quick rehydration, neutral taste, and texturizing properties.
- Textured/Hydrolyzed is the Fastest-growing Form: The growing applications of hydrolyzed pea protein in functional beverages, energy bars, supplements, and animal feed are expected to drive the segment during the forecast period.
- Animal Feed is the Fastest-growing End User: In terms of convenience and product formulations, pea protein innovation is gaining traction, mainly in the nutricosmetics category due to its skin hydration properties.
Asia-Pacific Pea Protein Market Trends
This section covers the major market trends shaping the Asia-Pacific Pea Protein Market according to our research experts:
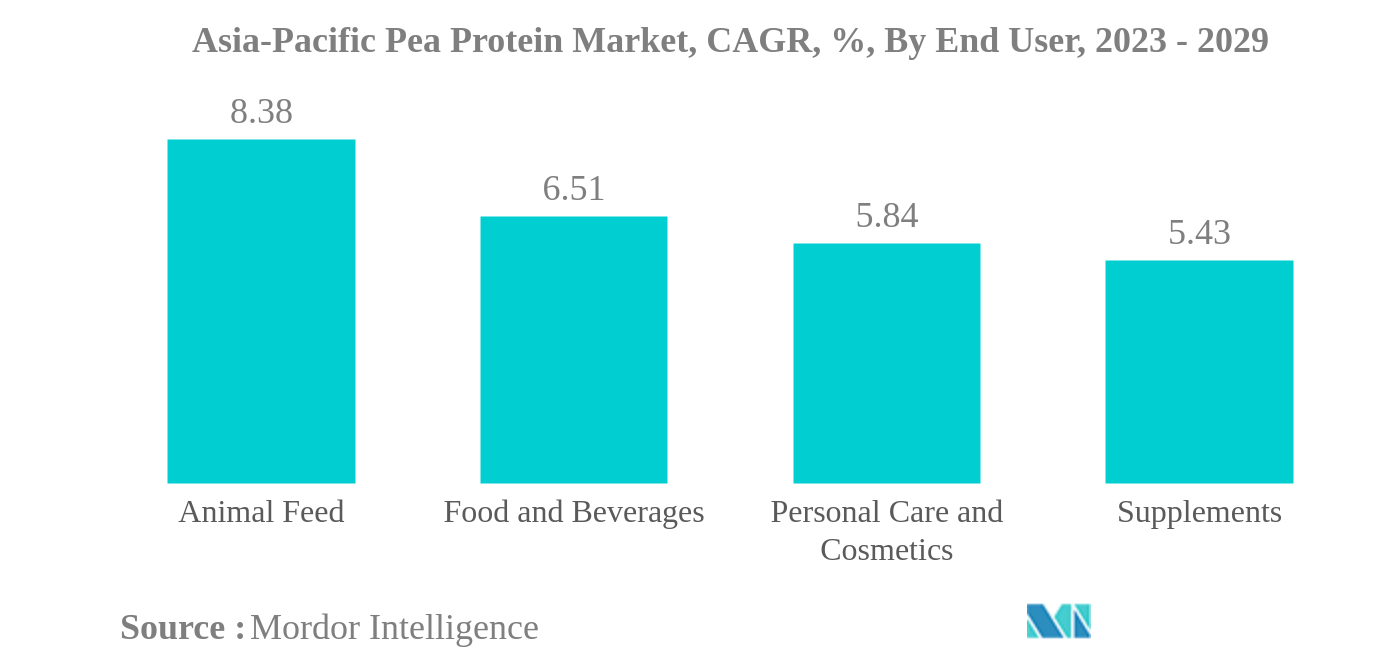
Food and Beverages is the largest End User
- Pea protein demand is highly dominated by the food and beverage segment, which is anticipated to record a CAGR of 6.54%, by volume, during the forecast period. The growth was mainly observed from meat alternative products, which held a share of 69.61% by volume in 2022, and it is anticipated to record a CAGR of 6.85%, by volume, during the forecast period. This increase can be due to its hypoallergenic quality and similar amino acid profile to meat.
- Pea protein is proven to fuel athletic performance by improving strength, increasing lean muscle mass, and optimizing recovery. Protein obtained from peas contains 85% of proteins and is particularly rich in essential branched-chain amino acids (BCAA; leucine, isoleucine, and valine), known to play an important role in muscle protein synthesis. However, in the supplements segment, the sports and nutrition sub-segment is expected to be the fastest growing in China, recording a projected CAGR of 3.60%, by value, during the forecast period.
- The market has also benefited from an increase in the number of households that have pets. In 2020, the region observed an increased number of pets, resulting in an increase in market demand for processed animal feed products. Pea protein has many attractive features, such as being non-GMO, grain-free, hypoallergenic, and sustainable. It is the perfect high-quality vegetable protein source for premium pet food. For example, in 2020, 60,000 pets were added to Japanese households. As a result, the animal feed segment is expected to record the highest CAGR of 8.38% during the forecast period.
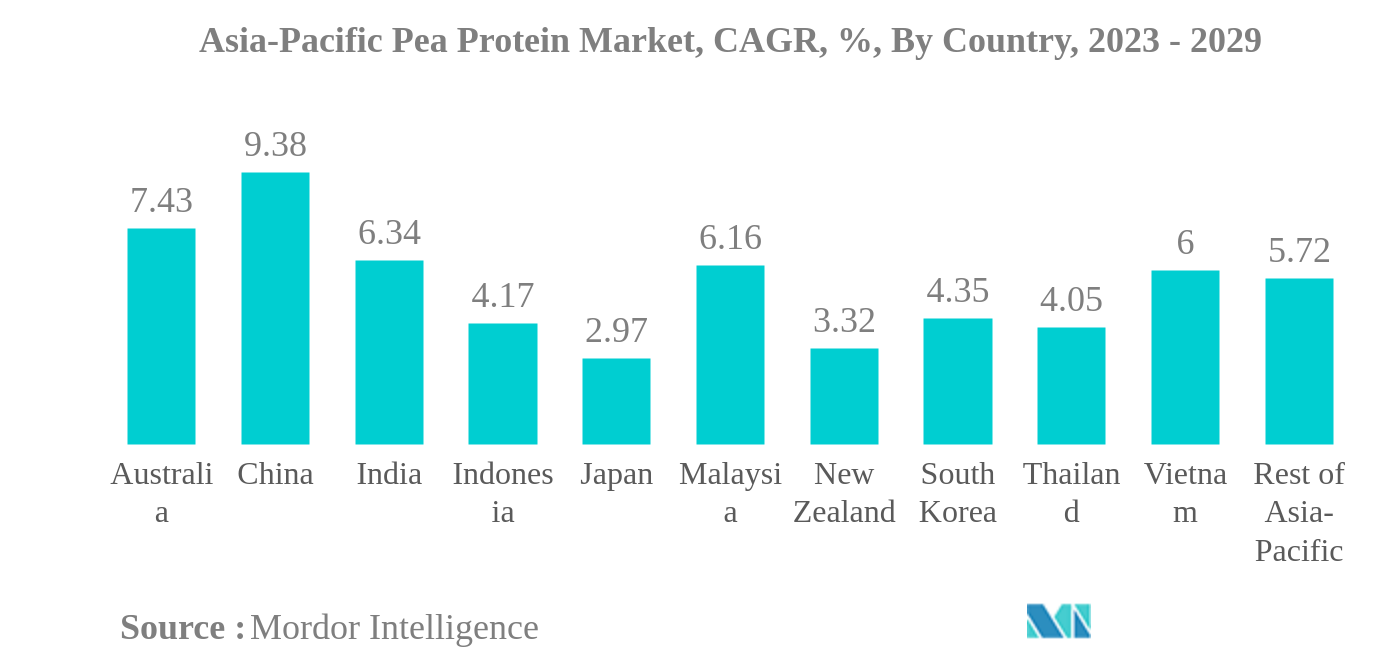
China is the largest Country
- China remained the dominant country in the Asia-Pacific pea protein market. It is also expected to register the fastest CAGR of 9.39%, by volume, during the forecast period. This can be attributed to the country's growing plant-based market and allergen challenges associated with mainstream ingredients, such as soy and wheat proteins. The market also largely benefited from the competitive space in the country. In 2021, the prevalence of food allergy in East China was 11%, and in South China at around 8%.
- Australia is the second-fastest growing country in the pea protein market, as it is projected to register a CAGR of 6.26% by value during the forecast period. Companies are ramping up their production to address the increasing pea protein demand in Australia. This demand growth is due to their anti-dietary variables, such as lower undigested carbohydrate content, higher protein content, and better amino acid digestibility. In 2020, a 46% rise in plant-based, including pea protein sales within Australia, making it an emerging market.
- The Indian pea protein ingredients market was driven by high demand from the F&B sector, recording a CAGR of 6.34% by value during the forecast period. Bakery and snacks are projected to obtain the fastest growth, supported by the surging demand for easy-to-carry healthy food. In the bakery segment, pea protein concentrates produced denser cakes with greater moistness than cakes made with eggs. Cakes made with pea protein scored a 10 for moistness compared with an 8 for cakes made with eggs. Seeking huge growth opportunities has further driven the market segment.
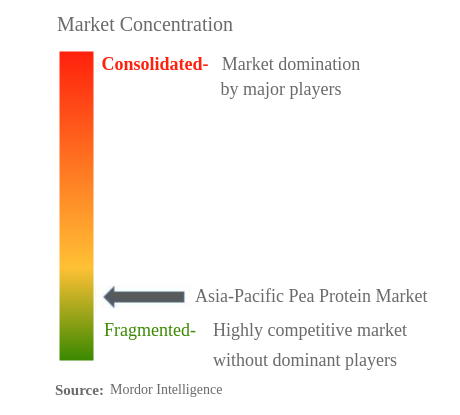
Asia-Pacific Pea Protein Industry Overview
The Asia-Pacific Pea Protein Market is fragmented, with the top five companies occupying 18.27%. The major players in this market are Archer Daniels Midland Company, Ingredion Incorporated, International Flavors & Fragrances Inc., Kerry Group PLC and Yantai Shuangta Food Co. Ltd (sorted alphabetically).
Asia-Pacific Pea Protein Market Leaders
Archer Daniels Midland Company
Ingredion Incorporated
International Flavors & Fragrances Inc.
Kerry Group PLC
Yantai Shuangta Food Co. Ltd
*Disclaimer: Major Players sorted in no particular order
Asia-Pacific Pea Protein Market News
- June 2022: Roquette, a global player in plant-based ingredients and a pioneer in plant proteins, announced the launch of its new NUTRALYS® range of organic textured proteins derived from peas and fava for the European markets.
- November 2021: Roquette marked the opening of a new pea protein facility in Portage la Prairie. According to Roquette, which produces the Nutralys brand pea protein, the 200,000-square-foot facility is the world's largest pea protein plant. The factory has a capacity of 125,000 tons of yellow peas per year.
- February 2021: DuPont's Nutrition & Biosciences and the ingredient company IFF announced their merger in 2021. The combined company will continue to operate under the name IFF. The complementary portfolios give the company leadership positions within a range of ingredients, including pea protein.
Asia-Pacific Pea Protein Market Report - Table of Contents
EXECUTIVE SUMMARY & KEY FINDINGS
1. INTRODUCTION
1.1. Study Assumptions & Market Definition
1.2. Scope of the Study
1.3. Research Methodology
2. KEY INDUSTRY TRENDS
2.1. End User Market Volume
2.2. Protein Consumption Trends
2.3. Production Trends
2.4. Regulatory Framework
2.5. Value Chain & Distribution Channel Analysis
3. MARKET SEGMENTATION
3.1. Form
3.1.1. Concentrates
3.1.2. Isolates
3.1.3. Textured/Hydrolyzed
3.2. End User
3.2.1. Animal Feed
3.2.2. Food and Beverages
3.2.2.1. By Sub End User
3.2.2.1.1. Bakery
3.2.2.1.2. Beverages
3.2.2.1.3. Breakfast Cereals
3.2.2.1.4. Condiments/Sauces
3.2.2.1.5. Confectionery
3.2.2.1.6. Dairy and Dairy Alternative Products
3.2.2.1.7. Meat/Poultry/Seafood and Meat Alternative Products
3.2.2.1.8. RTE/RTC Food Products
3.2.2.1.9. Snacks
3.2.3. Personal Care and Cosmetics
3.2.4. Supplements
3.2.4.1. By Sub End User
3.2.4.1.1. Baby Food and Infant Formula
3.2.4.1.2. Elderly Nutrition and Medical Nutrition
3.2.4.1.3. Sport/Performance Nutrition
3.3. Country
3.3.1. Australia
3.3.2. China
3.3.3. India
3.3.4. Indonesia
3.3.5. Japan
3.3.6. Malaysia
3.3.7. New Zealand
3.3.8. South Korea
3.3.9. Thailand
3.3.10. Vietnam
3.3.11. Rest of Asia-Pacific
4. COMPETITIVE LANDSCAPE
4.1. Key Strategic Moves
4.2. Market Share Analysis
4.3. Company Landscape
4.4. Company Profiles
4.4.1. Archer Daniels Midland Company
4.4.2. Cargill, Incorporated
4.4.3. Foodchem International Corporation
4.4.4. Ingredion Incorporated
4.4.5. International Flavors & Fragrances Inc.
4.4.6. Kerry Group PLC
4.4.7. Roquette Frères
4.4.8. Shandong Jianyuan Bioengineering Co. Ltd
4.4.9. Yantai Shuangta Food Co. Ltd
5. KEY STRATEGIC QUESTIONS FOR PROTEIN INGREDIENTS INDUSTRY CEOS
6. APPENDIX
6.1. Global Overview
6.1.1. Overview
6.1.2. Porter’s Five Forces Framework
6.1.3. Global Value Chain Analysis
6.1.4. Market Dynamics (DROs)
6.2. Sources & References
6.3. List of Tables & Figures
6.4. Primary Insights
6.5. Data Pack
6.6. Glossary of Terms
List of Tables & Figures
- Figure 1:
- ASIA-PACIFIC BABY FOOD AND INFANT FORMULA MARKET, VOLUME IN METRIC TONNES, 2017 - 2029
- Figure 2:
- ASIA-PACIFIC BAKERY MARKET, VOLUME IN METRIC TONNES, 2017 - 2029
- Figure 3:
- ASIA-PACIFIC BEVERAGES MARKET, VOLUME IN METRIC TONNES, 2017 - 2029
- Figure 4:
- ASIA-PACIFIC BREAKFAST CEREALS MARKET, VOLUME IN METRIC TONNES, 2017 - 2029
- Figure 5:
- ASIA-PACIFIC CONDIMENTS/SAUCES MARKET, VOLUME IN METRIC TONNES, 2017 - 2029
- Figure 6:
- ASIA-PACIFIC CONFECTIONERY MARKET, VOLUME IN METRIC TONNES, 2017 - 2029
- Figure 7:
- ASIA-PACIFIC DAIRY AND DAIRY ALTERNATIVE PRODUCTS MARKET, VOLUME IN METRIC TONNES, 2017 - 2029
- Figure 8:
- ASIA-PACIFIC ELDERLY NUTRITION AND MEDICAL NUTRITION MARKET, VOLUME IN METRIC TONNES, 2017 - 2029
- Figure 9:
- ASIA-PACIFIC MEAT/POULTRY/SEAFOOD AND MEAT ALTERNATIVE PRODUCTS MARKET, VOLUME IN METRIC TONNES, 2017 - 2029
- Figure 10:
- ASIA-PACIFIC RTE/RTC FOOD PRODUCTS MARKET, VOLUME IN METRIC TONNES, 2017 - 2029
- Figure 11:
- ASIA-PACIFIC SNACKS MARKET, VOLUME IN METRIC TONNES, 2017 - 2029
- Figure 12:
- ASIA-PACIFIC SPORT/PERFORMANCE NUTRITION MARKET, VOLUME IN METRIC TONNES, 2017 - 2029
- Figure 13:
- ASIA-PACIFIC ANIMAL FEED MARKET, VOLUME IN METRIC TONNES, 2017 - 2029
- Figure 14:
- ASIA-PACIFIC PERSONAL CARE AND COSMETICS MARKET, VOLUME IN METRIC TONNES, 2017 - 2029
- Figure 15:
- ASIA-PACIFIC PER CAPITA CONSUMPTION OF PLANT PROTEIN, IN GRAM, 2017 - 2029
- Figure 16:
- ASIA-PACIFIC PEA PRODUCTION, IN METRIC TONNES, 2017 - 2021
- Figure 17:
- ASIA-PACIFIC PEA PROTEIN MARKET, 2015-2026
- Figure 18:
- ASIA-PACIFIC PEA PROTEIN MARKET, 2015-2026
- Figure 19:
- ASIA-PACIFIC PEA PROTEIN MARKET, VOLUME IN METRIC TONNES, BY FORM, 2017 - 2029
- Figure 20:
- ASIA-PACIFIC PEA PROTEIN MARKET, VALUE IN USD, BY FORM, 2017 - 2029
- Figure 21:
- ASIA-PACIFIC PEA PROTEIN MARKET, VALUE SHARE (%), BY FORM, 2017 VS 2023 VS 2029
- Figure 22:
- ASIA-PACIFIC PEA PROTEIN MARKET, VOLUME SHARE (%), BY FORM, 2017 VS 2023 VS 2029
- Figure 23:
- ASIA-PACIFIC PEA PROTEIN MARKET, VOLUME IN METRIC TONNES, CONCENTRATES, 2017 - 2029
- Figure 24:
- ASIA-PACIFIC PEA PROTEIN MARKET, VALUE IN USD, CONCENTRATES, 2017 - 2029
- Figure 25:
- ASIA-PACIFIC PEA PROTEIN MARKET, CONCENTRATES, VALUE SHARE (%), BY END USER, 2022 VS 2029
- Figure 26:
- ASIA-PACIFIC PEA PROTEIN MARKET, VOLUME IN METRIC TONNES, ISOLATES, 2017 - 2029
- Figure 27:
- ASIA-PACIFIC PEA PROTEIN MARKET, VALUE IN USD, ISOLATES, 2017 - 2029
- Figure 28:
- ASIA-PACIFIC PEA PROTEIN MARKET, ISOLATES, VALUE SHARE (%), BY END USER, 2022 VS 2029
- Figure 29:
- ASIA-PACIFIC PEA PROTEIN MARKET, VOLUME IN METRIC TONNES, TEXTURED/HYDROLYZED, 2017 - 2029
- Figure 30:
- ASIA-PACIFIC PEA PROTEIN MARKET, VALUE IN USD, TEXTURED/HYDROLYZED, 2017 - 2029
- Figure 31:
- ASIA-PACIFIC PEA PROTEIN MARKET, TEXTURED/HYDROLYZED, VALUE SHARE (%), BY END USER, 2022 VS 2029
- Figure 32:
- ASIA-PACIFIC PEA PROTEIN MARKET, VOLUME IN METRIC TONNES, BY END USER, 2017 - 2029
- Figure 33:
- ASIA-PACIFIC PEA PROTEIN MARKET, VALUE IN USD, BY END USER, 2017 - 2029
- Figure 34:
- ASIA-PACIFIC PEA PROTEIN MARKET, VALUE SHARE (%), BY END USER, 2017 VS 2023 VS 2029
- Figure 35:
- ASIA-PACIFIC PEA PROTEIN MARKET, VOLUME SHARE (%), BY END USER, 2017 VS 2023 VS 2029
- Figure 36:
- ASIA-PACIFIC PEA PROTEIN MARKET, VOLUME IN METRIC TONNES, ANIMAL FEED, 2017 - 2029
- Figure 37:
- ASIA-PACIFIC PEA PROTEIN MARKET, VALUE IN USD, ANIMAL FEED, 2017 - 2029
- Figure 38:
- ASIA-PACIFIC PEA PROTEIN MARKET, ANIMAL FEED, VALUE SHARE (%), BY FORM, 2022 VS 2029
- Figure 39:
- ASIA-PACIFIC PEA PROTEIN MARKET, VOLUME IN METRIC TONNES, BY SUB END USER, 2017 - 2029
- Figure 40:
- ASIA-PACIFIC PEA PROTEIN MARKET, VALUE IN USD, BY SUB END USER, 2017 - 2029
- Figure 41:
- ASIA-PACIFIC PEA PROTEIN MARKET, VALUE SHARE (%), BY SUB END USER, 2017 VS 2023 VS 2029
- Figure 42:
- ASIA-PACIFIC PEA PROTEIN MARKET, VOLUME SHARE (%), BY SUB END USER, 2017 VS 2023 VS 2029
- Figure 43:
- ASIA-PACIFIC PEA PROTEIN MARKET, VOLUME IN METRIC TONNES, BAKERY, 2017 - 2029
- Figure 44:
- ASIA-PACIFIC PEA PROTEIN MARKET, VALUE IN USD, BAKERY, 2017 - 2029
- Figure 45:
- ASIA-PACIFIC PEA PROTEIN MARKET, BAKERY, VALUE SHARE (%), BY FORM, 2022 VS 2029
- Figure 46:
- ASIA-PACIFIC PEA PROTEIN MARKET, VOLUME IN METRIC TONNES, BEVERAGES, 2017 - 2029
- Figure 47:
- ASIA-PACIFIC PEA PROTEIN MARKET, VALUE IN USD, BEVERAGES, 2017 - 2029
- Figure 48:
- ASIA-PACIFIC PEA PROTEIN MARKET, BEVERAGES, VALUE SHARE (%), BY FORM, 2022 VS 2029
- Figure 49:
- ASIA-PACIFIC PEA PROTEIN MARKET, VOLUME IN METRIC TONNES, BREAKFAST CEREALS, 2017 - 2029
- Figure 50:
- ASIA-PACIFIC PEA PROTEIN MARKET, VALUE IN USD, BREAKFAST CEREALS, 2017 - 2029
- Figure 51:
- ASIA-PACIFIC PEA PROTEIN MARKET, BREAKFAST CEREALS, VALUE SHARE (%), BY FORM, 2022 VS 2029
- Figure 52:
- ASIA-PACIFIC PEA PROTEIN MARKET, VOLUME IN METRIC TONNES, CONDIMENTS/SAUCES, 2017 - 2029
- Figure 53:
- ASIA-PACIFIC PEA PROTEIN MARKET, VALUE IN USD, CONDIMENTS/SAUCES, 2017 - 2029
- Figure 54:
- ASIA-PACIFIC PEA PROTEIN MARKET, CONDIMENTS/SAUCES, VALUE SHARE (%), BY FORM, 2022 VS 2029
- Figure 55:
- ASIA-PACIFIC PEA PROTEIN MARKET, VOLUME IN METRIC TONNES, CONFECTIONERY, 2017 - 2029
- Figure 56:
- ASIA-PACIFIC PEA PROTEIN MARKET, VALUE IN USD, CONFECTIONERY, 2017 - 2029
- Figure 57:
- ASIA-PACIFIC PEA PROTEIN MARKET, CONFECTIONERY, VALUE SHARE (%), BY FORM, 2022 VS 2029
- Figure 58:
- ASIA-PACIFIC PEA PROTEIN MARKET, VOLUME IN METRIC TONNES, DAIRY AND DAIRY ALTERNATIVE PRODUCTS, 2017 - 2029
- Figure 59:
- ASIA-PACIFIC PEA PROTEIN MARKET, VALUE IN USD, DAIRY AND DAIRY ALTERNATIVE PRODUCTS, 2017 - 2029
- Figure 60:
- ASIA-PACIFIC PEA PROTEIN MARKET, DAIRY AND DAIRY ALTERNATIVE PRODUCTS, VALUE SHARE (%), BY FORM, 2022 VS 2029
- Figure 61:
- ASIA-PACIFIC PEA PROTEIN MARKET, VOLUME IN METRIC TONNES, MEAT/POULTRY/SEAFOOD AND MEAT ALTERNATIVE PRODUCTS, 2017 - 2029
- Figure 62:
- ASIA-PACIFIC PEA PROTEIN MARKET, VALUE IN USD, MEAT/POULTRY/SEAFOOD AND MEAT ALTERNATIVE PRODUCTS, 2017 - 2029
- Figure 63:
- ASIA-PACIFIC PEA PROTEIN MARKET, MEAT/POULTRY/SEAFOOD AND MEAT ALTERNATIVE PRODUCTS, VALUE SHARE (%), BY FORM, 2022 VS 2029
- Figure 64:
- ASIA-PACIFIC PEA PROTEIN MARKET, VOLUME IN METRIC TONNES, RTE/RTC FOOD PRODUCTS, 2017 - 2029
- Figure 65:
- ASIA-PACIFIC PEA PROTEIN MARKET, VALUE IN USD, RTE/RTC FOOD PRODUCTS, 2017 - 2029
- Figure 66:
- ASIA-PACIFIC PEA PROTEIN MARKET, RTE/RTC FOOD PRODUCTS, VALUE SHARE (%), BY FORM, 2022 VS 2029
- Figure 67:
- ASIA-PACIFIC PEA PROTEIN MARKET, VOLUME IN METRIC TONNES, SNACKS, 2017 - 2029
- Figure 68:
- ASIA-PACIFIC PEA PROTEIN MARKET, VALUE IN USD, SNACKS, 2017 - 2029
- Figure 69:
- ASIA-PACIFIC PEA PROTEIN MARKET, SNACKS, VALUE SHARE (%), BY FORM, 2022 VS 2029
- Figure 70:
- ASIA-PACIFIC PEA PROTEIN MARKET, VOLUME IN METRIC TONNES, PERSONAL CARE AND COSMETICS, 2017 - 2029
- Figure 71:
- ASIA-PACIFIC PEA PROTEIN MARKET, VALUE IN USD, PERSONAL CARE AND COSMETICS, 2017 - 2029
- Figure 72:
- ASIA-PACIFIC PEA PROTEIN MARKET, PERSONAL CARE AND COSMETICS, VALUE SHARE (%), BY FORM, 2022 VS 2029
- Figure 73:
- ASIA-PACIFIC PEA PROTEIN MARKET, VOLUME IN METRIC TONNES, BY SUB END USER, 2017 - 2029
- Figure 74:
- ASIA-PACIFIC PEA PROTEIN MARKET, VALUE IN USD, BY SUB END USER, 2017 - 2029
- Figure 75:
- ASIA-PACIFIC PEA PROTEIN MARKET, VALUE SHARE (%), BY SUB END USER, 2017 VS 2023 VS 2029
- Figure 76:
- ASIA-PACIFIC PEA PROTEIN MARKET, VOLUME SHARE (%), BY SUB END USER, 2017 VS 2023 VS 2029
- Figure 77:
- ASIA-PACIFIC PEA PROTEIN MARKET, VOLUME IN METRIC TONNES, BABY FOOD AND INFANT FORMULA, 2017 - 2029
- Figure 78:
- ASIA-PACIFIC PEA PROTEIN MARKET, VALUE IN USD, BABY FOOD AND INFANT FORMULA, 2017 - 2029
- Figure 79:
- ASIA-PACIFIC PEA PROTEIN MARKET, BABY FOOD AND INFANT FORMULA, VALUE SHARE (%), BY FORM, 2022 VS 2029
- Figure 80:
- ASIA-PACIFIC PEA PROTEIN MARKET, VOLUME IN METRIC TONNES, ELDERLY NUTRITION AND MEDICAL NUTRITION, 2017 - 2029
- Figure 81:
- ASIA-PACIFIC PEA PROTEIN MARKET, VALUE IN USD, ELDERLY NUTRITION AND MEDICAL NUTRITION, 2017 - 2029
- Figure 82:
- ASIA-PACIFIC PEA PROTEIN MARKET, ELDERLY NUTRITION AND MEDICAL NUTRITION, VALUE SHARE (%), BY FORM, 2022 VS 2029
- Figure 83:
- ASIA-PACIFIC PEA PROTEIN MARKET, VOLUME IN METRIC TONNES, SPORT/PERFORMANCE NUTRITION, 2017 - 2029
- Figure 84:
- ASIA-PACIFIC PEA PROTEIN MARKET, VALUE IN USD, SPORT/PERFORMANCE NUTRITION, 2017 - 2029
- Figure 85:
- ASIA-PACIFIC PEA PROTEIN MARKET, SPORT/PERFORMANCE NUTRITION, VALUE SHARE (%), BY FORM, 2022 VS 2029
- Figure 86:
- ASIA-PACIFIC PEA PROTEIN MARKET, VOLUME IN METRIC TONNES, BY COUNTRY, 2017 - 2029
- Figure 87:
- ASIA-PACIFIC PEA PROTEIN MARKET, VALUE IN USD, BY COUNTRY, 2017 - 2029
- Figure 88:
- ASIA-PACIFIC PEA PROTEIN MARKET, VALUE SHARE (%), BY COUNTRY, 2017 VS 2023 VS 2029
- Figure 89:
- ASIA-PACIFIC PEA PROTEIN MARKET, VOLUME SHARE (%), BY COUNTRY, 2017 VS 2023 VS 2029
- Figure 90:
- ASIA-PACIFIC PEA PROTEIN MARKET, VOLUME IN METRIC TONNES, AUSTRALIA, 2017 - 2029
- Figure 91:
- ASIA-PACIFIC PEA PROTEIN MARKET, VALUE IN USD, AUSTRALIA, 2017 - 2029
- Figure 92:
- ASIA-PACIFIC PEA PROTEIN MARKET, VALUE SHARE (%), AUSTRALIA, BY END USER, 2022 VS 2029
- Figure 93:
- ASIA-PACIFIC PEA PROTEIN MARKET, VOLUME IN METRIC TONNES, CHINA, 2017 - 2029
- Figure 94:
- ASIA-PACIFIC PEA PROTEIN MARKET, VALUE IN USD, CHINA, 2017 - 2029
- Figure 95:
- ASIA-PACIFIC PEA PROTEIN MARKET, VALUE SHARE (%), CHINA, BY END USER, 2022 VS 2029
- Figure 96:
- ASIA-PACIFIC PEA PROTEIN MARKET, VOLUME IN METRIC TONNES, INDIA, 2017 - 2029
- Figure 97:
- ASIA-PACIFIC PEA PROTEIN MARKET, VALUE IN USD, INDIA, 2017 - 2029
- Figure 98:
- ASIA-PACIFIC PEA PROTEIN MARKET, VALUE SHARE (%), INDIA, BY END USER, 2022 VS 2029
- Figure 99:
- ASIA-PACIFIC PEA PROTEIN MARKET, VOLUME IN METRIC TONNES, INDONESIA, 2017 - 2029
- Figure 100:
- ASIA-PACIFIC PEA PROTEIN MARKET, VALUE IN USD, INDONESIA, 2017 - 2029
- Figure 101:
- ASIA-PACIFIC PEA PROTEIN MARKET, VALUE SHARE (%), INDONESIA, BY END USER, 2022 VS 2029
- Figure 102:
- ASIA-PACIFIC PEA PROTEIN MARKET, VOLUME IN METRIC TONNES, JAPAN, 2017 - 2029
- Figure 103:
- ASIA-PACIFIC PEA PROTEIN MARKET, VALUE IN USD, JAPAN, 2017 - 2029
- Figure 104:
- ASIA-PACIFIC PEA PROTEIN MARKET, VALUE SHARE (%), JAPAN, BY END USER, 2022 VS 2029
- Figure 105:
- ASIA-PACIFIC PEA PROTEIN MARKET, VOLUME IN METRIC TONNES, MALAYSIA, 2017 - 2029
- Figure 106:
- ASIA-PACIFIC PEA PROTEIN MARKET, VALUE IN USD, MALAYSIA, 2017 - 2029
- Figure 107:
- ASIA-PACIFIC PEA PROTEIN MARKET, VALUE SHARE (%), MALAYSIA, BY END USER, 2022 VS 2029
- Figure 108:
- ASIA-PACIFIC PEA PROTEIN MARKET, VOLUME IN METRIC TONNES, NEW ZEALAND, 2017 - 2029
- Figure 109:
- ASIA-PACIFIC PEA PROTEIN MARKET, VALUE IN USD, NEW ZEALAND, 2017 - 2029
- Figure 110:
- ASIA-PACIFIC PEA PROTEIN MARKET, VALUE SHARE (%), NEW ZEALAND, BY END USER, 2022 VS 2029
- Figure 111:
- ASIA-PACIFIC PEA PROTEIN MARKET, VOLUME IN METRIC TONNES, SOUTH KOREA, 2017 - 2029
- Figure 112:
- ASIA-PACIFIC PEA PROTEIN MARKET, VALUE IN USD, SOUTH KOREA, 2017 - 2029
- Figure 113:
- ASIA-PACIFIC PEA PROTEIN MARKET, VALUE SHARE (%), SOUTH KOREA, BY END USER, 2022 VS 2029
- Figure 114:
- ASIA-PACIFIC PEA PROTEIN MARKET, VOLUME IN METRIC TONNES, THAILAND, 2017 - 2029
- Figure 115:
- ASIA-PACIFIC PEA PROTEIN MARKET, VALUE IN USD, THAILAND, 2017 - 2029
- Figure 116:
- ASIA-PACIFIC PEA PROTEIN MARKET, VALUE SHARE (%), THAILAND, BY END USER, 2022 VS 2029
- Figure 117:
- ASIA-PACIFIC PEA PROTEIN MARKET, VOLUME IN METRIC TONNES, VIETNAM, 2017 - 2029
- Figure 118:
- ASIA-PACIFIC PEA PROTEIN MARKET, VALUE IN USD, VIETNAM, 2017 - 2029
- Figure 119:
- ASIA-PACIFIC PEA PROTEIN MARKET, VALUE SHARE (%), VIETNAM, BY END USER, 2022 VS 2029
- Figure 120:
- ASIA-PACIFIC PEA PROTEIN MARKET, VOLUME IN METRIC TONNES, REST OF ASIA-PACIFIC, 2017 - 2029
- Figure 121:
- ASIA-PACIFIC PEA PROTEIN MARKET, VALUE IN USD, REST OF ASIA-PACIFIC, 2017 - 2029
- Figure 122:
- ASIA-PACIFIC PEA PROTEIN MARKET, VALUE SHARE (%), REST OF ASIA-PACIFIC, BY END USER, 2022 VS 2029
- Figure 123:
- ASIA-PACIFIC PEA PROTEIN MARKET, MOST ACTIVE COMPANIES, BY NUMBER OF STRATEGIC MOVES, 2017 - 2022
- Figure 124:
- ASIA-PACIFIC PEA PROTEIN MARKET, TOTAL NUMBER OF STRATEGIC MOVES, 2017 - 2022
- Figure 125:
- ASIA-PACIFIC PEA PROTEIN MARKET SHARE(%), BY KEY PLAYERS, 2021
Asia-Pacific Pea Protein Industry Segmentation
Concentrates, Isolates, Textured/Hydrolyzed are covered as segments by Form. Animal Feed, Food and Beverages, Personal Care and Cosmetics, Supplements are covered as segments by End User. Australia, China, India, Indonesia, Japan, Malaysia, New Zealand, South Korea, Thailand, Vietnam are covered as segments by Country.| Form | |
| Concentrates | |
| Isolates | |
| Textured/Hydrolyzed |
| End User | |||||||||||||
| Animal Feed | |||||||||||||
| |||||||||||||
| Personal Care and Cosmetics | |||||||||||||
|
| Country | |
| Australia | |
| China | |
| India | |
| Indonesia | |
| Japan | |
| Malaysia | |
| New Zealand | |
| South Korea | |
| Thailand | |
| Vietnam | |
| Rest of Asia-Pacific |
Market Definition
- End User - The Protein Ingredients Market operates on a B2B basis. Food, Beverages, Supplements, Animal Feed, and Personal Care & Cosmetic manufacturers are considered to be end-consumers in the market studied. The scope excludes manufacturers buying liquid/dry whey to be used for application as a binding agent or thickener or other non-protein applications.
- Penetration Rate - Penetration Rate is defined as the percentage of Protein-Fortified End User Market Volume in the Overall End User Market Volume.
- Average Protein Content - It is the average protein content present in per 100 g of product manufactured by all end-user companies considered under the scope of this report.
Research Methodology
Mordor Intelligence follows a four-step methodology in all our reports.
- Step-1: Identify Key Variables: The quantifiable key variables (industry and extraneous) pertaining to the specific product segment and country are selected from a group of relevant variables & factors based on desk research & literature review; along with primary expert inputs. These variables are further confirmed through regression modeling (wherever required).
- Step-2: Build a Market Model: In order to build a robust forecasting methodology, the variables and factors identified in Step-1 are tested against available historical market numbers. Through an iterative process, the variables required for market forecast are set and the model is built on the basis of these variables.
- Step-3: Validate and Finalize: In this important step, all market numbers, variables and analyst calls are validated through an extensive network of primary research experts from the market studied. The respondents are selected across levels and functions to generate a holistic picture of the market studied.
- Step-4: Research Outputs: Syndicated Reports, Custom Consulting Assignments, Databases & Subscription Platforms


