Asia-Pacific Polyurethane Adhesives Market Size

| Icons | Lable | Value |
|---|---|---|
|
|
Study Period | 2017 - 2028 |
|
|
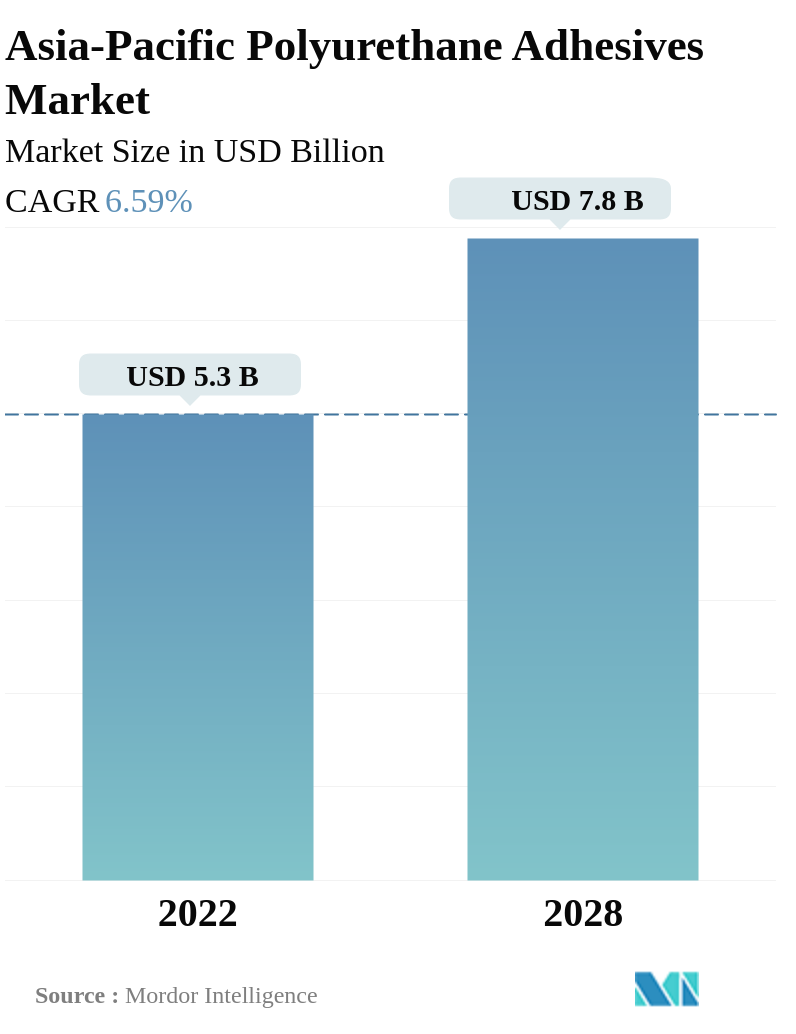
Market Size (2028) | USD 7.8 Billion |
|
|
Market Size (2022) | USD 5.3 Billion |
|
|
Largest Share by End User Industry | Packaging |
|
|
CAGR (2022 - 2028) | 6.59 % |
|
|
Largest Share by Country | China |
Major Players |
||
|
|
||
|
*Disclaimer: Major Players sorted in no particular order |
Asia-Pacific Polyurethane Adhesives Market Analysis
The Asia-Pacific Polyurethane Adhesives Market is projected to register a CAGR of 6.59%
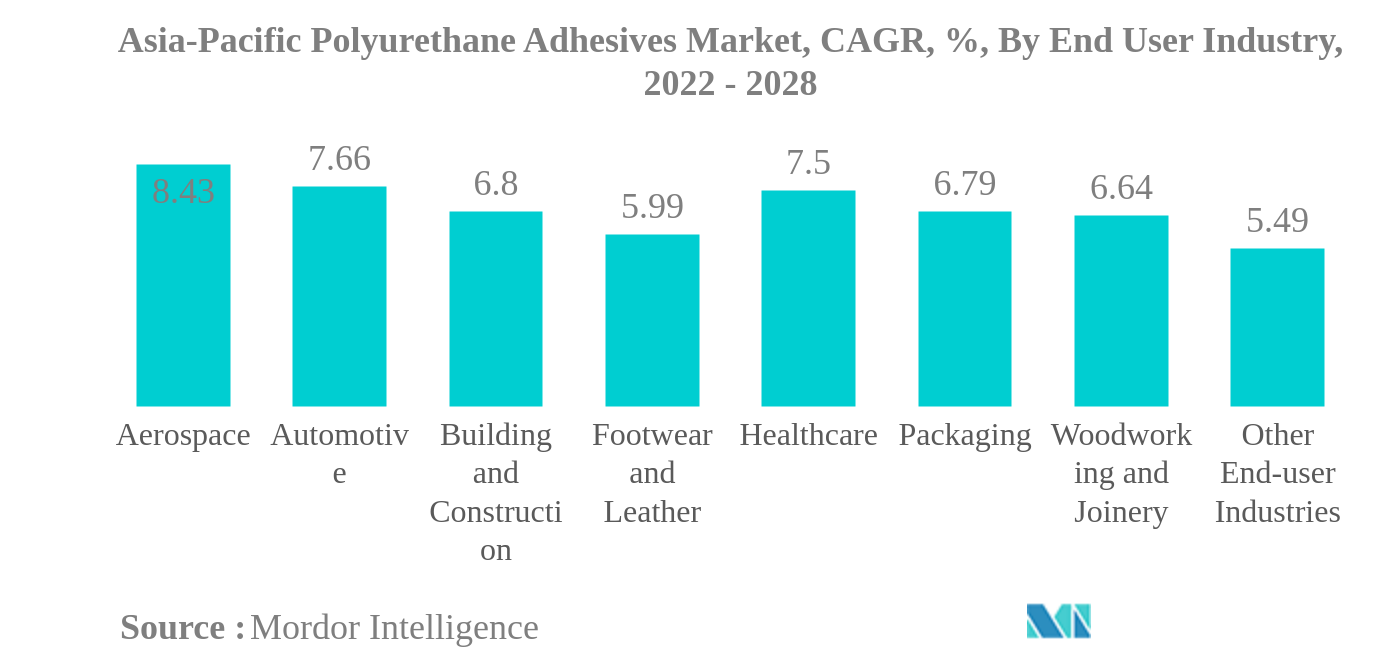
- Packaging is the Largest End User Industry. Packaging is the dominant end-user industry in the market owing to adhesives widespread usage in laminating applications for flexible food packaging.
- Hot Melt is the Largest Technology. Hot melt is the largest technology type in the market owing to its wide range of applications across major end-user industries, including packaging, healthcare, automotive, and building and construction.
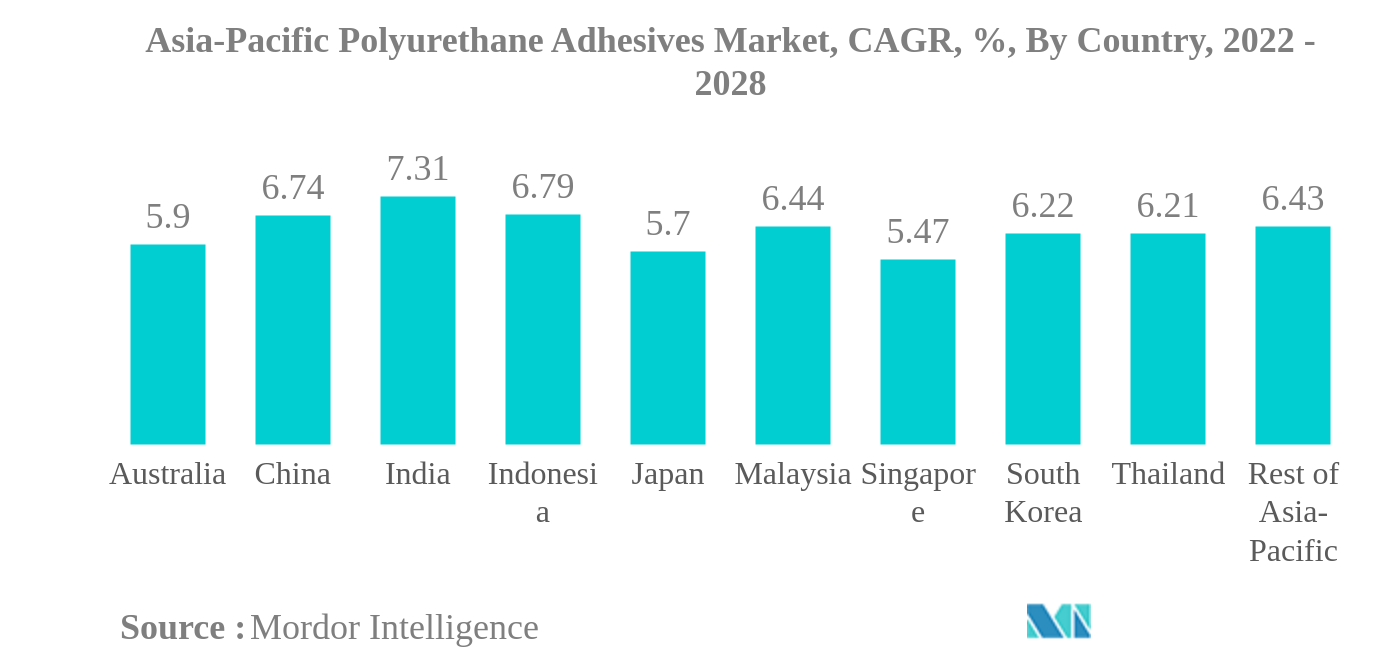
- China is the Largest Country. In Asia-Pacific, China holds the largest market share owing to the high usage of adhesives in the country's packaging, healthcare, automotive, and building and construction industries.
- India is the Fastest-growing Country. Due to the increasing population and rapid urbanization, India is likely to be the fastest-growing country in the market during the forecast period.
Asia-Pacific Polyurethane Adhesives Market Trends
This section covers the major market trends shaping the Asia-Pacific Polyurethane Adhesives Market according to our research experts:
Packaging is the largest End User Industry
- Polyurethane adhesives are widely used in the packaging industry. Polyurethane adhesives are used in food and beverage packaging, container packaging, end-of-line packaging for functional barrier applications, and metal packaging. The usage of polyurethane adhesive has been rising in packaging applications and registered growth rates of 4.76% and 2.2% in 2018 and 2019, respectively.
- The building and construction industry occupies a major share of the Asia-Pacific polyurethane adhesives market as polyurethane adhesives offer good cohesion, adhesion, and elasticity, high cohesive strength, flexibility, and a high elastic modulus of the substrate. China is the fastest-growing country in the Asia-Pacific region and is expected to register a CAGR of 5% during the period 2022 to 2028 in terms of consumption of polyurethane construction adhesives. The country recorded the highest demand for polyurethane construction adhesives owing to rising construction output, which amounted to USD 4.6 trillion in 2021, with a 10% growth over the previous year.
- Polyurethane adhesives are widely used in automotive applications. The adoption of electric four-wheelers in Asian markets will continue to be significant. In absolute terms, China is expected to become the largest EV market. On its current trajectory, China's adoption rate will approach 60%, and the country will account for more than 40% of global new EV sales by 2030, thus, boosting the demand for polyurethane automotive adhesives in the forecast period. Polyurethane adhesives are used in the healthcare industry for applications such as assembling medical device parts. The increase in healthcare investments across the Asia-Pacific region is expected to increase the demand for polyurethane adhesives in the forecast period.
China is the largest Country
- From 2017 to 2021, the demand for polyurethane adhesives was the highest in Asia-Pacific among all regions. The share of adhesive demand from this region has consistently occupied 46-47% of the global demand because of the region's high manufacturing capacity of all end-user industries. Polyurethane adhesives with hot melt, water-borne, and solvent-borne technologies account for the highest demand in the region.
- From 2017 to 2019, the demand for adhesives from this region recorded a CAGR of 0.79%. The slow growth in the demand for polyurethane adhesives was due to a decrease in construction activities and automotive production in the region. The demand from these end-user industries declined with a CAGR of -2.4% and -2.25% in 2018 and 2019, respectively, during this period.
- In 2020, the demand from all end-user industries across the region declined due to constraints in operations, labor, raw material, supply chain, and other areas. Among all industries across all the countries in the region, the footwear industry in Australia took the worst hit, declining by 49.53% Y-o-Y in volume terms. The decrease in domestic demand because of low purchasing power resulting from a weak economy severely affected this industry during the pandemic.
- In 2021, the demand for polyurethane adhesives quickly rebounded to the pre-pandemic demand volumes as restrictions eased. The demand from India witnessed the highest Y-o-Y growth of 73.82% in volume terms. The overall demand from the Asia-Pacific region is expected to record a CAGR of 4.46% during the forecast period. This demand growth is expected to be driven by the region's construction, packaging, and automotive industries during the forecast period.
Asia-Pacific Polyurethane Adhesives Industry Overview
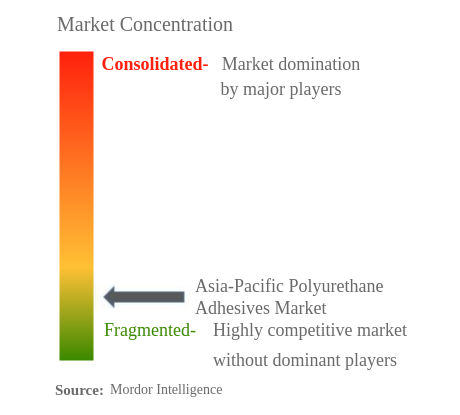
The Asia-Pacific Polyurethane Adhesives Market is fragmented, with the top five companies occupying 14.22%. The major players in this market are 3M, Beijing Comens New Materials Co., Ltd., NANPAO RESINS CHEMICAL GROUP, Pidilite Industries Ltd. and Sika AG (sorted alphabetically).
Asia-Pacific Polyurethane Adhesives Market Leaders
3M
Beijing Comens New Materials Co., Ltd.
NANPAO RESINS CHEMICAL GROUP
Pidilite Industries Ltd.
Sika AG
*Disclaimer: Major Players sorted in no particular order
Asia-Pacific Polyurethane Adhesives Market News
- December 2021: Sika planned to establish a new technology center and manufacturing factory for high-quality adhesives and sealants in Pune, India. The company primarily manufactures products for the transportation and construction industries through its three new production lines.
- September 2021: H.B. Fuller India launched a new food-based adhesive (Swift tak PS5600-I) to meet the rising demand for paper straws.
- July 2021: H.B. Fuller announced a strategic agreement with Covestro to offer sustainable adhesives in the market.
Asia-Pacific Polyurethane Adhesives Market Report - Table of Contents
1. INTRODUCTION
1.1. Study Assumptions & Market Definition
1.2. Scope of the Study
1.3. Research Methodology
2. KEY INDUSTRY TRENDS
2.1. End User Trends
2.2. Regulatory Framework
2.3. Value Chain & Distribution Channel Analysis
3. MARKET SEGMENTATION
3.1. End User Industry
3.1.1. Aerospace
3.1.2. Automotive
3.1.3. Building and Construction
3.1.4. Footwear and Leather
3.1.5. Healthcare
3.1.6. Packaging
3.1.7. Woodworking and Joinery
3.1.8. Other End-user Industries
3.2. Technology
3.2.1. Hot Melt
3.2.2. Reactive
3.2.3. Solvent-borne
3.2.4. UV Cured Adhesives
3.2.5. Water-borne
3.3. Country
3.3.1. Australia
3.3.2. China
3.3.3. India
3.3.4. Indonesia
3.3.5. Japan
3.3.6. Malaysia
3.3.7. Singapore
3.3.8. South Korea
3.3.9. Thailand
3.3.10. Rest of Asia-Pacific
4. COMPETITIVE LANDSCAPE
4.1. Key Strategic Moves
4.2. Market Share Analysis
4.3. Company Landscape
4.4. Company Profiles
4.4.1. 3M
4.4.2. Beijing Comens New Materials Co., Ltd.
4.4.3. H.B. Fuller Company
4.4.4. Henkel AG & Co. KGaA
4.4.5. Hubei Huitian New Materials Co. Ltd
4.4.6. Huntsman International LLC
4.4.7. Kangda New Materials (Group) Co., Ltd.
4.4.8. NANPAO RESINS CHEMICAL GROUP
4.4.9. Pidilite Industries Ltd.
4.4.10. Sika AG
5. KEY STRATEGIC QUESTIONS FOR ADHESIVES AND SEALANTS CEOS
6. APPENDIX
6.1. Global Adhesives and Sealants Industry Overview
6.1.1. Overview
6.1.2. Porter’s Five Forces Framework
6.1.3. Global Value Chain Analysis
6.1.4. Drivers, Restraints, and Opportunities
6.2. Sources & References
6.3. List of Tables & Figures
6.4. Primary Insights
6.5. Data Pack
6.6. Glossary of Terms
List of Tables & Figures
- Figure 1:
- ASIA-PACIFIC AIRCRAFT DELIVERIES, VOLUME IN UNITS, 2017-2028
- Figure 2:
- ASIA-PACIFIC AUTOMOBILE PRODUCTION, VOLUME IN UNITS, 2017-2028
- Figure 3:
- ASIA-PACIFIC NEW FLOOR AREA, VOLUME IN SQUARE FEET, 2017-2028
- Figure 4:
- ASIA-PACIFIC FOOTWEAR PRODUCTION, VOLUME IN PAIRS, 2017-2028
- Figure 5:
- ASIA-PACIFIC PAPER & PAPER BOARD AND PLASTIC PACKAGING, VOLUME IN TONS, 2017-2028
- Figure 6:
- ASIA-PACIFIC FURNITURE PRODUCTION, VOLUME IN UNITS, 2017-2028
- Figure 7:
- ASIA-PACIFIC POLYURETHANE ADHESIVES MARKET, VOLUME, TONS, 2017 - 2028
- Figure 8:
- ASIA-PACIFIC POLYURETHANE ADHESIVES MARKET, VALUE, USD, 2017 - 2028
- Figure 9:
- ASIA-PACIFIC POLYURETHANE ADHESIVES MARKET, BY END USER INDUSTRY, VOLUME, TONS, 2017 - 2028
- Figure 10:
- ASIA-PACIFIC POLYURETHANE ADHESIVES MARKET, BY END USER INDUSTRY, VALUE, USD, 2017 - 2028
- Figure 11:
- ASIA-PACIFIC POLYURETHANE ADHESIVES MARKET, BY END USER INDUSTRY, VOLUME SHARE (%), 2022 VS 2028
- Figure 12:
- ASIA-PACIFIC POLYURETHANE ADHESIVES MARKET, BY END USER INDUSTRY, VALUE SHARE (%), 2022 VS 2028
- Figure 13:
- ASIA-PACIFIC POLYURETHANE ADHESIVES MARKET, AEROSPACE, VOLUME, TONS, 2017 - 2028
- Figure 14:
- ASIA-PACIFIC POLYURETHANE ADHESIVES MARKET, AEROSPACE, VALUE, USD, 2017 - 2028
- Figure 15:
- ASIA-PACIFIC POLYURETHANE ADHESIVES MARKET, AEROSPACE, BY TECHNOLOGY, VALUE SHARE (%), 2021 VS 2028
- Figure 16:
- ASIA-PACIFIC POLYURETHANE ADHESIVES MARKET, AUTOMOTIVE, VOLUME, TONS, 2017 - 2028
- Figure 17:
- ASIA-PACIFIC POLYURETHANE ADHESIVES MARKET, AUTOMOTIVE, VALUE, USD, 2017 - 2028
- Figure 18:
- ASIA-PACIFIC POLYURETHANE ADHESIVES MARKET, AUTOMOTIVE, BY TECHNOLOGY, VALUE SHARE (%), 2021 VS 2028
- Figure 19:
- ASIA-PACIFIC POLYURETHANE ADHESIVES MARKET, BUILDING AND CONSTRUCTION, VOLUME, TONS, 2017 - 2028
- Figure 20:
- ASIA-PACIFIC POLYURETHANE ADHESIVES MARKET, BUILDING AND CONSTRUCTION, VALUE, USD, 2017 - 2028
- Figure 21:
- ASIA-PACIFIC POLYURETHANE ADHESIVES MARKET, BUILDING AND CONSTRUCTION, BY TECHNOLOGY, VALUE SHARE (%), 2021 VS 2028
- Figure 22:
- ASIA-PACIFIC POLYURETHANE ADHESIVES MARKET, FOOTWEAR AND LEATHER, VOLUME, TONS, 2017 - 2028
- Figure 23:
- ASIA-PACIFIC POLYURETHANE ADHESIVES MARKET, FOOTWEAR AND LEATHER, VALUE, USD, 2017 - 2028
- Figure 24:
- ASIA-PACIFIC POLYURETHANE ADHESIVES MARKET, FOOTWEAR AND LEATHER, BY TECHNOLOGY, VALUE SHARE (%), 2021 VS 2028
- Figure 25:
- ASIA-PACIFIC POLYURETHANE ADHESIVES MARKET, HEALTHCARE, VOLUME, TONS, 2017 - 2028
- Figure 26:
- ASIA-PACIFIC POLYURETHANE ADHESIVES MARKET, HEALTHCARE, VALUE, USD, 2017 - 2028
- Figure 27:
- ASIA-PACIFIC POLYURETHANE ADHESIVES MARKET, HEALTHCARE, BY TECHNOLOGY, VALUE SHARE (%), 2021 VS 2028
- Figure 28:
- ASIA-PACIFIC POLYURETHANE ADHESIVES MARKET, PACKAGING, VOLUME, TONS, 2017 - 2028
- Figure 29:
- ASIA-PACIFIC POLYURETHANE ADHESIVES MARKET, PACKAGING, VALUE, USD, 2017 - 2028
- Figure 30:
- ASIA-PACIFIC POLYURETHANE ADHESIVES MARKET, PACKAGING, BY TECHNOLOGY, VALUE SHARE (%), 2021 VS 2028
- Figure 31:
- ASIA-PACIFIC POLYURETHANE ADHESIVES MARKET, WOODWORKING AND JOINERY, VOLUME, TONS, 2017 - 2028
- Figure 32:
- ASIA-PACIFIC POLYURETHANE ADHESIVES MARKET, WOODWORKING AND JOINERY, VALUE, USD, 2017 - 2028
- Figure 33:
- ASIA-PACIFIC POLYURETHANE ADHESIVES MARKET, WOODWORKING AND JOINERY, BY TECHNOLOGY, VALUE SHARE (%), 2021 VS 2028
- Figure 34:
- ASIA-PACIFIC POLYURETHANE ADHESIVES MARKET, OTHER END-USER INDUSTRIES, VOLUME, TONS, 2017 - 2028
- Figure 35:
- ASIA-PACIFIC POLYURETHANE ADHESIVES MARKET, OTHER END-USER INDUSTRIES, VALUE, USD, 2017 - 2028
- Figure 36:
- ASIA-PACIFIC POLYURETHANE ADHESIVES MARKET, OTHER END-USER INDUSTRIES, BY TECHNOLOGY, VALUE SHARE (%), 2021 VS 2028
- Figure 37:
- ASIA-PACIFIC POLYURETHANE ADHESIVES MARKET, BY TECHNOLOGY, VOLUME, TONS, 2017 - 2028
- Figure 38:
- ASIA-PACIFIC POLYURETHANE ADHESIVES MARKET, BY TECHNOLOGY, VALUE, USD, 2017 - 2028
- Figure 39:
- ASIA-PACIFIC POLYURETHANE ADHESIVES MARKET, BY TECHNOLOGY, VOLUME SHARE (%), 2022 VS 2028
- Figure 40:
- ASIA-PACIFIC POLYURETHANE ADHESIVES MARKET, BY TECHNOLOGY, VALUE SHARE (%), 2022 VS 2028
- Figure 41:
- ASIA-PACIFIC POLYURETHANE ADHESIVES MARKET, HOT MELT, VOLUME, TONS, 2017 - 2028
- Figure 42:
- ASIA-PACIFIC POLYURETHANE ADHESIVES MARKET, HOT MELT, VALUE, USD, 2017 - 2028
- Figure 43:
- ASIA-PACIFIC POLYURETHANE ADHESIVES MARKET, HOT MELT, BY END USER INDUSTRY, VALUE SHARE (%), 2021 VS 2028
- Figure 44:
- ASIA-PACIFIC POLYURETHANE ADHESIVES MARKET, REACTIVE, VOLUME, TONS, 2017 - 2028
- Figure 45:
- ASIA-PACIFIC POLYURETHANE ADHESIVES MARKET, REACTIVE, VALUE, USD, 2017 - 2028
- Figure 46:
- ASIA-PACIFIC POLYURETHANE ADHESIVES MARKET, REACTIVE, BY END USER INDUSTRY, VALUE SHARE (%), 2021 VS 2028
- Figure 47:
- ASIA-PACIFIC POLYURETHANE ADHESIVES MARKET, SOLVENT-BORNE, VOLUME, TONS, 2017 - 2028
- Figure 48:
- ASIA-PACIFIC POLYURETHANE ADHESIVES MARKET, SOLVENT-BORNE, VALUE, USD, 2017 - 2028
- Figure 49:
- ASIA-PACIFIC POLYURETHANE ADHESIVES MARKET, SOLVENT-BORNE, BY END USER INDUSTRY, VALUE SHARE (%), 2021 VS 2028
- Figure 50:
- ASIA-PACIFIC POLYURETHANE ADHESIVES MARKET, UV CURED ADHESIVES, VOLUME, TONS, 2017 - 2028
- Figure 51:
- ASIA-PACIFIC POLYURETHANE ADHESIVES MARKET, UV CURED ADHESIVES, VALUE, USD, 2017 - 2028
- Figure 52:
- ASIA-PACIFIC POLYURETHANE ADHESIVES MARKET, UV CURED ADHESIVES, BY END USER INDUSTRY, VALUE SHARE (%), 2021 VS 2028
- Figure 53:
- ASIA-PACIFIC POLYURETHANE ADHESIVES MARKET, WATER-BORNE, VOLUME, TONS, 2017 - 2028
- Figure 54:
- ASIA-PACIFIC POLYURETHANE ADHESIVES MARKET, WATER-BORNE, VALUE, USD, 2017 - 2028
- Figure 55:
- ASIA-PACIFIC POLYURETHANE ADHESIVES MARKET, WATER-BORNE, BY END USER INDUSTRY, VALUE SHARE (%), 2021 VS 2028
- Figure 56:
- ASIA-PACIFIC POLYURETHANE ADHESIVES MARKET, BY COUNTRY, VOLUME, TONS, 2017 - 2028
- Figure 57:
- ASIA-PACIFIC POLYURETHANE ADHESIVES MARKET, BY COUNTRY, VALUE, USD, 2017 - 2028
- Figure 58:
- ASIA-PACIFIC POLYURETHANE ADHESIVES MARKET, BY COUNTRY, VOLUME SHARE (%), 2022 VS 2028
- Figure 59:
- ASIA-PACIFIC POLYURETHANE ADHESIVES MARKET, BY COUNTRY, VALUE SHARE (%), 2022 VS 2028
- Figure 60:
- ASIA-PACIFIC POLYURETHANE ADHESIVES MARKET, AUSTRALIA, VOLUME, TONS, 2017 - 2028
- Figure 61:
- ASIA-PACIFIC POLYURETHANE ADHESIVES MARKET, AUSTRALIA, VALUE, USD, 2017 - 2028
- Figure 62:
- ASIA-PACIFIC POLYURETHANE ADHESIVES MARKET, AUSTRALIA, BY END USER INDUSTRY, VALUE SHARE (%), 2021 VS 2028
- Figure 63:
- ASIA-PACIFIC POLYURETHANE ADHESIVES MARKET, CHINA, VOLUME, TONS, 2017 - 2028
- Figure 64:
- ASIA-PACIFIC POLYURETHANE ADHESIVES MARKET, CHINA, VALUE, USD, 2017 - 2028
- Figure 65:
- ASIA-PACIFIC POLYURETHANE ADHESIVES MARKET, CHINA, BY END USER INDUSTRY, VALUE SHARE (%), 2021 VS 2028
- Figure 66:
- ASIA-PACIFIC POLYURETHANE ADHESIVES MARKET, INDIA, VOLUME, TONS, 2017 - 2028
- Figure 67:
- ASIA-PACIFIC POLYURETHANE ADHESIVES MARKET, INDIA, VALUE, USD, 2017 - 2028
- Figure 68:
- ASIA-PACIFIC POLYURETHANE ADHESIVES MARKET, INDIA, BY END USER INDUSTRY, VALUE SHARE (%), 2021 VS 2028
- Figure 69:
- ASIA-PACIFIC POLYURETHANE ADHESIVES MARKET, INDONESIA, VOLUME, TONS, 2017 - 2028
- Figure 70:
- ASIA-PACIFIC POLYURETHANE ADHESIVES MARKET, INDONESIA, VALUE, USD, 2017 - 2028
- Figure 71:
- ASIA-PACIFIC POLYURETHANE ADHESIVES MARKET, INDONESIA, BY END USER INDUSTRY, VALUE SHARE (%), 2021 VS 2028
- Figure 72:
- ASIA-PACIFIC POLYURETHANE ADHESIVES MARKET, JAPAN, VOLUME, TONS, 2017 - 2028
- Figure 73:
- ASIA-PACIFIC POLYURETHANE ADHESIVES MARKET, JAPAN, VALUE, USD, 2017 - 2028
- Figure 74:
- ASIA-PACIFIC POLYURETHANE ADHESIVES MARKET, JAPAN, BY END USER INDUSTRY, VALUE SHARE (%), 2021 VS 2028
- Figure 75:
- ASIA-PACIFIC POLYURETHANE ADHESIVES MARKET, MALAYSIA, VOLUME, TONS, 2017 - 2028
- Figure 76:
- ASIA-PACIFIC POLYURETHANE ADHESIVES MARKET, MALAYSIA, VALUE, USD, 2017 - 2028
- Figure 77:
- ASIA-PACIFIC POLYURETHANE ADHESIVES MARKET, MALAYSIA, BY END USER INDUSTRY, VALUE SHARE (%), 2021 VS 2028
- Figure 78:
- ASIA-PACIFIC POLYURETHANE ADHESIVES MARKET, SINGAPORE, VOLUME, TONS, 2017 - 2028
- Figure 79:
- ASIA-PACIFIC POLYURETHANE ADHESIVES MARKET, SINGAPORE, VALUE, USD, 2017 - 2028
- Figure 80:
- ASIA-PACIFIC POLYURETHANE ADHESIVES MARKET, SINGAPORE, BY END USER INDUSTRY, VALUE SHARE (%), 2021 VS 2028
- Figure 81:
- ASIA-PACIFIC POLYURETHANE ADHESIVES MARKET, SOUTH KOREA, VOLUME, TONS, 2017 - 2028
- Figure 82:
- ASIA-PACIFIC POLYURETHANE ADHESIVES MARKET, SOUTH KOREA, VALUE, USD, 2017 - 2028
- Figure 83:
- ASIA-PACIFIC POLYURETHANE ADHESIVES MARKET, SOUTH KOREA, BY END USER INDUSTRY, VALUE SHARE (%), 2021 VS 2028
- Figure 84:
- ASIA-PACIFIC POLYURETHANE ADHESIVES MARKET, THAILAND, VOLUME, TONS, 2017 - 2028
- Figure 85:
- ASIA-PACIFIC POLYURETHANE ADHESIVES MARKET, THAILAND, VALUE, USD, 2017 - 2028
- Figure 86:
- ASIA-PACIFIC POLYURETHANE ADHESIVES MARKET, THAILAND, BY END USER INDUSTRY, VALUE SHARE (%), 2021 VS 2028
- Figure 87:
- ASIA-PACIFIC POLYURETHANE ADHESIVES MARKET, REST OF ASIA-PACIFIC, VOLUME, TONS, 2017 - 2028
- Figure 88:
- ASIA-PACIFIC POLYURETHANE ADHESIVES MARKET, REST OF ASIA-PACIFIC, VALUE, USD, 2017 - 2028
- Figure 89:
- ASIA-PACIFIC POLYURETHANE ADHESIVES MARKET, REST OF ASIA-PACIFIC, BY END USER INDUSTRY, VALUE SHARE (%), 2021 VS 2028
- Figure 90:
- ASIA-PACIFIC POLYURETHANE ADHESIVES MARKET, MOST ACTIVE COMPANIES, BY NUMBER OF STRATEGIC MOVES, 2019 - 2021
- Figure 91:
- ASIA-PACIFIC POLYURETHANE ADHESIVES MARKET, MOST ADOPTED STRATEGIES, 2019 - 2021
- Figure 92:
- ASIA-PACIFIC POLYURETHANE ADHESIVES MARKET SHARE(%), BY MAJOR PLAYERS REVENUE, 2021
Asia-Pacific Polyurethane Adhesives Industry Segmentation
Aerospace, Automotive, Building and Construction, Footwear and Leather, Healthcare, Packaging, Woodworking and Joinery are covered as segments by End User Industry. Hot Melt, Reactive, Solvent-borne, UV Cured Adhesives, Water-borne are covered as segments by Technology. Australia, China, India, Indonesia, Japan, Malaysia, Singapore, South Korea, Thailand are covered as segments by Country.| End User Industry | |
| Aerospace | |
| Automotive | |
| Building and Construction | |
| Footwear and Leather | |
| Healthcare | |
| Packaging | |
| Woodworking and Joinery | |
| Other End-user Industries |
| Technology | |
| Hot Melt | |
| Reactive | |
| Solvent-borne | |
| UV Cured Adhesives | |
| Water-borne |
| Country | |
| Australia | |
| China | |
| India | |
| Indonesia | |
| Japan | |
| Malaysia | |
| Singapore | |
| South Korea | |
| Thailand | |
| Rest of Asia-Pacific |
Market Definition
- End-user Industry - Building & Construction, Packaging, Automotive, Aerospace, Woodworking & Joinery, Footwear & Leather, Healthcare, and Others are the end-user industries considered under the polyurethane adhesives market.
- Product - All polyurethane adhesive products are considered in the market studied
- Resin - Under the scope of the study, thermoset and thermoplastic based polyurethanes are considered
- Technology - For the purpose of this study, Water-borne, Solvent-borne, Reactive, Hot Melt, and UV Cured adhesive technologies are taken into consideration.
Research Methodology
Mordor Intelligence follows a four-step methodology in all our reports.
- Step-1: Identify Key Variables: The quantifiable key variables (industry and extraneous) pertaining to the specific product segment and country are selected from a group of relevant variables & factors based on desk research & literature review; along with primary expert inputs. These variables are further confirmed through regression modeling (wherever required).
- Step-2: Build a Market Model: In order to build a robust forecasting methodology, the variables and factors identified in Step-1 are tested against available historical market numbers. Through an iterative process, the variables required for market forecast are set and the model is built on the basis of these variables.
- Step-3: Validate and Finalize: In this important step, all market numbers, variables and analyst calls are validated through an extensive network of primary research experts from the market studied. The respondents are selected across levels and functions to generate a holistic picture of the market studied.
- Step-4: Research Outputs: Syndicated Reports, Custom Consulting Assignments, Databases & Subscription Platforms


