Asia-Pacific Shrimp Market Size

| Icons | Lable | Value |
|---|---|---|
|
|
Study Period | 2016 - 2028 |
|
|
Base Year For Estimation | 2021 |
|
|
CAGR | 2.07 % |
|
|
Largest Share by Distribution Channel | On-Trade |
|
|
Largest Share by Country | China |
|
|
Market Concentration | High |
Major Players |
||
|
|
||
|
*Disclaimer: Major Players sorted in no particular order |
Asia-Pacific Shrimp Market Analysis
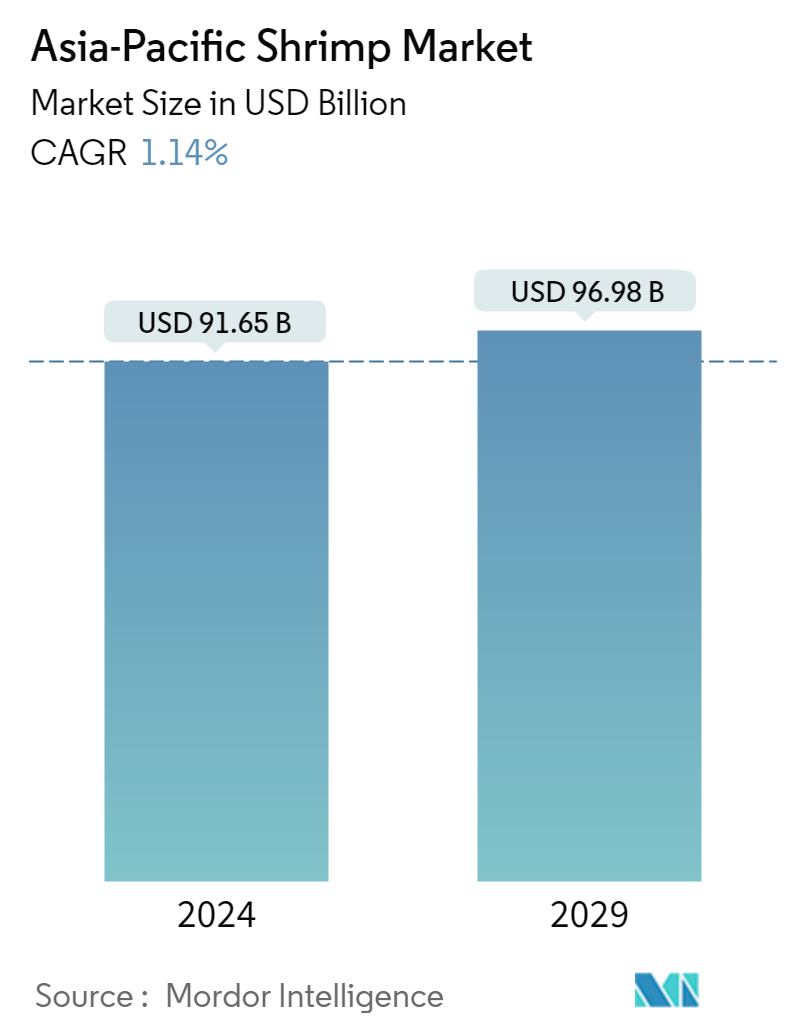
The Asia-Pacific Shrimp Market is projected to register a CAGR of 2.07%
- China is the Largest Country: China was one of the most significant importers of shrimp in 2020, with traders and distributors trying to cater to the increasing demand for fresh and frozen shrimp.
- Frozen / Canned is the Largest Form: Frozen shrimp is mainly purchased in bulk by the foodservice industry, with the growth being driven by the rising demand for Argentine red shrimp and Pacific wild shrimp.
- India is the Fastest-growing Country: Shrimp sales in India are driven by the development of processed and innovative value-added shrimp products, which is anticipated to continue in the forecast period as well.
- Processed is the Fastest-growing Form: With technological advancements and innovations in the seafood sector, shrimp processing has become more refined, and the shelf life of shrimp products has improved.
Asia-Pacific Shrimp Market Trends
This section covers the major market trends shaping the Asia-Pacific Shrimp Market according to our research experts:
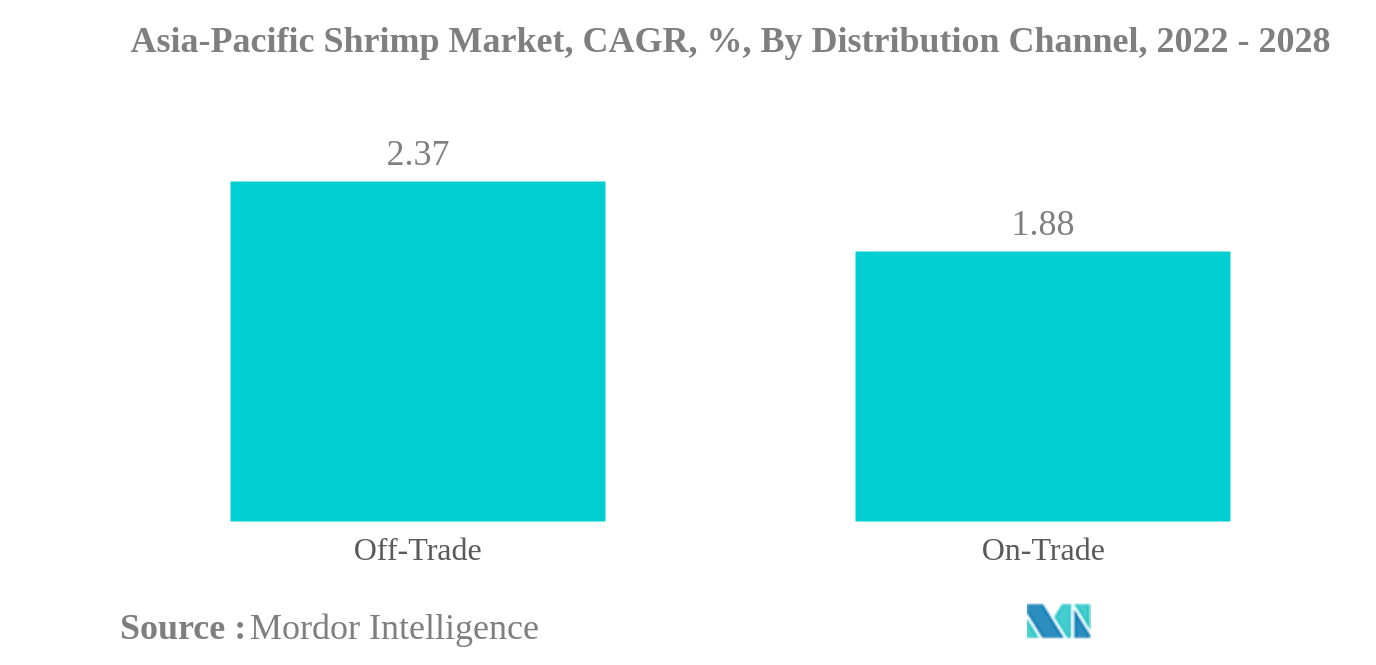
On-Trade is the largest Distribution Channel
- Due to the COVID-19 pandemic, the demand for processed shrimp soared due to panic buying, with massive shrimp stockpiles available due to increased stocking density. In China, many intensive producers stock roughly 120-160 shrimps per square meter, with some stocking up to 300 shrimps per square meter. Large stock availability in countries enabled the supply of many shrimp categories through various retail outlets. Between 2018 and 2021, the processed shrimp category's growth rate increased by 7.34% in terms of value.
- The on-trade channel dominates the processed shrimp business; by value, it registered a growth of 6.37% through the on-trade channel between 2018 and 2021. Foodservices primarily acquire processed shrimp due to their high quality. Shrimps may be infected with diseases that have negative health effects on people. Hence, disease transmission is avoided by processing and packaging with safety precautions. However, prices are extremely dependent on shrimp farmers, as the aquaculture sector in the region has been expanding rapidly. Most farmed animals have a mortality rate of around 1% per month.
- The off-trade is the fastest-growing channel in the shrimp market, which is projected to witness a CAGR of 2.37%, by value, during the forecast period. Key players such as Thai Union Group PCL, Wynntech Star Sdn Bhd, Apex Frozen Foods Ltd, and Blue Snow Food Co. Ltd focus on product innovation and expansion through various retail channels such as supermarkets and online stores. The growing working population has changed consumer food habits and spending patterns, whereas busy lifestyles are increasing the demand for processed shrimp to meet dietary habits.
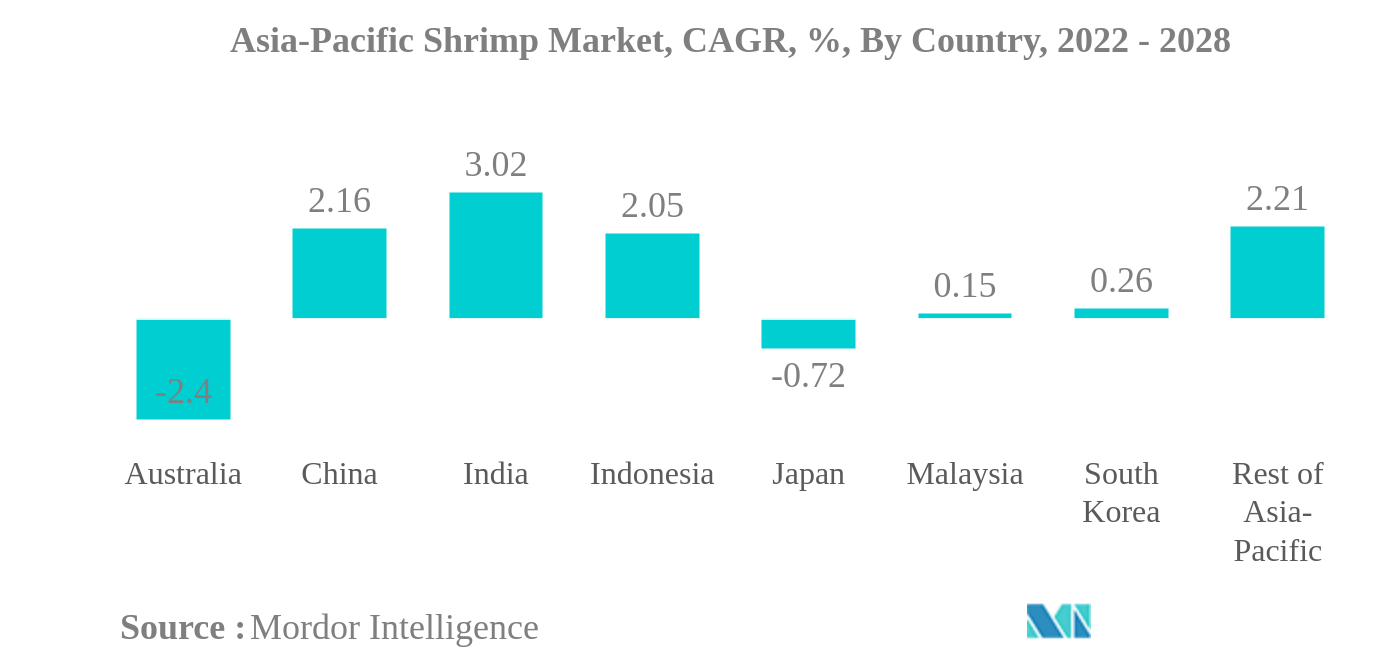
China is the largest Country
- China is the market leader in shrimp production, followed by India and Indonesia. China has one-fifth of the world's population and accounts for one-third of the world's seafood production, including shrimp. Seafood is very popular in the country to the extent that the country needs imports of shrimp to fulfill the local demand. Globally, China is a top market for shrimp, aided by higher production, export, and imports. China produces about one million tons of farmed shrimp annually, and less than 20% of those are exported. Since 2016, shrimp import to the country has increased by 481%, reaching 621,187 metric tons of import volume in 2020.
- Despite being one of the world's top shrimp producers, India exports most of its output to the United States. Shrimp exports by India increased at an average annual rate of 8% between 2016 and 2020. However, a high-value domestic market for shrimp is being developed in India, owing to the growing urban middle class, the vast number of young people, the ease of cooking shrimp, and the widely held belief that seafood is healthy. Thus, India is projected to register the highest CAGR of 3.02%, by value, during the forecast period.
- Indonesia mainly earns through the export of shrimp. Between 2016-2020, the export of shrimp from Indonesia increased by more than 27%. The domestic demand for shrimp is relatively lower than other seafood as shrimp is still considered a costly source of protein for most households. However, the surging purchasing power of the locals and the rise of the on-trade industry are boosting shrimp sales in the local market. The on-trade sector accounts for a 58.80% value share of the Indonesian market.
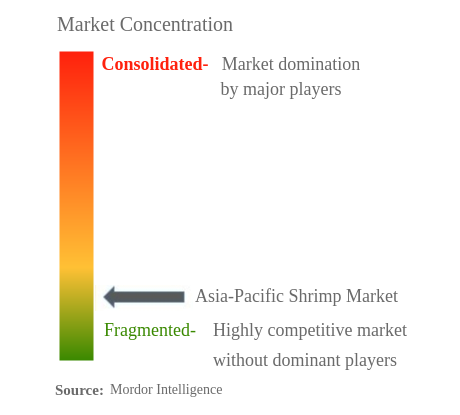
Asia-Pacific Shrimp Industry Overview
The Asia-Pacific Shrimp Market is fragmented, with the top five companies occupying 1.05%. The major players in this market are Apex Frozen Foods Ltd, Blue Snow Food Co. Ltd, Roda Internacional Canarias SL, Thai Union Group PCL and Wynntech Star Sdn Bhd (sorted alphabetically).
Asia-Pacific Shrimp Market Leaders
Apex Frozen Foods Ltd
Blue Snow Food Co. Ltd
Roda Internacional Canarias SL
Thai Union Group PCL
Wynntech Star Sdn Bhd
*Disclaimer: Major Players sorted in no particular order
Asia-Pacific Shrimp Market News
- February 2022: Thai Union began piloting the use of satellite imaging for shrimp farming operations in collaboration with Sea Warden - a satellite data analytics company and Wholechain - a supply chain traceability company to support sustainable farming practices through insights into shrimp populations, farm health, contamination.
- January 2022: Thai Union Group PCL (“Thai Union”) announced that its subsidiary Thai Union Manufacturing Co., Ltd. (“TUM”) launched a new joint venture with JWD InfoLogistics Public Company Limited’s subsidiary Pacific Cold Storage Co., Ltd(“PCS”).
- June 2021: Thai Union expands into ViAqua Therapeutics by venture funding, a biotechnology company. This helps to increase the feed efficiency and effectiveness for disease prevention in shrimp and other species.
Asia-Pacific Shrimp Market Report - Table of Contents
EXECUTIVE SUMMARY & KEY FINDINGS
1. INTRODUCTION
1.1. Study Assumptions & Market Definition
1.2. Scope of the Study
1.3. Research Methodology
2. KEY INDUSTRY TRENDS
2.1. Price Trends
2.2. Production Trends
2.3. Regulatory Framework
2.4. Value Chain & Distribution Channel Analysis
3. MARKET SEGMENTATION
3.1. Form
3.1.1. Fresh / Chilled
3.1.2. Frozen / Canned
3.1.3. Processed
3.2. Distribution Channel
3.2.1. Off-Trade
3.2.1.1. Convenience Stores
3.2.1.2. Online Channel
3.2.1.3. Supermarkets and Hypermarkets
3.2.1.4. Others
3.2.2. On-Trade
3.3. Country
3.3.1. Australia
3.3.2. China
3.3.3. India
3.3.4. Indonesia
3.3.5. Japan
3.3.6. Malaysia
3.3.7. South Korea
3.3.8. Rest of Asia-Pacific
4. COMPETITIVE LANDSCAPE
4.1. Key Strategic Moves
4.2. Market Share Analysis
4.3. Company Landscape
4.4. Company Profiles
4.4.1. Apex Frozen Foods Ltd
4.4.2. Avanti Feeds Limited
4.4.3. Blue Snow Food Co. Ltd
4.4.4. De Oro Resources Incorporated
4.4.5. Millennium Ocean Star Corporation
4.4.6. Roda Internacional Canarias SL
4.4.7. Thai Union Group PCL
4.4.8. Wynntech Star Sdn Bhd
5. KEY STRATEGIC QUESTIONS FOR SEAFOOD INDUSTRY CEOS
6. APPENDIX
6.1. Global Overview
6.1.1. Overview
6.1.2. Porter’s Five Forces Framework
6.1.3. Global Value Chain Analysis
6.1.4. Market Dynamics (DROs)
6.2. Sources & References
6.3. List of Tables & Figures
6.4. Primary Insights
6.5. Data Pack
6.6. Glossary of Terms
List of Tables & Figures
- Figure 1:
- ASIA-PACIFIC SHRIMP MARKET, SHRIMP, PRICE IN USD/METRIC TONNES, 2016 - 2022
- Figure 2:
- ASIA-PACIFIC SHRIMP MARKET, SHRIMP, PRODUCTION IN METRIC TONNES, 2016 - 2028
- Figure 3:
- ASIA-PACIFIC SHRIMP MARKET, VOLUME, METRIC TONNES, 2016 - 2028
- Figure 4:
- ASIA-PACIFIC SHRIMP MARKET, VALUE, USD, 2016 - 2028
- Figure 5:
- ASIA-PACIFIC SHRIMP MARKET, VOLUME IN METRIC TONNES, BY FORM, 2016 - 2028
- Figure 6:
- ASIA-PACIFIC SHRIMP MARKET, VALUE IN USD, BY FORM, 2016 - 2028
- Figure 7:
- ASIA-PACIFIC SHRIMP MARKET, VOLUME SHARE (%), BY FORM, 2016 VS 2022 VS 2028
- Figure 8:
- ASIA-PACIFIC SHRIMP MARKET, VALUE SHARE (%), BY FORM, 2016 VS 2022 VS 2028
- Figure 9:
- ASIA-PACIFIC SHRIMP MARKET, VOLUME IN METRIC TONNES, FRESH / CHILLED, 2016 - 2028
- Figure 10:
- ASIA-PACIFIC SHRIMP MARKET, VALUE IN USD, FRESH / CHILLED, 2016 - 2028
- Figure 11:
- ASIA-PACIFIC SHRIMP MARKET, FRESH / CHILLED, VALUE SHARE (%), BY DISTRIBUTION CHANNEL, 2021 VS 2028
- Figure 12:
- ASIA-PACIFIC SHRIMP MARKET, VOLUME IN METRIC TONNES, FROZEN / CANNED, 2016 - 2028
- Figure 13:
- ASIA-PACIFIC SHRIMP MARKET, VALUE IN USD, FROZEN / CANNED, 2016 - 2028
- Figure 14:
- ASIA-PACIFIC SHRIMP MARKET, FROZEN / CANNED, VALUE SHARE (%), BY DISTRIBUTION CHANNEL, 2021 VS 2028
- Figure 15:
- ASIA-PACIFIC SHRIMP MARKET, VOLUME IN METRIC TONNES, PROCESSED, 2016 - 2028
- Figure 16:
- ASIA-PACIFIC SHRIMP MARKET, VALUE IN USD, PROCESSED, 2016 - 2028
- Figure 17:
- ASIA-PACIFIC SHRIMP MARKET, PROCESSED, VALUE SHARE (%), BY DISTRIBUTION CHANNEL, 2021 VS 2028
- Figure 18:
- ASIA-PACIFIC SHRIMP MARKET, VOLUME IN METRIC TONNES, BY DISTRIBUTION CHANNEL, 2016 - 2028
- Figure 19:
- ASIA-PACIFIC SHRIMP MARKET, VALUE IN USD, BY DISTRIBUTION CHANNEL, 2016 - 2028
- Figure 20:
- ASIA-PACIFIC SHRIMP MARKET, VOLUME SHARE (%), BY DISTRIBUTION CHANNEL, 2016 VS 2022 VS 2028
- Figure 21:
- ASIA-PACIFIC SHRIMP MARKET, VALUE SHARE (%), BY DISTRIBUTION CHANNEL, 2016 VS 2022 VS 2028
- Figure 22:
- ASIA-PACIFIC SHRIMP MARKET, VOLUME IN METRIC TONNES, BY OFF-TRADE, 2016 - 2028
- Figure 23:
- ASIA-PACIFIC SHRIMP MARKET, VALUE IN USD, BY OFF-TRADE, 2016 - 2028
- Figure 24:
- ASIA-PACIFIC SHRIMP MARKET, VOLUME SHARE (%), BY OFF-TRADE, 2016 VS 2022 VS 2028
- Figure 25:
- ASIA-PACIFIC SHRIMP MARKET, VALUE SHARE (%), BY OFF-TRADE, 2016 VS 2022 VS 2028
- Figure 26:
- ASIA-PACIFIC SHRIMP MARKET, VOLUME IN METRIC TONNES, CONVENIENCE STORES, 2016 - 2028
- Figure 27:
- ASIA-PACIFIC SHRIMP MARKET, VALUE IN USD, CONVENIENCE STORES, 2016 - 2028
- Figure 28:
- ASIA-PACIFIC SHRIMP MARKET, CONVENIENCE STORES, VALUE SHARE (%), BY FORM, 2021 VS 2028
- Figure 29:
- ASIA-PACIFIC SHRIMP MARKET, VOLUME IN METRIC TONNES, ONLINE CHANNEL, 2016 - 2028
- Figure 30:
- ASIA-PACIFIC SHRIMP MARKET, VALUE IN USD, ONLINE CHANNEL, 2016 - 2028
- Figure 31:
- ASIA-PACIFIC SHRIMP MARKET, ONLINE CHANNEL, VALUE SHARE (%), BY FORM, 2021 VS 2028
- Figure 32:
- ASIA-PACIFIC SHRIMP MARKET, VOLUME IN METRIC TONNES, SUPERMARKETS AND HYPERMARKETS, 2016 - 2028
- Figure 33:
- ASIA-PACIFIC SHRIMP MARKET, VALUE IN USD, SUPERMARKETS AND HYPERMARKETS, 2016 - 2028
- Figure 34:
- ASIA-PACIFIC SHRIMP MARKET, SUPERMARKETS AND HYPERMARKETS, VALUE SHARE (%), BY FORM, 2021 VS 2028
- Figure 35:
- ASIA-PACIFIC SHRIMP MARKET, VOLUME IN METRIC TONNES, OTHERS, 2016 - 2028
- Figure 36:
- ASIA-PACIFIC SHRIMP MARKET, VALUE IN USD, OTHERS, 2016 - 2028
- Figure 37:
- ASIA-PACIFIC SHRIMP MARKET, OTHERS, VALUE SHARE (%), BY FORM, 2021 VS 2028
- Figure 38:
- ASIA-PACIFIC SHRIMP MARKET, VOLUME IN METRIC TONNES, ON-TRADE, 2016 - 2028
- Figure 39:
- ASIA-PACIFIC SHRIMP MARKET, VALUE IN USD, ON-TRADE, 2016 - 2028
- Figure 40:
- ASIA-PACIFIC SHRIMP MARKET, VOLUME IN METRIC TONNES, BY COUNTRY, 2016 - 2028
- Figure 41:
- ASIA-PACIFIC SHRIMP MARKET, VALUE IN USD, BY COUNTRY, 2016 - 2028
- Figure 42:
- ASIA-PACIFIC SHRIMP MARKET, VOLUME SHARE (%), BY COUNTRY, 2016 VS 2022 VS 2028
- Figure 43:
- ASIA-PACIFIC SHRIMP MARKET, VOLUME SHARE (%), BY COUNTRY, 2016 VS 2022 VS 2028
- Figure 44:
- ASIA-PACIFIC SHRIMP MARKET, VOLUME IN METRIC TONNES, AUSTRALIA, 2016 - 2028
- Figure 45:
- ASIA-PACIFIC SHRIMP MARKET, VALUE IN USD, AUSTRALIA, 2016 - 2028
- Figure 46:
- ASIA-PACIFIC SHRIMP MARKET, AUSTRALIA, VALUE SHARE (%), BY DISTRIBUTION CHANNEL, 2021 VS 2028
- Figure 47:
- ASIA-PACIFIC SHRIMP MARKET, VOLUME IN METRIC TONNES, CHINA, 2016 - 2028
- Figure 48:
- ASIA-PACIFIC SHRIMP MARKET, VALUE IN USD, CHINA, 2016 - 2028
- Figure 49:
- ASIA-PACIFIC SHRIMP MARKET, CHINA, VALUE SHARE (%), BY DISTRIBUTION CHANNEL, 2021 VS 2028
- Figure 50:
- ASIA-PACIFIC SHRIMP MARKET, VOLUME IN METRIC TONNES, INDIA, 2016 - 2028
- Figure 51:
- ASIA-PACIFIC SHRIMP MARKET, VALUE IN USD, INDIA, 2016 - 2028
- Figure 52:
- ASIA-PACIFIC SHRIMP MARKET, INDIA, VALUE SHARE (%), BY DISTRIBUTION CHANNEL, 2021 VS 2028
- Figure 53:
- ASIA-PACIFIC SHRIMP MARKET, VOLUME IN METRIC TONNES, INDONESIA, 2016 - 2028
- Figure 54:
- ASIA-PACIFIC SHRIMP MARKET, VALUE IN USD, INDONESIA, 2016 - 2028
- Figure 55:
- ASIA-PACIFIC SHRIMP MARKET, INDONESIA, VALUE SHARE (%), BY DISTRIBUTION CHANNEL, 2021 VS 2028
- Figure 56:
- ASIA-PACIFIC SHRIMP MARKET, VOLUME IN METRIC TONNES, JAPAN, 2016 - 2028
- Figure 57:
- ASIA-PACIFIC SHRIMP MARKET, VALUE IN USD, JAPAN, 2016 - 2028
- Figure 58:
- ASIA-PACIFIC SHRIMP MARKET, JAPAN, VALUE SHARE (%), BY DISTRIBUTION CHANNEL, 2021 VS 2028
- Figure 59:
- ASIA-PACIFIC SHRIMP MARKET, VOLUME IN METRIC TONNES, MALAYSIA, 2016 - 2028
- Figure 60:
- ASIA-PACIFIC SHRIMP MARKET, VALUE IN USD, MALAYSIA, 2016 - 2028
- Figure 61:
- ASIA-PACIFIC SHRIMP MARKET, MALAYSIA, VALUE SHARE (%), BY DISTRIBUTION CHANNEL, 2021 VS 2028
- Figure 62:
- ASIA-PACIFIC SHRIMP MARKET, VOLUME IN METRIC TONNES, SOUTH KOREA, 2016 - 2028
- Figure 63:
- ASIA-PACIFIC SHRIMP MARKET, VALUE IN USD, SOUTH KOREA, 2016 - 2028
- Figure 64:
- ASIA-PACIFIC SHRIMP MARKET, SOUTH KOREA, VALUE SHARE (%), BY DISTRIBUTION CHANNEL, 2021 VS 2028
- Figure 65:
- ASIA-PACIFIC SHRIMP MARKET, VOLUME IN METRIC TONNES, REST OF ASIA-PACIFIC, 2016 - 2028
- Figure 66:
- ASIA-PACIFIC SHRIMP MARKET, VALUE IN USD, REST OF ASIA-PACIFIC, 2016 - 2028
- Figure 67:
- ASIA-PACIFIC SHRIMP MARKET, REST OF ASIA-PACIFIC, VALUE SHARE (%), BY DISTRIBUTION CHANNEL, 2021 VS 2028
- Figure 68:
- ASIA-PACIFIC SHRIMP MARKET, MOST ACTIVE COMPANIES, BY NUMBER OF STRATEGIC MOVES, 2017 - 2022
- Figure 69:
- ASIA-PACIFIC SHRIMP MARKET, TOTAL NUMBER OF STRATEGIC MOVES, 2017 - 2022
- Figure 70:
- ASIA-PACIFIC SHRIMP MARKET SHARE(%), BY KEY PLAYERS, 2021
Asia-Pacific Shrimp Industry Segmentation
Fresh / Chilled, Frozen / Canned, Processed are covered as segments by Form. Off-Trade, On-Trade are covered as segments by Distribution Channel. Australia, China, India, Indonesia, Japan, Malaysia, South Korea are covered as segments by Country.| Form | |
| Fresh / Chilled | |
| Frozen / Canned | |
| Processed |
| Distribution Channel | ||||||
| ||||||
| On-Trade |
| Country | |
| Australia | |
| China | |
| India | |
| Indonesia | |
| Japan | |
| Malaysia | |
| South Korea | |
| Rest of Asia-Pacific |
Market Definition
- Frozen / Canned Seafood - Frozen seafood are products whose average temperature is reduced to -18 ° C or lower to preserve the inherent quality of the fresh fish. Then it is kept at a temperature of -18 ° C or lower to maintain its shelf life.
- Processed Seafood - Processed seafood are the ones that have been cured, salted, marinated, dried, pickled, fermented or smoked for human consumption.
- Seafood - It contains marine species that can be consumed, particularly fish and shelled marine life.
- Shrimp - Shrimp are swimming crustaceans. They have long, slender muscles in their abdomens and lengthy antennae.
Research Methodology
Mordor Intelligence follows a four-step methodology in all our reports.
- Step-1: Identify Key Variables: In order to build a robust forecasting methodology, the variables and factors identified in Step 1 are tested against available historical market numbers. Through an iterative process, the variables required for market forecast are set, and the model is built on the basis of these variables.
- Step-2: Build a Market Model: Market-size estimations for the forecast years are in nominal terms. Inflation is not a part of the pricing, and the average selling price (ASP) is kept constant throughout the forecast period for each country.
- Step-3: Validate and Finalize: In this important step, all market numbers, variables, and analyst calls are validated through an extensive network of primary research experts from the market studied. The respondents are selected across levels and functions to generate a holistic picture of the market studied.
- Step-4: Research Outputs: Syndicated Reports, Custom Consulting Assignments, Databases & Subscription Platforms


