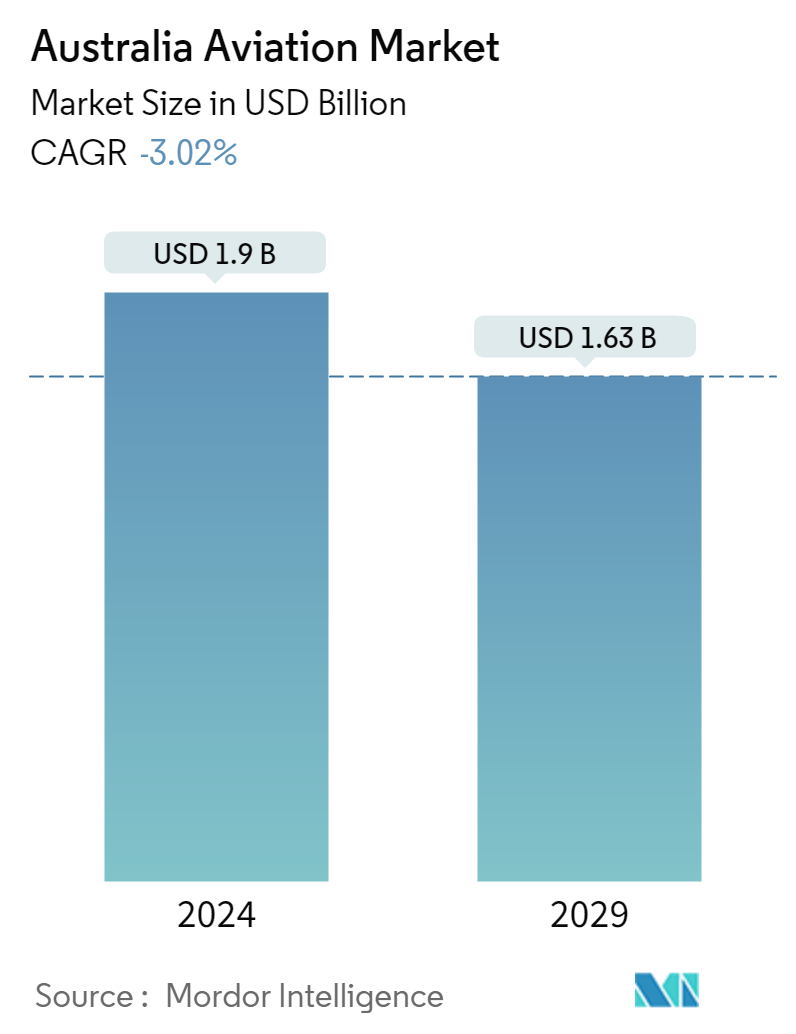
Australia Aviation Market Size

| Icons | Lable | Value |
|---|---|---|
|
|
Study Period | 2016 - 2028 |
|
|
Base Year For Estimation | 2021 |
|
|
CAGR | -3.69 % |
|
|
Largest Share by Aircraft Type | Military Aviation |
|
|
Fastest Growing by Aircraft Type | Commercial Aviation |
|
|
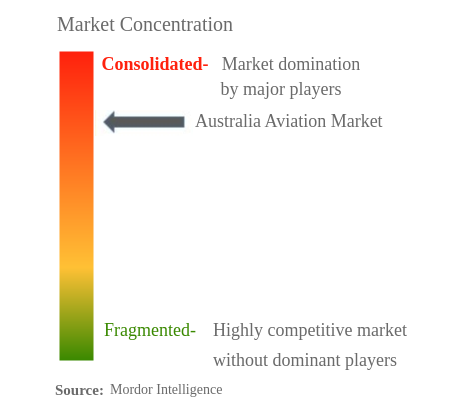
Market Concentration | High |
Major Players |
||
|
|
||
|
*Disclaimer: Major Players sorted in no particular order |
Australia Aviation Market Analysis
The Australia Aviation Market is projected to register a CAGR of -3.69%
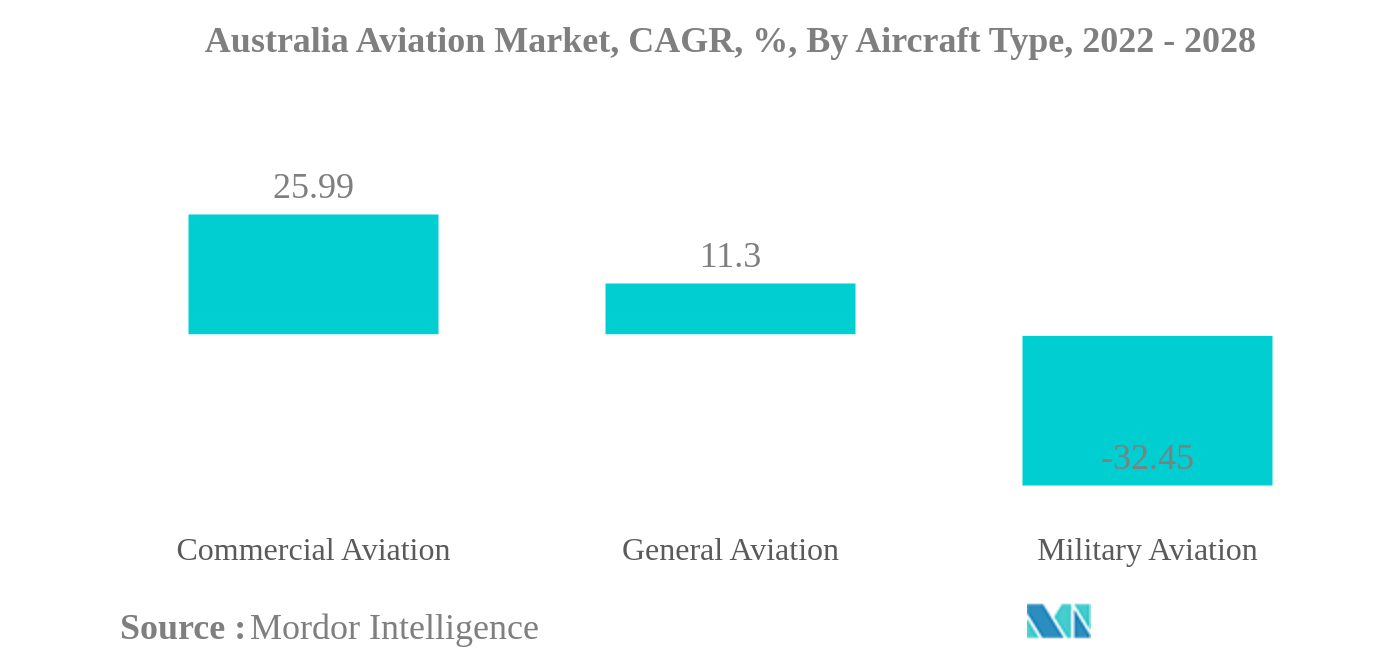
- Military Aviation is the Largest Aircraft Type : Rising geopolitical tensions and ongoing conflicts between the countries are some factors prompting the country to spend on military equipment.
- Fixed-Wing Aircraft is the Largest Sub Aircraft Type : The country's focus on enhancing its combat capabilities by procuring technologically advanced combat aircraft drives the fixed-wing aircraft market growth in military aviation.
Australia Aviation Market Trends
This section covers the major market trends shaping the Australia Aviation Market according to our research experts:
Military Aviation is the largest Aircraft Type
- The air transportation industry, comprising airlines and its supply chain, is projected to contribute around USD 39 billion of GDP annually to the Australian economy. In all, inputs to the air transport sector and foreign tourists coming by air support more than 2% of the country's GDP.
- The deliveries in overall aviation witnessed a fall of around 50% in 2020. The OEMs experienced problems such as a halt in production to the supply chain and transportation issues due to the lockdown.
- In commercial aviation, the country's airline companies witnessed a 237% rise in air passenger traffic in 2021, with faster recovery in domestic aviation leading to a surge in the procurement of narrow-body aircraft. During the forecast period, 2022-2028, around 18 commercial aircraft are expected to be delivered to the country.
- In the General aviation sector, the overall delivery comprising business jet, helicopter, Piston, and Turboprop aircraft surged around 49% during 2019-2021. The factors such as the increasing rate of HNWIs, training schools, and the fleet expansion of Charter operators in the country are expected to propel the general aviation sector.
- The country's defense expenditure surged around 16% from 2020-2021, rising from USD 27.3 billion in 2020 to USD 31.7 billion in 2021. The defense expenditure of the country was 2% of the GDP. The ongoing conflicts and security challenges from China, along with the need to replace the aging fleet, have propelled the procurement of military aircraft in the country.
Australia Aviation Industry Overview
The Australia Aviation Market is fairly consolidated, with the top five companies occupying 87.33%. The major players in this market are Airbus SE, Bombardier Inc., General Dynamics Corporation, Lockheed Martin Corporation and Textron Inc. (sorted alphabetically).
Australia Aviation Market Leaders
Airbus SE
Bombardier Inc.
General Dynamics Corporation
Lockheed Martin Corporation
Textron Inc.
*Disclaimer: Major Players sorted in no particular order
Australia Aviation Market News
- July 2022: EmbraerX establishes a presence in the Netherlands to further the development of innovative and sustainable aviation technology.
- June 2022: Qantas and Airbus plans to invest up to USD 200 million to support the development of a sustainable aviation fuel (SAF) industry.
- June 2022: The Emergency Rescue Helicopter Service (ERHS) of Western Australia ordered three Leonardo AW139 intermediate twin-engine helicopters as part of a fleet modernization effort to enhance airborne capabilities by expanding Leonardo's AW139 fleet. The helicopters will be supplied by the leading helicopter operator called CHC Australia to the ERHS to conduct HEMS, search and rescue, and inter-hospital patient transport missions from Jandakot and Bunbury Airports.
Australia Aviation Market Report - Table of Contents
1. INTRODUCTION
1.1. Study Assumptions & Market Definition
1.2. Scope of the Study
1.3. Research Methodology
2. KEY INDUSTRY TRENDS
2.1. Air Passenger Traffic
2.2. Air Transport Freight
2.3. Gross Domestic Product
2.4. Revenue Passenger Kilometers (RPK)
2.5. Inflation Rate
2.6. Active Fleet Data
2.7. Defense Spending
2.8. High-Net-Worth Individual (HNWI)
2.9. Regulatory Framework
2.10. Value Chain Analysis
3. MARKET SEGMENTATION
3.1. Aircraft Type
3.1.1. Commercial Aviation
3.1.1.1. By Sub Aircraft Type
3.1.1.1.1. Freighter Aircraft
3.1.1.1.2. Passenger Aircraft
3.1.1.1.2.1. By Body Type
3.1.1.1.2.1.1. Narrowbody Aircraft
3.1.1.1.2.1.2. Widebody Aircraft
3.1.2. General Aviation
3.1.2.1. By Sub Aircraft Type
3.1.2.1.1. Business Jets
3.1.2.1.1.1. By Body Type
3.1.2.1.1.1.1. Large Jet
3.1.2.1.1.1.2. Light Jet
3.1.2.1.1.1.3. Mid-Size Jet
3.1.2.1.2. Piston Fixed-Wing Aircraft
3.1.2.1.3. Others
3.1.3. Military Aviation
3.1.3.1. By Sub Aircraft Type
3.1.3.1.1. Fixed-Wing Aircraft
3.1.3.1.1.1. By Body Type
3.1.3.1.1.1.1. Multi-Role Aircraft
3.1.3.1.1.1.2. Training Aircraft
3.1.3.1.1.1.3. Transport Aircraft
3.1.3.1.1.1.4. Others
3.1.3.1.2. Rotorcraft
3.1.3.1.2.1. By Body Type
3.1.3.1.2.1.1. Multi-Mission Helicopter
3.1.3.1.2.1.2. Transport Helicopter
3.1.3.1.2.1.3. Others
4. COMPETITIVE LANDSCAPE
4.1. Key Strategic Moves
4.2. Market Share Analysis
4.3. Company Landscape
4.4. Company Profiles
4.4.1. Airbus SE
4.4.2. Bombardier Inc.
4.4.3. Cirrus Design Corporation
4.4.4. Embraer
4.4.5. General Dynamics Corporation
4.4.6. Leonardo S.p.A
4.4.7. Lockheed Martin Corporation
4.4.8. Pilatus Aircraft Ltd
4.4.9. Textron Inc.
4.4.10. The Boeing Company
5. KEY STRATEGIC QUESTIONS FOR AVIATION CEOS
6. APPENDIX
6.1. Global Overview
6.1.1. Overview
6.1.2. Porter’s Five Forces Framework
6.1.3. Global Value Chain Analysis
6.1.4. Market Dynamics (DROs)
6.2. Sources & References
6.3. List of Tables & Figures
6.4. Primary Insights
6.5. Data Pack
6.6. Glossary of Terms
List of Tables & Figures
- Figure 1:
- AUSTRALIA AVIATION MARKET, AIR PASSENGER TRAFFIC, NUMBER OF PASSENGERS CARRIED, 2016 – 2028
- Figure 2:
- AUSTRALIA AVIATION MARKET, AIR TRANSPORT FREIGHT, TON-KM, 2016 – 2028
- Figure 3:
- AUSTRALIA AVIATION MARKET, GROSS DOMESTIC PRODUCT, VALUE, USD, 2016 – 2028
- Figure 4:
- AUSTRALIA AVIATION MARKET, REVENUE PASSENGER KILOMETERS (RPK), KILOMETERS, 2016 – 2028
- Figure 5:
- AUSTRALIA AVIATION MARKET, INFLATION RATE, %, 2016 – 2028
- Figure 6:
- AUSTRALIA AVIATION MARKET, ACTIVE FLEET DATA, NUMBER OF AIRCRAFT, 2016 – 2028
- Figure 7:
- AUSTRALIA AVIATION MARKET, DEFENSE SPENDING, VALUE, USD, 2016 – 2028
- Figure 8:
- AUSTRALIA AVIATION MARKET, HIGH-NET-WORTH INDIVIDUAL (HNWI), POPULATION, 2016 – 2028
- Figure 9:
- AUSTRALIA AVIATION MARKET, VOLUME, UNITS, 2016 - 2028
- Figure 10:
- AUSTRALIA AVIATION MARKET, VALUE, USD, 2016 - 2028
- Figure 11:
- AUSTRALIA AVIATION MARKET, BY AIRCRAFT TYPE, VOLUME, UNITS, 2016 - 2028
- Figure 12:
- AUSTRALIA AVIATION MARKET, BY AIRCRAFT TYPE, VALUE, USD, 2016 - 2028
- Figure 13:
- AUSTRALIA AVIATION MARKET, BY AIRCRAFT TYPE, VOLUME, %, 2016 VS 2022 VS 2028
- Figure 14:
- AUSTRALIA AVIATION MARKET, BY AIRCRAFT TYPE, VALUE, %, 2016 VS 2022 VS 2028
- Figure 15:
- AUSTRALIA AVIATION MARKET, BY SUB AIRCRAFT TYPE, VOLUME, UNITS, 2016 - 2028
- Figure 16:
- AUSTRALIA AVIATION MARKET, BY SUB AIRCRAFT TYPE, VALUE, USD, 2016 - 2028
- Figure 17:
- AUSTRALIA AVIATION MARKET, BY SUB AIRCRAFT TYPE, VOLUME, %, 2016 VS 2022 VS 2028
- Figure 18:
- AUSTRALIA AVIATION MARKET, BY SUB AIRCRAFT TYPE, VALUE, %, 2016 VS 2022 VS 2028
- Figure 19:
- AUSTRALIA AVIATION MARKET, BY FREIGHTER AIRCRAFT, VOLUME, UNITS, 2016 - 2028
- Figure 20:
- AUSTRALIA AVIATION MARKET, BY FREIGHTER AIRCRAFT, VALUE, USD, 2016 - 2028
- Figure 21:
- AUSTRALIA AVIATION MARKET, BY FREIGHTER AIRCRAFT, VALUE, %, 2021 VS 2028
- Figure 22:
- AUSTRALIA AVIATION MARKET, BY BODY TYPE, VOLUME, UNITS, 2016 - 2028
- Figure 23:
- AUSTRALIA AVIATION MARKET, BY BODY TYPE, VALUE, USD, 2016 - 2028
- Figure 24:
- AUSTRALIA AVIATION MARKET, BY BODY TYPE, VOLUME, %, 2016 VS 2022 VS 2028
- Figure 25:
- AUSTRALIA AVIATION MARKET, BY BODY TYPE, VALUE, %, 2016 VS 2022 VS 2028
- Figure 26:
- AUSTRALIA AVIATION MARKET, BY NARROWBODY AIRCRAFT, VOLUME, UNITS, 2016 - 2028
- Figure 27:
- AUSTRALIA AVIATION MARKET, BY NARROWBODY AIRCRAFT, VALUE, USD, 2016 - 2028
- Figure 28:
- AUSTRALIA AVIATION MARKET, BY NARROWBODY AIRCRAFT, VALUE, %, 2021 VS 2028
- Figure 29:
- AUSTRALIA AVIATION MARKET, BY WIDEBODY AIRCRAFT, VOLUME, UNITS, 2016 - 2028
- Figure 30:
- AUSTRALIA AVIATION MARKET, BY WIDEBODY AIRCRAFT, VALUE, USD, 2016 - 2028
- Figure 31:
- AUSTRALIA AVIATION MARKET, BY WIDEBODY AIRCRAFT, VALUE, %, 2021 VS 2028
- Figure 32:
- AUSTRALIA AVIATION MARKET, BY SUB AIRCRAFT TYPE, VOLUME, UNITS, 2016 - 2028
- Figure 33:
- AUSTRALIA AVIATION MARKET, BY SUB AIRCRAFT TYPE, VALUE, USD, 2016 - 2028
- Figure 34:
- AUSTRALIA AVIATION MARKET, BY SUB AIRCRAFT TYPE, VOLUME, %, 2016 VS 2022 VS 2028
- Figure 35:
- AUSTRALIA AVIATION MARKET, BY SUB AIRCRAFT TYPE, VALUE, %, 2016 VS 2022 VS 2028
- Figure 36:
- AUSTRALIA AVIATION MARKET, BY BODY TYPE, VOLUME, UNITS, 2016 - 2028
- Figure 37:
- AUSTRALIA AVIATION MARKET, BY BODY TYPE, VALUE, USD, 2016 - 2028
- Figure 38:
- AUSTRALIA AVIATION MARKET, BY BODY TYPE, VOLUME, %, 2016 VS 2022 VS 2028
- Figure 39:
- AUSTRALIA AVIATION MARKET, BY BODY TYPE, VALUE, %, 2016 VS 2022 VS 2028
- Figure 40:
- AUSTRALIA AVIATION MARKET, BY LARGE JET, VOLUME, UNITS, 2016 - 2028
- Figure 41:
- AUSTRALIA AVIATION MARKET, BY LARGE JET, VALUE, USD, 2016 - 2028
- Figure 42:
- AUSTRALIA AVIATION MARKET, BY LARGE JET, VALUE, %, 2021 VS 2028
- Figure 43:
- AUSTRALIA AVIATION MARKET, BY LIGHT JET, VOLUME, UNITS, 2016 - 2028
- Figure 44:
- AUSTRALIA AVIATION MARKET, BY LIGHT JET, VALUE, USD, 2016 - 2028
- Figure 45:
- AUSTRALIA AVIATION MARKET, BY LIGHT JET, VALUE, %, 2021 VS 2028
- Figure 46:
- AUSTRALIA AVIATION MARKET, BY MID-SIZE JET, VOLUME, UNITS, 2016 - 2028
- Figure 47:
- AUSTRALIA AVIATION MARKET, BY MID-SIZE JET, VALUE, USD, 2016 - 2028
- Figure 48:
- AUSTRALIA AVIATION MARKET, BY MID-SIZE JET, VALUE, %, 2021 VS 2028
- Figure 49:
- AUSTRALIA AVIATION MARKET, BY PISTON FIXED-WING AIRCRAFT, VOLUME, UNITS, 2016 - 2028
- Figure 50:
- AUSTRALIA AVIATION MARKET, BY PISTON FIXED-WING AIRCRAFT, VALUE, USD, 2016 - 2028
- Figure 51:
- AUSTRALIA AVIATION MARKET, BY PISTON FIXED-WING AIRCRAFT, VALUE, %, 2021 VS 2028
- Figure 52:
- AUSTRALIA AVIATION MARKET, BY OTHERS, VOLUME, UNITS, 2016 - 2028
- Figure 53:
- AUSTRALIA AVIATION MARKET, BY OTHERS, VALUE, USD, 2016 - 2028
- Figure 54:
- AUSTRALIA AVIATION MARKET, BY OTHERS, VALUE, %, 2021 VS 2028
- Figure 55:
- AUSTRALIA AVIATION MARKET, BY SUB AIRCRAFT TYPE, VOLUME, UNITS, 2016 - 2028
- Figure 56:
- AUSTRALIA AVIATION MARKET, BY SUB AIRCRAFT TYPE, VALUE, USD, 2016 - 2028
- Figure 57:
- AUSTRALIA AVIATION MARKET, BY SUB AIRCRAFT TYPE, VOLUME, %, 2016 VS 2022 VS 2028
- Figure 58:
- AUSTRALIA AVIATION MARKET, BY SUB AIRCRAFT TYPE, VALUE, %, 2016 VS 2022 VS 2028
- Figure 59:
- AUSTRALIA AVIATION MARKET, BY BODY TYPE, VOLUME, UNITS, 2016 - 2028
- Figure 60:
- AUSTRALIA AVIATION MARKET, BY BODY TYPE, VALUE, USD, 2016 - 2028
- Figure 61:
- AUSTRALIA AVIATION MARKET, BY BODY TYPE, VOLUME, %, 2016 VS 2022 VS 2028
- Figure 62:
- AUSTRALIA AVIATION MARKET, BY BODY TYPE, VALUE, %, 2016 VS 2022 VS 2028
- Figure 63:
- AUSTRALIA AVIATION MARKET, BY MULTI-ROLE AIRCRAFT, VOLUME, UNITS, 2016 - 2028
- Figure 64:
- AUSTRALIA AVIATION MARKET, BY MULTI-ROLE AIRCRAFT, VALUE, USD, 2016 - 2028
- Figure 65:
- AUSTRALIA AVIATION MARKET, BY MULTI-ROLE AIRCRAFT, VALUE, %, 2021 VS 2028
- Figure 66:
- AUSTRALIA AVIATION MARKET, BY TRAINING AIRCRAFT, VOLUME, UNITS, 2016 - 2028
- Figure 67:
- AUSTRALIA AVIATION MARKET, BY TRAINING AIRCRAFT, VALUE, USD, 2016 - 2028
- Figure 68:
- AUSTRALIA AVIATION MARKET, BY TRAINING AIRCRAFT, VALUE, %, 2021 VS 2028
- Figure 69:
- AUSTRALIA AVIATION MARKET, BY TRANSPORT AIRCRAFT, VOLUME, UNITS, 2016 - 2028
- Figure 70:
- AUSTRALIA AVIATION MARKET, BY TRANSPORT AIRCRAFT, VALUE, USD, 2016 - 2028
- Figure 71:
- AUSTRALIA AVIATION MARKET, BY TRANSPORT AIRCRAFT, VALUE, %, 2021 VS 2028
- Figure 72:
- AUSTRALIA AVIATION MARKET, BY OTHERS, VOLUME, UNITS, 2016 - 2028
- Figure 73:
- AUSTRALIA AVIATION MARKET, BY OTHERS, VALUE, USD, 2016 - 2028
- Figure 74:
- AUSTRALIA AVIATION MARKET, BY OTHERS, VALUE, %, 2021 VS 2028
- Figure 75:
- AUSTRALIA AVIATION MARKET, BY BODY TYPE, VOLUME, UNITS, 2016 - 2028
- Figure 76:
- AUSTRALIA AVIATION MARKET, BY BODY TYPE, VALUE, USD, 2016 - 2028
- Figure 77:
- AUSTRALIA AVIATION MARKET, BY BODY TYPE, VOLUME, %, 2016 VS 2022 VS 2028
- Figure 78:
- AUSTRALIA AVIATION MARKET, BY BODY TYPE, VALUE, %, 2016 VS 2022 VS 2028
- Figure 79:
- AUSTRALIA AVIATION MARKET, BY MULTI-MISSION HELICOPTER, VOLUME, UNITS, 2016 - 2028
- Figure 80:
- AUSTRALIA AVIATION MARKET, BY MULTI-MISSION HELICOPTER, VALUE, USD, 2016 - 2028
- Figure 81:
- AUSTRALIA AVIATION MARKET, BY MULTI-MISSION HELICOPTER, VALUE, %, 2021 VS 2028
- Figure 82:
- AUSTRALIA AVIATION MARKET, BY TRANSPORT HELICOPTER, VOLUME, UNITS, 2016 - 2028
- Figure 83:
- AUSTRALIA AVIATION MARKET, BY TRANSPORT HELICOPTER, VALUE, USD, 2016 - 2028
- Figure 84:
- AUSTRALIA AVIATION MARKET, BY TRANSPORT HELICOPTER, VALUE, %, 2021 VS 2028
- Figure 85:
- AUSTRALIA AVIATION MARKET, BY OTHERS, VOLUME, UNITS, 2016 - 2028
- Figure 86:
- AUSTRALIA AVIATION MARKET, BY OTHERS, VALUE, USD, 2016 - 2028
- Figure 87:
- AUSTRALIA AVIATION MARKET, BY OTHERS, VALUE, %, 2021 VS 2028
- Figure 88:
- AUSTRALIA AVIATION MARKET, MOST ACTIVE COMPANIES, BY NUMBER OF STRATEGIC MOVES, 2018 - 2021
- Figure 89:
- AUSTRALIA AVIATION MARKET, MOST ADOPTED STRATEGIES, 2018 - 2021
- Figure 90:
- AUSTRALIA AVIATION MARKET SHARE(%), BY MAJOR PLAYERS, 2021
Australia Aviation Industry Segmentation
Commercial Aviation, General Aviation, Military Aviation are covered as segments by Aircraft Type.| Aircraft Type | |||||||||||||||||||
| |||||||||||||||||||
| |||||||||||||||||||
|
Market Definition
- Aircraft Type - All the aircraft related to commercial, military and general aviation have been included in this study
- Body Type - Body type includes all types of aircraft segmented based on application/size/capacity/role.
- Sub-Aircraft Type - Fixed-Wing passenger aircraft, freighter aircraft, business jets, piston fixed-wing aircraft, military fixed-wing aircraft, and rotorcraft are included under this study.
Research Methodology
Mordor Intelligence follows a four-step methodology in all our reports.
- Step-1: Identify Key Variables: In order to build a robust forecasting methodology, the variables and factors identified in Step-1 are tested against available historical market numbers. Through an iterative process, the variables required for market forecast are set and the model is built on the basis of these variables.
- Step-2: Build a Market Model: Market-size estimations for the historical and forecast years have been provided in revenue and volume terms. For sales conversion to volume, the average selling price (ASP) is kept constant throughout the forecast period for each country, and inflation is not a part of the pricing.
- Step-3: Validate and Finalize: In this important step, all market numbers, variables and analyst calls are validated through an extensive network of primary research experts from the market studied. The respondents are selected across levels and functions to generate a holistic picture of the market studied.
- Step-4: Research Outputs: Syndicated Reports, Custom Consulting Assignments, Databases & Subscription Platforms


