Australia E- Bike Market Size

| Icons | Lable | Value |
|---|---|---|
|
|
Study Period | 2017 - 2029 |
|
|
Base Year For Estimation | 2022 |
|
|
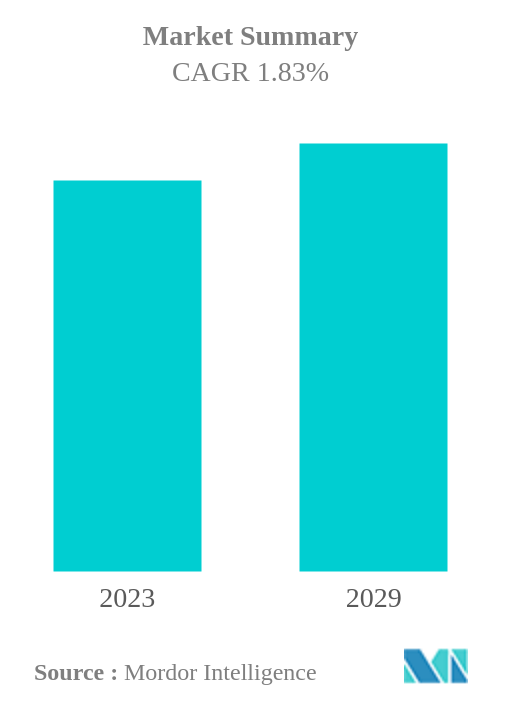
CAGR | 1.83 % |
|
|
Largest Share by Propulsion Type | Pedal Assisted |
|
|
Fastest Growing by Propulsion Type | Speed Pedelec |
|
|
Market Concentration | High |
Major Players |
||
|
|
||
|
*Disclaimer: Major Players sorted in no particular order |
Australia E- Bike Market Analysis
The Australia E-bike Market is projected to register a CAGR of 1.83%
- Largest Segment by Propulsion Type - Pedal Assisted : On e-bikes with pedal assistance, riders cycle quickly and easily as the motor produces greater power, efficiently carrying loads while saving time and cost. Hence, it is the largest segment in the market.
- Largest Segment by Application Type - City/Urban : Due to the continuous usage of bikes for daily commuting by students, workers, and courier companies, city/urban bikes make up the largest segment of the market.
- Largest Segment by Battery Type - Lithium-ion Battery : Advanced technology, better range, long battery life, and fast charging features are enhancing the higher usage of lithium-ion batteries in bicycles.
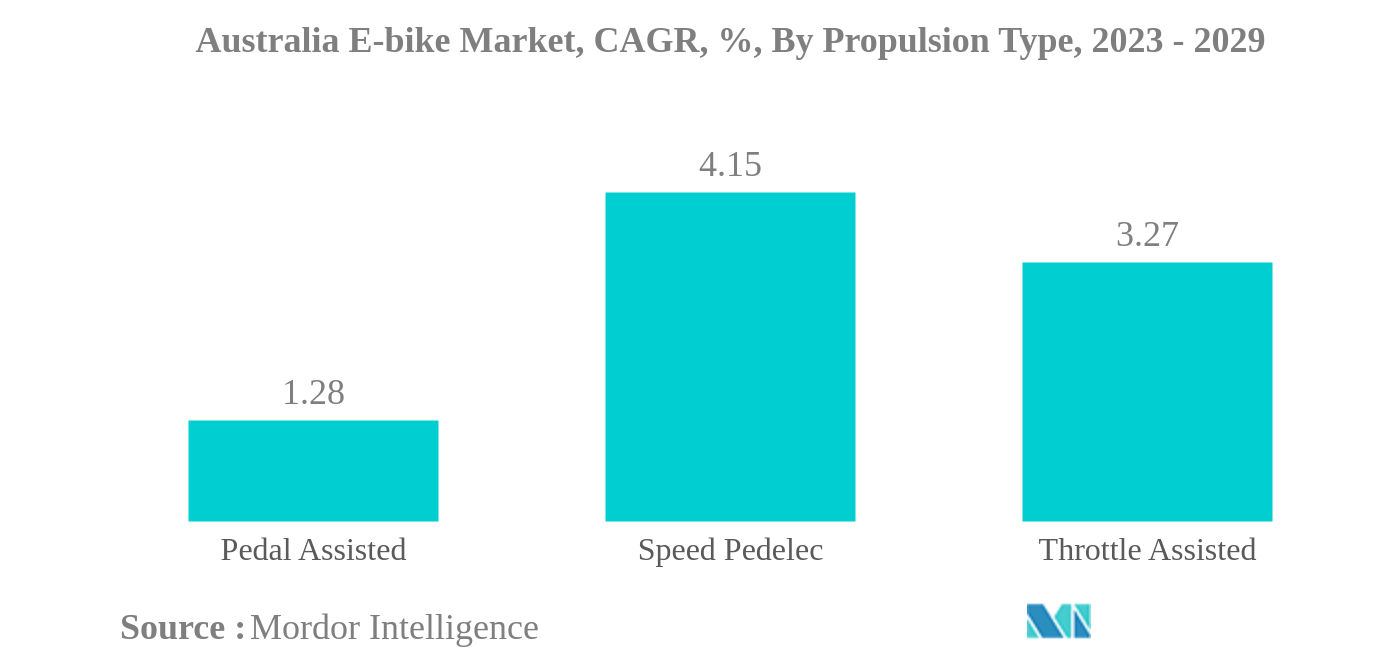
- Fastest-Growing Segment by Propulsion Type - Speed Pedelec : Growing consumer interest in speedy bikes to reach their destination faster during heavy traffic, along with fuel cost savings, is making speed pedelec the fastest-growing segment.
Australia E- Bike Market Trends
This section covers the major market trends shaping the Australia E- Bike Market according to our research experts:
Pedal Assisted is the largest segment by Propulsion Type.
- In Australia, cycling is a common activity for the population. Men participate in cycling at a significantly higher rate than women, suggesting that men ride more frequently than women. Around 34.2% of people rode bicycles in 2017, recording a slight decline from 2016. In Australia, sales of e-bikes are growing quickly, and the import of e-bikes tripled in the past three years. The government has since announced that there would be a 5% charge for importing e-bikes. The increased tax would not apply to countries with free trade agreements with Australia, such as China, Cambodia, Indonesia, and the United States, but it might increase the price of e-bikes made in Taiwan, Europe, and India.
- According to the Australian Automobile Association, traffic congestion has caused an average reduction in driving speeds of 3-8% in the country's major cities. If significant policy changes are not made, congestion costs are predicted to reach between USD 27.7 and USD 37.3 billion by 2030. On the other hand, rising fuel prices, worsening traffic, growing interest in exercise and health, and increasing environmental consciousness are the key forces driving the Australian e-bike market. The demand for e-bikes is also driven by an increasing interest among the population in preserving the environment for future generations, primarily by combating environmental problems and the depletion of natural resources.
- Two recent breakthroughs that have had a substantial impact on the market dynamics for electric bicycles in Australia are the launch of high-end electric bicycles and the introduction of high-tech speed pedelec bikes with smartphone integration. The pedal-assisted segment held the biggest share of the Australian e-bike market during the historical period (2017-2022), but the speed pedelec segment is anticipated to be the fastest-growing segment over the forecast period.
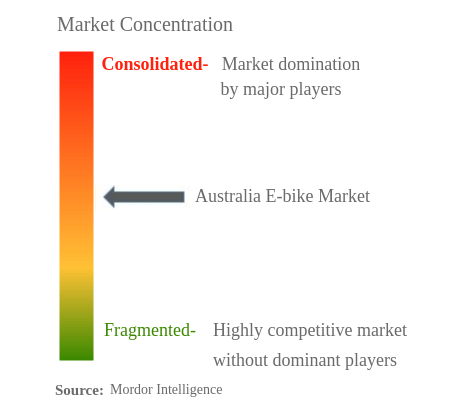
Australia E- Bike Industry Overview
The Australia E-bike Market is moderately consolidated, with the top five companies occupying 46.50%. The major players in this market are Dyson bikes, Giant Manufacturing Co., NCM Bike, Norco and Specialized Bicycle Components (sorted alphabetically).
Australia E- Bike Market Leaders
Dyson bikes
Giant Manufacturing Co.
NCM Bike
Norco
Specialized Bicycle Components
*Disclaimer: Major Players sorted in no particular order
Australia E- Bike Market News
- November 2022: Company has introduced NCM ET Cycle T720 Step through Electric Bike in the market.
- November 2022: Focus Bikes Drops The Fancy JAM² SL Electric Mountain Bike, This sleek and athletic 29er has a carbon frame and a Fazua Drive 60 system.
- September 2022: Specialized, announced a recall of some battery packs on specific electric mountain bike models in May 2021 owing to fire dangers caused by these batteries' flaws.
Australia E- Bike Market Report - Table of Contents
EXECUTIVE SUMMARY & KEY FINDINGS
REPORT OFFERS
1. INTRODUCTION
1.1. Study Assumptions & Market Definition
1.2. Scope of the Study
1.3. Research Methodology
2. KEY INDUSTRY TRENDS
2.1. Bicycle Sales
2.2. GDP Per Capita
2.3. Inflation Rate
2.4. Adoption Rate Of E-Bikes
2.5. Percent Population/Commuters With 5-15 Km Daily Travel Distance
2.6. Bicycle Rental
2.7. E-Bike Battery Price
2.8. Price Chart Of Different Battery Chemistry
2.9. Hyper-Local Delivery
2.10. Dedicated Bicycle Lanes
2.11. Number Of Trekkers
2.12. Battery Charging Capacity
2.13. Traffic Congestion Index
2.14. Regulatory Framework
2.15. Value Chain & Distribution Channel Analysis
3. MARKET SEGMENTATION
3.1. Propulsion Type
3.1.1. Pedal Assisted
3.1.2. Speed Pedelec
3.1.3. Throttle Assisted
3.2. Application Type
3.2.1. Cargo/Utility
3.2.2. City/Urban
3.2.3. Trekking
3.3. Battery Type
3.3.1. Lead Acid Battery
3.3.2. Lithium-ion Battery
3.3.3. Others
4. COMPETITIVE LANDSCAPE
4.1. Key Strategic Moves
4.2. Market Share Analysis
4.3. Company Landscape
4.4. Company Profiles
4.4.1. Dyson bikes
4.4.2. Giant Manufacturing Co.
4.4.3. Merida Industry Co Ltd
4.4.4. NCM Bike
4.4.5. Norco
4.4.6. Pedego Electric Bikes
4.4.7. Riese & Müller
4.4.8. Robert Bosch GmbH
4.4.9. Specialized Bicycle Components
4.4.10. Trek Bicycle Corporation
5. KEY STRATEGIC QUESTIONS FOR E BIKES CEOS
6. APPENDIX
6.1. Global Overview
6.1.1. Overview
6.1.2. Porter’s Five Forces Framework
6.1.3. Global Value Chain Analysis
6.1.4. Market Dynamics (DROs)
6.2. Sources & References
6.3. List of Tables & Figures
6.4. Primary Insights
6.5. Data Pack
6.6. Glossary of Terms
List of Tables & Figures
- Figure 1:
- AUSTRALIA E-BIKE MARKET, BICYCLE SALES, VOLUME, THOUSAND UNITS, 2017 - 2029
- Figure 2:
- AUSTRALIA E-BIKE MARKET, GDP PER CAPITA, VALUE, USD, 2017 - 2029
- Figure 3:
- AUSTRALIA E-BIKE MARKET, INFLATION RATE, VALUE, PERCENT, 2017 - 2029
- Figure 4:
- AUSTRALIA E-BIKE MARKET, ADOPTION RATE, VOLUME, PERCENT, 2017 - 2029
- Figure 5:
- AUSTRALIA E-BIKE MARKET, COMMUTERS WITH 5-15 KM TRAVEL DISTANCE, VOLUME, PERCENT, 2017 - 2029
- Figure 6:
- AUSTRALIA E-BIKE MARKET, BICYCLE RENTAL, VALUE, USD MILLION, 2017 - 2029
- Figure 7:
- AUSTRALIA E-BIKE MARKET, E-BIKE BATTERY PRICE, VALUE, USD, 2017 - 2029
- Figure 8:
- AUSTRALIA E-BIKE MARKET, PRICE CHART OF DIFFERENT BATTERY CHEMISTRY, VALUE, USD, 2017 - 2029
- Figure 9:
- AUSTRALIA E-BIKE MARKET, HYPER-LOCAL DELIVERY, VOLUME, THOUSAND UNITS, 2017 - 2029
- Figure 10:
- AUSTRALIA E-BIKE MARKET, DEDICATED BICYCLE LANES, VOLUME, THOUSAND UNITS, 2017 - 2029
- Figure 11:
- AUSTRALIA E-BIKE MARKET, NUMBER OF TREKKERS, VOLUME, THOUSAND UNITS, 2017 - 2029
- Figure 12:
- AUSTRALIA E-BIKE MARKET, BATTERY CHARGING CAPACITY, VOLUME, UNITS, 2017 - 2029
- Figure 13:
- AUSTRALIA E-BIKE MARKET, TRAFFIC CONGESTION INDEX, VOLUME, PERCENT, 2017 - 2022
- Figure 14:
- AUSTRALIA E-BIKE MARKET, VOLUME, UNITS, 2017 - 2029
- Figure 15:
- AUSTRALIA E-BIKE MARKET, VALUE, USD MILLION, 2017 - 2029
- Figure 16:
- AUSTRALIA E-BIKE MARKET, BY PROPULSION TYPE, VOLUME, UNITS, 2017 - 2029
- Figure 17:
- AUSTRALIA E-BIKE MARKET, BY PROPULSION TYPE, VALUE, USD MILLION, 2017 - 2029
- Figure 18:
- AUSTRALIA E-BIKE MARKET, BY PROPULSION TYPE, VOLUME, SHARE (%), 2017 - 2029
- Figure 19:
- AUSTRALIA E-BIKE MARKET, BY PROPULSION TYPE, VALUE, SHARE (%), 2017 - 2029
- Figure 20:
- AUSTRALIA E-BIKE MARKET, BY PROPULSION TYPE, VOLUME, UNITS, 2017 - 2029
- Figure 21:
- AUSTRALIA E-BIKE MARKET, BY PROPULSION TYPE, VALUE, USD MILLION, 2017 - 2029
- Figure 22:
- AUSTRALIA E-BIKE MARKET, BY PROPULSION TYPE, VALUE SHARE (%), 2022 - 2029
- Figure 23:
- AUSTRALIA E-BIKE MARKET, BY PROPULSION TYPE, VOLUME, UNITS, 2017 - 2029
- Figure 24:
- AUSTRALIA E-BIKE MARKET, BY PROPULSION TYPE, VALUE, USD MILLION, 2017 - 2029
- Figure 25:
- AUSTRALIA E-BIKE MARKET, BY PROPULSION TYPE, VALUE SHARE (%), 2022 - 2029
- Figure 26:
- AUSTRALIA E-BIKE MARKET, BY PROPULSION TYPE, VOLUME, UNITS, 2017 - 2029
- Figure 27:
- AUSTRALIA E-BIKE MARKET, BY PROPULSION TYPE, VALUE, USD MILLION, 2017 - 2029
- Figure 28:
- AUSTRALIA E-BIKE MARKET, BY PROPULSION TYPE, VALUE SHARE (%), 2022 - 2029
- Figure 29:
- AUSTRALIA E-BIKE MARKET, BY APPLICATION TYPE, VOLUME, UNITS, 2017 - 2029
- Figure 30:
- AUSTRALIA E-BIKE MARKET, BY APPLICATION TYPE, VALUE, USD MILLION, 2017 - 2029
- Figure 31:
- AUSTRALIA E-BIKE MARKET, BY APPLICATION TYPE, VOLUME, SHARE (%), 2017 - 2029
- Figure 32:
- AUSTRALIA E-BIKE MARKET, BY APPLICATION TYPE, VALUE, SHARE (%), 2017 - 2029
- Figure 33:
- AUSTRALIA E-BIKE MARKET, BY APPLICATION TYPE, VOLUME, UNITS, 2017 - 2029
- Figure 34:
- AUSTRALIA E-BIKE MARKET, BY APPLICATION TYPE, VALUE, USD MILLION, 2017 - 2029
- Figure 35:
- AUSTRALIA E-BIKE MARKET, BY APPLICATION TYPE, VALUE SHARE (%), 2022 - 2029
- Figure 36:
- AUSTRALIA E-BIKE MARKET, BY APPLICATION TYPE, VOLUME, UNITS, 2017 - 2029
- Figure 37:
- AUSTRALIA E-BIKE MARKET, BY APPLICATION TYPE, VALUE, USD MILLION, 2017 - 2029
- Figure 38:
- AUSTRALIA E-BIKE MARKET, BY APPLICATION TYPE, VALUE SHARE (%), 2022 - 2029
- Figure 39:
- AUSTRALIA E-BIKE MARKET, BY APPLICATION TYPE, VOLUME, UNITS, 2017 - 2029
- Figure 40:
- AUSTRALIA E-BIKE MARKET, BY APPLICATION TYPE, VALUE, USD MILLION, 2017 - 2029
- Figure 41:
- AUSTRALIA E-BIKE MARKET, BY APPLICATION TYPE, VALUE SHARE (%), 2022 - 2029
- Figure 42:
- AUSTRALIA E-BIKE MARKET, BY BATTERY TYPE, VOLUME, UNITS, 2017 - 2029
- Figure 43:
- AUSTRALIA E-BIKE MARKET, BY BATTERY TYPE, VALUE, USD MILLION, 2017 - 2029
- Figure 44:
- AUSTRALIA E-BIKE MARKET, BY BATTERY TYPE, VOLUME, SHARE (%), 2017 - 2029
- Figure 45:
- AUSTRALIA E-BIKE MARKET, BY BATTERY TYPE, VALUE, SHARE (%), 2017 - 2029
- Figure 46:
- AUSTRALIA E-BIKE MARKET, BY BATTERY TYPE, VOLUME, UNITS, 2017 - 2029
- Figure 47:
- AUSTRALIA E-BIKE MARKET, BY BATTERY TYPE, VALUE, USD MILLION, 2017 - 2029
- Figure 48:
- AUSTRALIA E-BIKE MARKET, BY BATTERY TYPE, VALUE SHARE (%), 2022 - 2029
- Figure 49:
- AUSTRALIA E-BIKE MARKET, BY BATTERY TYPE, VOLUME, UNITS, 2017 - 2029
- Figure 50:
- AUSTRALIA E-BIKE MARKET, BY BATTERY TYPE, VALUE, USD MILLION, 2017 - 2029
- Figure 51:
- AUSTRALIA E-BIKE MARKET, BY BATTERY TYPE, VALUE SHARE (%), 2022 - 2029
- Figure 52:
- AUSTRALIA E-BIKE MARKET, BY BATTERY TYPE, VOLUME, UNITS, 2017 - 2029
- Figure 53:
- AUSTRALIA E-BIKE MARKET, BY BATTERY TYPE, VALUE, USD MILLION, 2017 - 2029
- Figure 54:
- AUSTRALIA E-BIKE MARKET, BY BATTERY TYPE, VALUE SHARE (%), 2022 - 2029
- Figure 55:
- AUSTRALIA E-BIKE MARKET, MOST ACTIVE COMPANIES, BY NUMBER OF STRATEGIC MOVES, 2018 - 2021
- Figure 56:
- AUSTRALIA E-BIKE MARKET, MOST ADOPTED STRATEGIES, 2018 - 2021
- Figure 57:
- AUSTRALIA E-BIKE MARKET SHARE(%), BY MAJOR PLAYERS, 2022
Australia E- Bike Industry Segmentation
Pedal Assisted, Speed Pedelec, Throttle Assisted are covered as segments by Propulsion Type. Cargo/Utility, City/Urban, Trekking are covered as segments by Application Type. Lead Acid Battery, Lithium-ion Battery, Others are covered as segments by Battery Type.| Propulsion Type | |
| Pedal Assisted | |
| Speed Pedelec | |
| Throttle Assisted |
| Application Type | |
| Cargo/Utility | |
| City/Urban | |
| Trekking |
| Battery Type | |
| Lead Acid Battery | |
| Lithium-ion Battery | |
| Others |
Market Definition
- By Application Type - E-bikes considered under this segment include city/urban, trekking, and cargo/utility e-bikes. The common types of e-bikes under these three categories include off-road/hybrid, kids, ladies/gents, cross, MTB, folding, fat tire, and sports e-bike.
- By Battery Type - This segment includes lithium-ion batteries, lead-acid batteries, and other battery types. The other battery type category includes nickel-metal hydroxide (NiMH), silicon, and lithium-polymer batteries.
- By Propulsion Type - E-bikes considered under this segment include pedal-assisted e-bikes, throttle-assisted e-bikes, and speed pedelec. While the speed limit of pedal and throttle-assisted e-bikes is usually 25 km/h, the speed limit of speed pedelec is generally 45 km/h (28 mph).
Research Methodology
Mordor Intelligence follows a four-step methodology in all our reports.
- Step-1: Identify Key Variables: In order to build a robust forecasting methodology, the variables and factors identified in Step-1 are tested against available historical market numbers. Through an iterative process, the variables required for market forecast are set and the model is built on the basis of these variables.
- Step-2: Build a Market Model: Market-size estimations for the historical and forecast years have been provided in revenue and volume terms. For sales conversion to volume, the average selling price (ASP) is kept constant throughout the forecast period for each country, and inflation is not a part of the pricing.
- Step-3: Validate and Finalize: In this important step, all market numbers, variables and analyst calls are validated through an extensive network of primary research experts from the market studied. The respondents are selected across levels and functions to generate a holistic picture of the market studied.
- Step-4: Research Outputs: Syndicated Reports, Custom Consulting Assignments, Databases & Subscription Platforms


