Canada Data Center Market Size

| Icons | Lable | Value |
|---|---|---|
|
|
Study Period | 2017 - 2029 |
|
|
Base Year For Estimation | 2022 |
|
|
CAGR | 8.94 % |
|
|
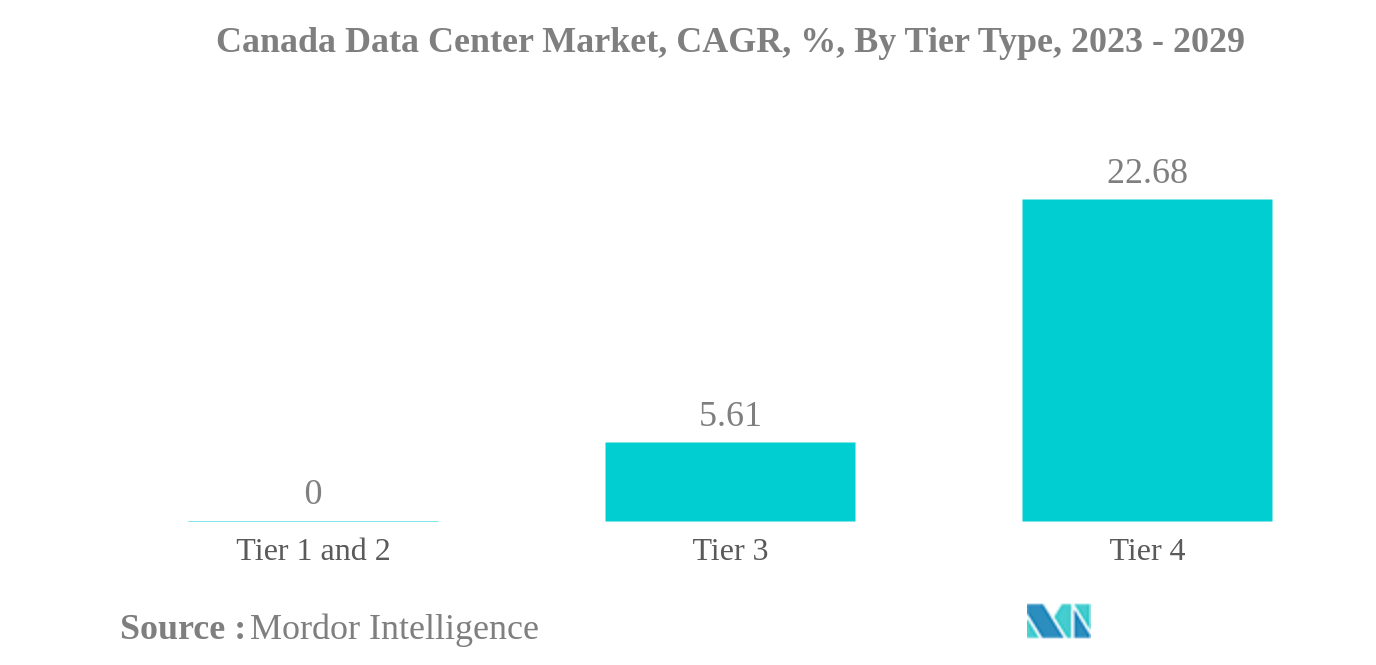
Largest Share by Tier Type | Tier 3 |
|
|
Fastest Growing by Tier Type | Tier 4 |
|
|
Market Concentration | High |
Major Players |
||
|
|
||
|
*Disclaimer: Major Players sorted in no particular order |
Canada Data Center Market Analysis
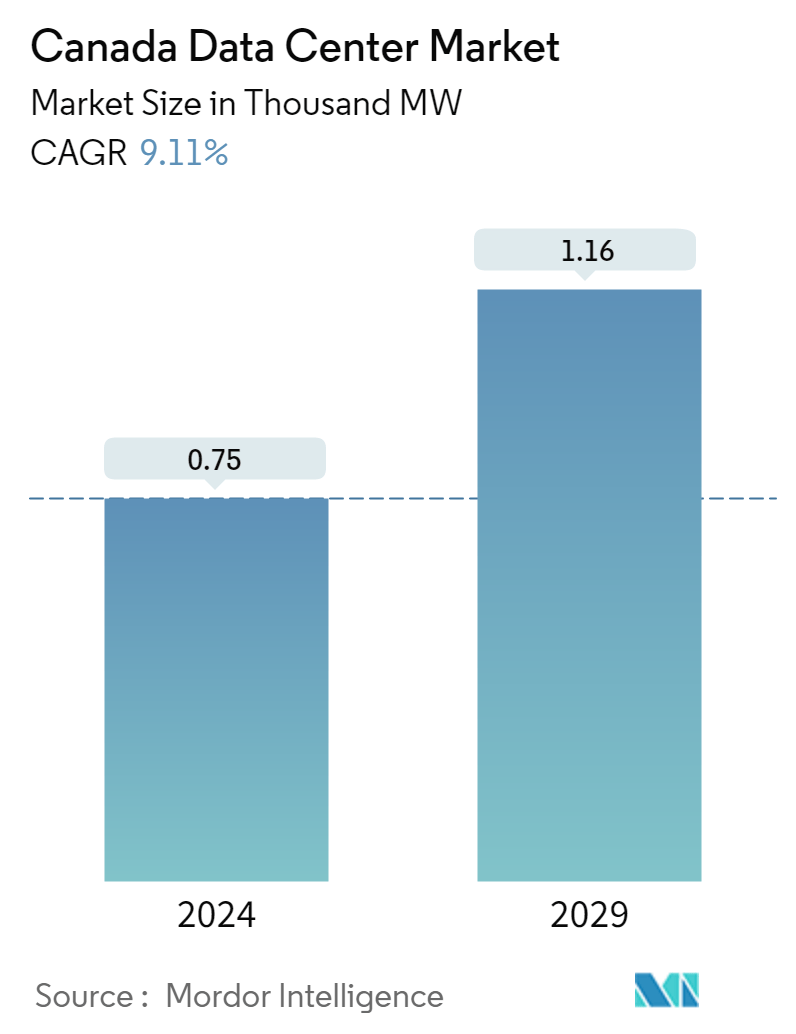
The Canada Data Center Market is projected to register a CAGR of 8.94%
- IT Load Capacity: The IT load capacity of the data center market will have steady growth and is expected to reach 1,159.6 MW by 2029.
- Raised Floor Space: The total raised floor area of the country is expected to increase to 5.3 million sq. ft by 2029.
- Installed Racks: The number of installed racks is expected to reach 289,890 units by 2029. Quebec is expected to house the maximum number of racks by 2029.
- DC Facilities: Good connectivity, growing demand for IoT, and increasing government incentives for land and tax are some factors that have triggered the growth of data center facilities in Canada.
- Leading Market Player: Vantage Data Centers LLC led the market in 2022 with a share of 25% and an operational capacity of 158 MW, followed by companies such as Stack Infrastructure at 20.5% with an operating capacity of 129.9 MW.
Canada Data Center Market Trends
This section covers the major market trends shaping the Canada Data Center Market according to our research experts:
Tier 3 is the largest Tier Type
- Increased use of IoT platforms by varying sectors, such as manufacturing, agriculture, and cities, has contributed to the growing data consumption, which has triggered the demand for data centers in Canada.
- For instance, out of the 189,874 farms in Canada, autosteer equipment are currently used by 27%, GPS mapping by 13%, drone usage at 3.5%, and robotic milkers at 1.2%. Agriculture IoT may help farmers increase their profitability by providing real-time insights about the crops.
- Similarly, IoT platforms used in the manufacturing sector may help companies improvise supply chain processes and increase their profitability. As IoT platforms have started gaining traction, these huge amounts of generated data may require an increasing number of servers to process them faster.
- Since tier 4 data centers offer higher bandwidth speed, low latency, better connectivity, disaster recovery options and others, most companies opt for tier 4 data centers. These data centers help companies cater to their growing business requirements, optimize efficiency, and offer better services to the consumer. Tier 4 data centers are anticipated to record a CAGR of 22.68%, which is quite higher than the growth of tier 3 at 5.79% and tier 1&2 at 0.76%.
Canada Data Center Industry Overview
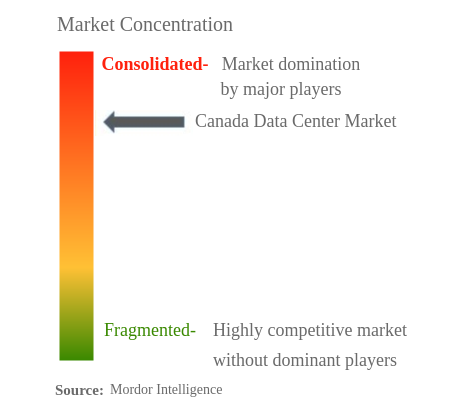
The Canada Data Center Market is fairly consolidated, with the top five companies occupying 87.02%. The major players in this market are Cologix, Inc., Digital Realty Trust, Inc., Equinix, Inc., eStruxture Data Centers Inc. and Vantage Data Centers, LLC (sorted alphabetically).
Canada Data Center Market Leaders
Cologix, Inc.
Digital Realty Trust, Inc.
Equinix, Inc.
eStruxture Data Centers Inc.
Vantage Data Centers, LLC
*Disclaimer: Major Players sorted in no particular order
Canada Data Center Market News
- June 2022: Cologix announced its continued strategic partnership with Console Connect by PCCW Global by deploying the Console Connect Software-Defined Interconnection platform at Cologix’s TOR1 data center in Toronto. This marked Console Connect’s second PoP within Cologix’s Canadian market and interconnection ecosystem. The first was available in December 2021 at Cologix’s MTL7 data center in Montréal.
- May 2022: NetIX, the Bulgarian global platform, partnered with data center company eStruxture to provide global connectivity solutions in Canada. According to eStruxture, the collaboration would enable customers to access all of NetIX’s global locations, Internet Exchange Points (IXPs), and NetIX’s Global Internet Exchange (GIX) peering solutions directly from any one of eStruxture’s data centers through the Tunnelling over Internet (ToI) service.
- March 2022: Vantage Data Centers announced the investment of an additional CAD 900 million to scale its Canadian operations rapidly. These included the development of a third campus in Montreal and the expansion of two existing campuses in Montreal and Quebec City. These developments would bring the total number of Vantage campuses in the Province of Quebec to 4.
Canada Data Center Market Report - Table of Contents
1. INTRODUCTION
1.1. Study Assumptions & Market Definition
1.2. Scope of the Study
1.3. Research Methodology
2. MARKET OUTLOOK
2.1. IT Load Capacity
2.2. Raised Floor Space
2.3. Colocation Revenue
2.4. Installed Racks
2.5. Rack Space Utilization
2.6. Submarine Cable
3. KEY INDUSTRY TRENDS
3.1. Smartphone Users
3.2. Data Traffic Per Smartphone
3.3. Mobile Data Speed
3.4. Broadband Data Speed
3.5. Fiber Connectivity Network
3.6. Regulatory Framework
3.7. Value Chain & Distribution Channel Analysis
4. MARKET SEGMENTATION
4.1. Hotspot
4.1.1. Ontario
4.1.2. Quebec
4.1.3. Rest of Canada
4.2. Data Center Size
4.2.1. Large
4.2.2. Massive
4.2.3. Medium
4.2.4. Mega
4.2.5. Small
4.3. Tier Type
4.3.1. Tier 1 and 2
4.3.2. Tier 3
4.3.3. Tier 4
4.4. Absorption
4.4.1. Non-Utilized
4.4.2. Utilized
4.4.2.1. By Colocation Type
4.4.2.1.1. Hyperscale
4.4.2.1.2. Retail
4.4.2.1.3. Wholesale
4.4.2.2. By End User
4.4.2.2.1. BFSI
4.4.2.2.2. Cloud
4.4.2.2.3. E-Commerce
4.4.2.2.4. Government
4.4.2.2.5. Manufacturing
4.4.2.2.6. Media & Entertainment
4.4.2.2.7. Telecom
4.4.2.2.8. Other End User
5. COMPETITIVE LANDSCAPE
5.1. Market Share Analysis
5.2. Company Landscape
5.3. Company Profiles
5.3.1. Beanfield Technologies, Inc. (Beanfield Metroconnect)
5.3.2. CentriLogic, Inc.
5.3.3. Cologix, Inc.
5.3.4. Core Data Centres, Inc.
5.3.5. Cyxtera Technologies
5.3.6. Digital Realty Trust, Inc.
5.3.7. Equinix, Inc.
5.3.8. eStruxture Data Centers Inc.
5.3.9. Fibre Centre
5.3.10. Rack and data
5.3.11. Sungard Availability Services LP
5.3.12. Vantage Data Centers, LLC
5.4. LIST OF COMPANIES STUDIED
6. KEY STRATEGIC QUESTIONS FOR DATA CENTER CEOS
7. APPENDIX
7.1. Global Overview
7.1.1. Overview
7.1.2. Porter’s Five Forces Framework
7.1.3. Global Value Chain Analysis
7.1.4. Global Market Size and DROs
7.2. Sources & References
7.3. List of Tables & Figures
7.4. Primary Insights
7.5. Data Pack
7.6. Glossary of Terms
List of Tables & Figures
- Figure 1:
- CANADA DATA CENTER MARKET, RAISED FLOOR SPACE, VOLUME IN SQ. FT.(000'), 2017 - 2029
- Figure 2:
- CANADA DATA CENTER MARKET, COLOCATION REVENUE, VALUE IN USD MILLION, 2017 - 2029
- Figure 3:
- CANADA DATA CENTER MARKET, INSTALLED RACKS, VALUE IN UNIT, 2017 - 2029
- Figure 4:
- CANADA DATA CENTER MARKET, RACK SPACE UTILIZATION, VALUE IN (%), 2017 - 2029
- Figure 5:
- CANADA DATA CENTER MARKET, SMARTPHONE USERS, VOLUME IN MILLION, 2017 - 2029
- Figure 6:
- CANADA DATA CENTER MARKET, DATA TRAFFIC PER SMARTPHONE, VOLUME IN GB, 2017 - 2029
- Figure 7:
- CANADA DATA CENTER MARKET, MOBILE DATA SPEED, VOLUME IN MBPS, 2017 - 2029
- Figure 8:
- CANADA DATA CENTER MARKET, BROADBAND SPEED, VOLUME IN MBPS, 2017 - 2029
- Figure 9:
- CANADA DATA CENTER MARKET, FIBER CONNECTIVITY NETWORK, VOLUME IN KILOMETER, 2017 - 2029
- Figure 10:
- CANADA DATA CENTER MARKET, VOLUME, MW, 2017 - 2029
- Figure 11:
- CANADA DATA CENTER MARKET, BY HOTSPOT, VOLUME IN MW, 2017 - 2029
- Figure 12:
- CANADA DATA CENTER MARKET, SHARE(%), BY HOTSPOT, 2017 - 2023 - 2029
- Figure 13:
- CANADA DATA CENTER MARKET, ONTARIO, VOLUME IN MW, 2017 - 2029
- Figure 14:
- CANADA DATA CENTER MARKET, BY DATA CENTER SIZE, ONTARIO, VOLUME SHARE (%), 2022 - 2029
- Figure 15:
- CANADA DATA CENTER MARKET, QUEBEC, VOLUME IN MW, 2017 - 2029
- Figure 16:
- CANADA DATA CENTER MARKET, BY DATA CENTER SIZE, QUEBEC, VOLUME SHARE (%), 2022 - 2029
- Figure 17:
- CANADA DATA CENTER MARKET, REST OF CANADA, VOLUME IN MW, 2017 - 2029
- Figure 18:
- CANADA DATA CENTER MARKET, BY DATA CENTER SIZE, REST OF CANADA, VOLUME SHARE (%), 2022 - 2029
- Figure 19:
- CANADA DATA CENTER MARKET, BY DATA CENTER SIZE, VOLUME IN MW, 2017 - 2029
- Figure 20:
- CANADA DATA CENTER MARKET, SHARE(%), BY DATA CENTER SIZE, 2017 - 2023 - 2029
- Figure 21:
- CANADA DATA CENTER MARKET, LARGE, VOLUME IN MW, 2017 - 2029
- Figure 22:
- CANADA DATA CENTER MARKET, MASSIVE, VOLUME IN MW, 2017 - 2029
- Figure 23:
- CANADA DATA CENTER MARKET, MEDIUM, VOLUME IN MW, 2017 - 2029
- Figure 24:
- CANADA DATA CENTER MARKET, MEGA, VOLUME IN MW, 2017 - 2029
- Figure 25:
- CANADA DATA CENTER MARKET, SMALL, VOLUME IN MW, 2017 - 2029
- Figure 26:
- CANADA DATA CENTER MARKET, BY TIER TYPE, VOLUME IN MW, 2017 - 2029
- Figure 27:
- CANADA DATA CENTER MARKET, SHARE(%), BY TIER TYPE, 2017 - 2023 - 2029
- Figure 28:
- CANADA DATA CENTER MARKET, TIER 1&2, VOLUME IN MW, 2017 - 2029
- Figure 29:
- CANADA DATA CENTER MARKET, TIER 3, VOLUME IN MW, 2017 - 2029
- Figure 30:
- CANADA DATA CENTER MARKET, TIER 4, VOLUME IN MW, 2017 - 2029
- Figure 31:
- CANADA DATA CENTER MARKET, BY ABSORPTION, VOLUME IN MW, 2017 - 2029
- Figure 32:
- CANADA DATA CENTER MARKET, SHARE(%), BY ABSORPTION, 2017 - 2023 - 2029
- Figure 33:
- CANADA DATA CENTER MARKET, NON-UTILIZED, VOLUME IN MW, 2017 - 2029
- Figure 34:
- CANADA DATA CENTER MARKET, BY COLOCATION TYPE, VOLUME IN MW, 2017 - 2029
- Figure 35:
- CANADA DATA CENTER MARKET, SHARE(%), BY COLOCATION TYPE, 2017 - 2023 - 2029
- Figure 36:
- CANADA DATA CENTER MARKET, HYPERSCALE, VOLUME IN MW, 2017 - 2029
- Figure 37:
- CANADA DATA CENTER MARKET, RETAIL, VOLUME IN MW, 2017 - 2029
- Figure 38:
- CANADA DATA CENTER MARKET, WHOLESALE, VOLUME IN MW, 2017 - 2029
- Figure 39:
- CANADA DATA CENTER MARKET, BY END USER, VOLUME IN MW, 2017 - 2029
- Figure 40:
- CANADA DATA CENTER MARKET, SHARE(%), BY END USER, 2017 - 2023 - 2029
- Figure 41:
- CANADA DATA CENTER MARKET, BFSI, VOLUME IN MW, 2017 - 2029
- Figure 42:
- CANADA DATA CENTER MARKET, CLOUD, VOLUME IN MW, 2017 - 2029
- Figure 43:
- CANADA DATA CENTER MARKET, E-COMMERCE, VOLUME IN MW, 2017 - 2029
- Figure 44:
- CANADA DATA CENTER MARKET, GOVERNMENT, VOLUME IN MW, 2017 - 2029
- Figure 45:
- CANADA DATA CENTER MARKET, MANUFACTURING, VOLUME IN MW, 2017 - 2029
- Figure 46:
- CANADA DATA CENTER MARKET, MEDIA & ENTERTAINMENT, VOLUME IN MW, 2017 - 2029
- Figure 47:
- CANADA DATA CENTER MARKET, TELECOM, VOLUME IN MW, 2017 - 2029
- Figure 48:
- CANADA DATA CENTER MARKET, OTHER END USER, VOLUME IN MW, 2017 - 2029
- Figure 49:
- CANADA DATA CENTER MARKET, BY MAJOR PLAYER IT LOAD CAPACITY, 2022
Canada Data Center Industry Segmentation
Ontario, Quebec are covered as segments by Hotspot. Large, Massive, Medium, Mega, Small are covered as segments by Data Center Size. Tier 1 and 2, Tier 3, Tier 4 are covered as segments by Tier Type. Non-Utilized, Utilized are covered as segments by Absorption.| Hotspot | |
| Ontario | |
| Quebec | |
| Rest of Canada |
| Data Center Size | |
| Large | |
| Massive | |
| Medium | |
| Mega | |
| Small |
| Tier Type | |
| Tier 1 and 2 | |
| Tier 3 | |
| Tier 4 |
| Absorption | |||||||||||||||||
| Non-Utilized | |||||||||||||||||
|
Market Definition
- IT LOAD CAPACITY - The IT load capacity or installed capacity, refers to the amount of energy consumed by servers and network equipments placed in a rack installed. It is measured in megawatt (MW).
- ABSORPTION RATE - It denotes the extend to which the data center capacity has been leased out. For instance, a 100 MW DC has leased out 75 MW, then absorption rate would be 75%. It is also referred as utilization rate and leased-out capacity.
- RAISED FLOOR SPACE - It is an elevated space build over the floor. This gap between the original floor and the elevated floor is used to accommodate wiring, cooling, and other data center equipment. This arrangement assist in having proper wiring and cooling infrastructure. It is measured in square feet (ft^2).
- DATA CENTER SIZE - Data Center Size is segmented based on the raised floor space allocated to the data center facilities. Mega DC - # of Racks must be more than 9000 or RFS (raised floor space) must be more than 225001 Sq. ft; Massive DC - # of Racks must be in between 9000 and 3001 or RFS must be in between 225000 Sq. ft and 75001 Sq. ft; Large DC - # of Racks must be in between 3000 and 801 or RFS must be in between 75000 Sq. ft and 20001 Sq. ft; Medium DC # of Racks must be in between 800 and 201 or RFS must be in between 20000 Sq. ft and 5001 Sq. ft; Small DC - # of Racks must be less than 200 or RFS must be less than 5000 Sq. ft.
- TIER TYPE - According to Uptime Institute the data centers are classified into four tiers based on the proficiencies of redundant equipment of the data center infrastructure. In this segment the data center are segmented as Tier 1,Tier 2, Tier 3 and Tier 4.
- COLOCATION TYPE - The segment is segregated into 3 categories namely Retail, Wholesale and Hyperscale Colocation service. The categorization is done based on the amount of IT load leased out to potential customers. Retail colocation service has leased capacity less than 250 kW; Wholesale colocation services has leased capacity between 251 kW and 4 MW and Hyperscale colocation services has leased capacity more than 4 MW.
- END CONSUMERS - The Data Center Market operates on a B2B basis. BFSI, Government, Cloud Operators, Media and Entertainment, E-Commerce, Telecom and Manufacturing are the major end-consumers in the market studied. The scope only includes colocation service operators catering to the increasing digitalization of the end-user industries.
Research Methodology
Mordor Intelligence follows a four-step methodology in all our reports.
- Step-1: Identify Key Variables: In order to build a robust forecasting methodology, the variables and factors identified in Step-1 are tested against available historical market numbers. Through an iterative process, the variables required for market forecast are set and the model is built on the basis of these variables.
- Step-2: Build a Market Model: Market-size estimations for the forecast years are in nominal terms. Inflation is not a part of the pricing, and the average selling price (ASP) is kept constant throughout the forecast period for each country.
- Step-3: Validate and Finalize: In this important step, all market numbers, variables and analyst calls are validated through an extensive network of primary research experts from the market studied. The respondents are selected across levels and functions to generate a holistic picture of the market studied.
- Step-4: Research Outputs: Syndicated Reports, Custom Consulting Assignments, Databases & Subscription Platforms


