Data Visualization Market Size
| Study Period | 2018 - 2028 |
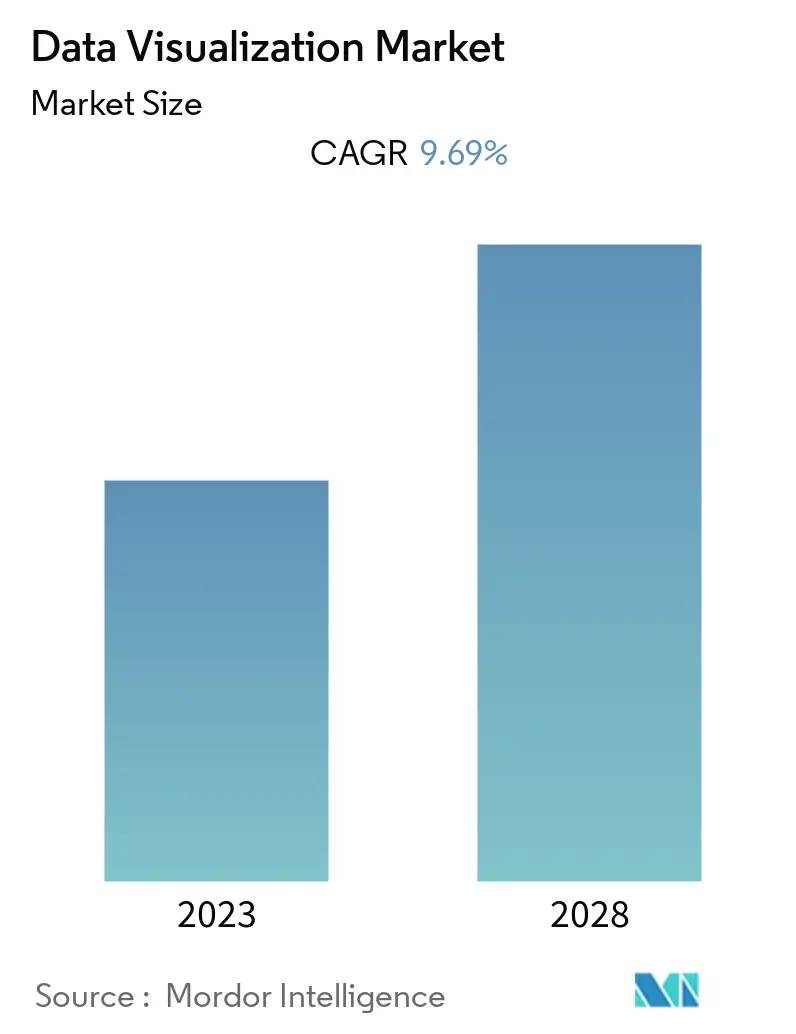
| Market Size (2023) | USD 19.81 Billion |
| Market Size (2028) | USD 19.91 Billion |
| CAGR (2023 - 2028) | 0.10 % |
| Fastest Growing Market | Asia Pacific |
| Largest Market | North America |
Major Players
*Disclaimer: Major Players sorted in no particular order |
Need a report that reflects how COVID-19 has impacted this market and its growth?
Data Visualization Market Analysis
The Data Visualization Market size is expected to grow from USD 19.81 billion in 2023 to USD 19.91 billion by 2028, at a CAGR of 0.10% during the forecast period (2023-2028).
The emerging nature of data visualization encourages a shift toward analytically driven businesses, where users can explore data in various forms of graphical representation, initially only available in tabular reports.
- Across many industries, businesses are realizing the benefits of data-driven decision-making. Extracting useful information from big, complicated databases is becoming increasingly important. Data visualization is essential for demystifying complex information and presenting it in a visually appealing manner that is simple to comprehend and analyze. As companies look for ways to extract valuable insights from their data, inference implies that the market for data visualization tools will keep growing. Decision-makers may find patterns, trends, and correlations by efficiently visualizing data, which helps them make more well-informed strategic decisions.
- The term "augmented reality" refers to a technology that overlays digital data, such as visualizations, on the physical environment. A new development that has the potential to change the market completely is the incorporation of AR with data visualization tools. AR can give consumers an immersive and engaging experience that enables them to explore and analyze data in novel ways by superimposing data visualizations onto real-world objects or environments. This technology can be used in several fields, including manufacturing, healthcare, and retail, where real-time data visualization in a geographical context can improve judgment, training, and consumer interaction.
- The combination of natural language processing and conversational interfaces is another distinctive market driver for data visualization. NLP enables computers to comprehend, translate, and produce human language, allowing users to communicate with data visualization tools using natural language instructions or queries. Through dialogues with the system, users can ask questions, request certain visualizations, or examine data by utilizing NLP. Due to its lower learning curve than conventional graphical user interfaces, this driver may make data visualization more approachable to a wider audience. Additionally, it creates possibilities for data-driven decision-making via voice-enabled gadgets like smart speakers and virtual assistants.
- Data privacy and security have become major concerns as the volume of data being generated and analyzed continues to increase. Inference suggests that organizations and individuals are becoming more aware of the potential risks associated with data breaches and unauthorized access to sensitive information. This heightened awareness has led to stricter regulations, such as the General Data Protection Regulation (GDPR) in the European Union and the California Consumer Privacy Act (CCPA) in the United States. These regulations impose limitations on how organizations collect, store, and process personal data.
- COVID-19 brought about unprecedented challenges, requiring organizations to focus on crisis management and business continuity. Data visualization played a vital role in helping businesses monitor key metrics, identify potential risks, and develop strategies to mitigate the impact of the pandemic. Visualizations enabled organizations to track supply chain disruptions, analyze customer behavior shifts, and monitor the financial health of their businesses. By visualizing these critical insights, organizations could respond more effectively to the crisis and adapt their operations to ensure business continuity. There has also been an impact of the Russia-Ukraine war on the overall packaging ecosystem.
Data Visualization Market Trends
This section covers the major market trends shaping the Data Visualization Market according to our research experts:
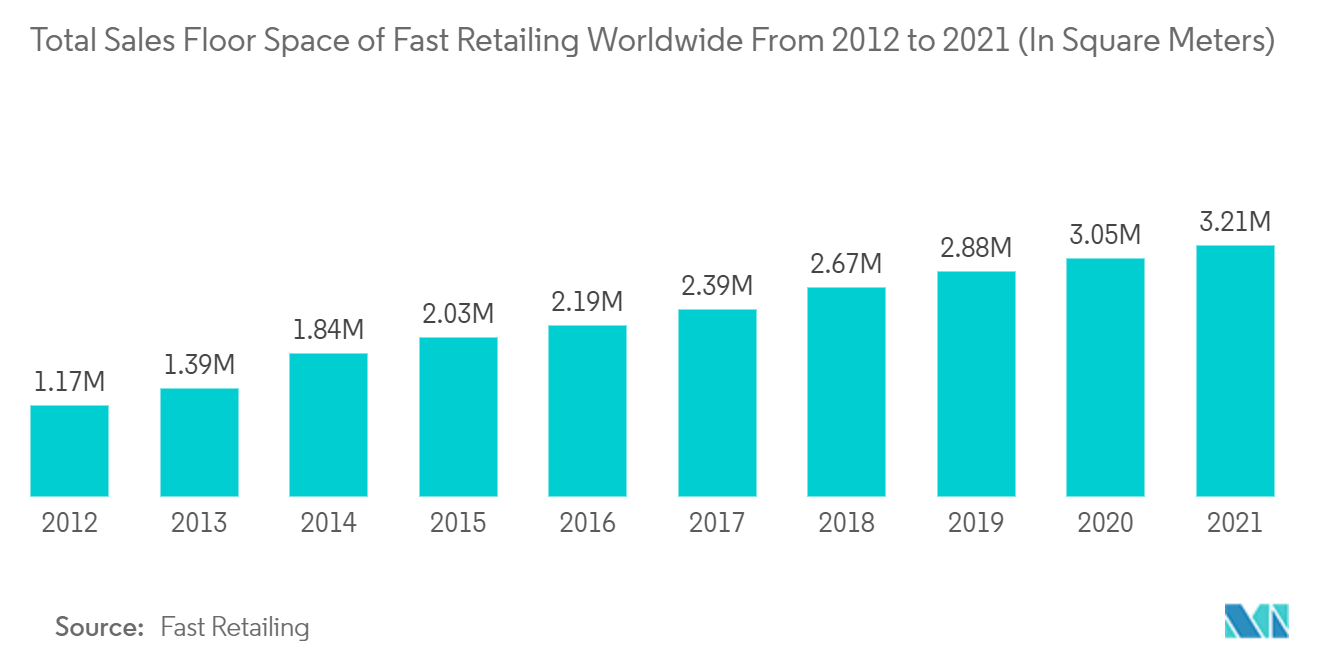
Retail to Witness Significant Growth
- The retail sector is witnessing massive growth in the amount of data generated from various channels, such as social sites, blogs, and apps. Most of the unstructured data produced are left unused, which, if utilized, may provide valuable information. The incorporation of the Internet of Things (IoT) in the retail sector has increased over the past few years through the increased utilization of devices, such as RFID and sensors.
- The retail industry utilizes data visualization tools as real-time decision support systems. With real-time analytics, it becomes easy for retail organizations to detect events, such as low inventory or high customer traffic, without writing custom code for alerts for every possible scenario that needs attention. This would enable even non-technical staff to monitor these events easily and respond immediately.
- Retailers worldwide are trying to embrace data visualization to understand their customers at every stage of the retail process. Data visualization tools provide the benefit of predicting trends, product demand, and competitive intelligence, thereby reaping the maximum profit potential.
- According to Accenture and the Retail Industry Leaders Association (RILA), the importance of retailers providing personalized shopping experiences has increased, indicating an evolved definition of retail that requires meeting customers' requirements. It also enables manufacturers to go for mass customization.
- Retailers have been focusing on enhancing their connectivity, communication solutions, and devices, generating a massive amount of big data. This is further analyzed to study a consumer's pattern and purchasing behavior, which in turn is expected to propel market growth over the forecast period.
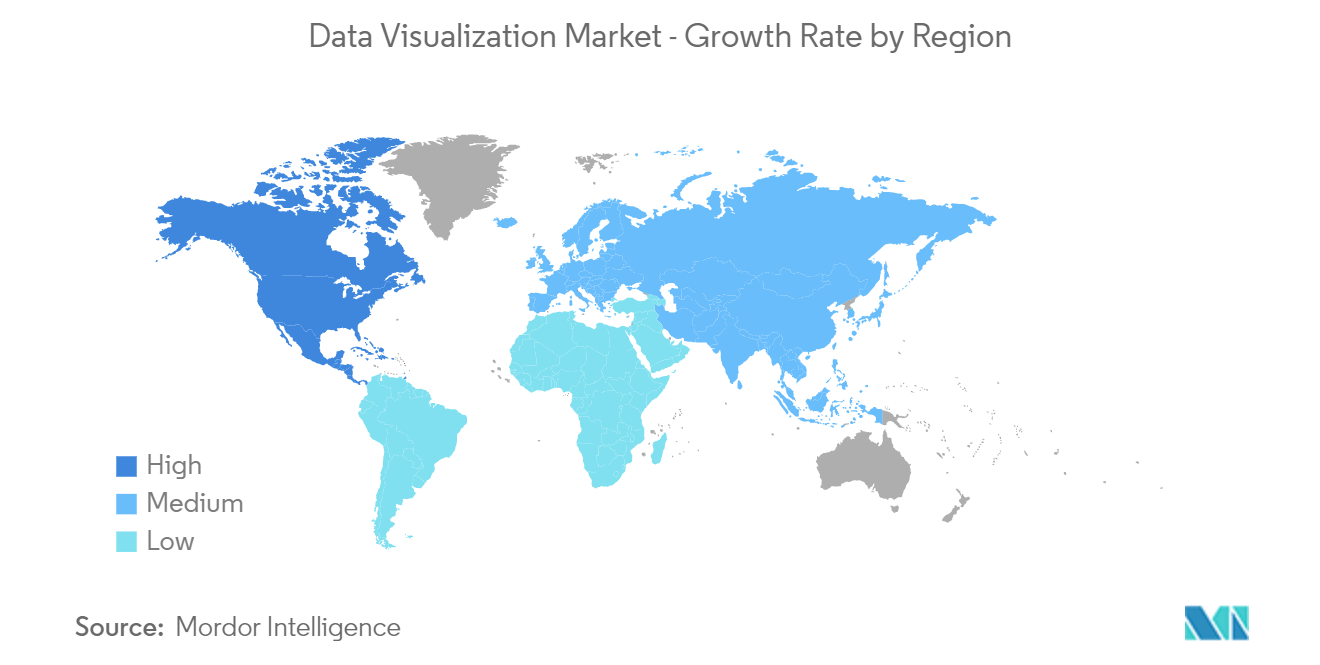
North America to Hold Significant Share
- North America is a prominent market owing to the growing adoption of advanced technologies by end-user industries across the region. Moreover, the area has a strong foothold of vendors, contributing to the market's growth. Data visualization applications in North America are driven by factors such as growth in big data and the need for analytics in the retail sector.
- The US data visualization market is witnessing healthy growth due to the increasing amount of data generated in small- and medium-scale firms. For instance, a massive amount of data is being developed on digital information platforms every day. According to IBM Corporation, 2.5 quintillion bytes of data are generated daily.
- In July 2021, the United States Coast Guard adopted COVID-19 data visualization tools to assist commanders in making informed decisions on everything from vaccine distribution to operational readiness and has taken precautions to guarantee that the new technologies do not compromise guardsmen's privacy and security. The program aims to teach situational awareness and perspective, and it should not directly impact individuals.
- The implementation of data-driven decision-making is also rising in Canadian markets across various sectors. Cloud business management solutions vendor Sage launched its cloud-first Sage Data and Analytics service integration for Sage 300 and Sage 100 in the US and Canadian markets in March 2021. Its business intelligence toolkit can provide users with live sales dashboards and detailed P&L reports with the help of AI and machine learning algorithms. Such innovations are expected to drive the studied market.
- An increasing need to track data from various sources and compile it into different data representations to make critical business decisions can be observed in North America, as this region is a significant market for technology-based solutions.
Data Visualization Industry Overview
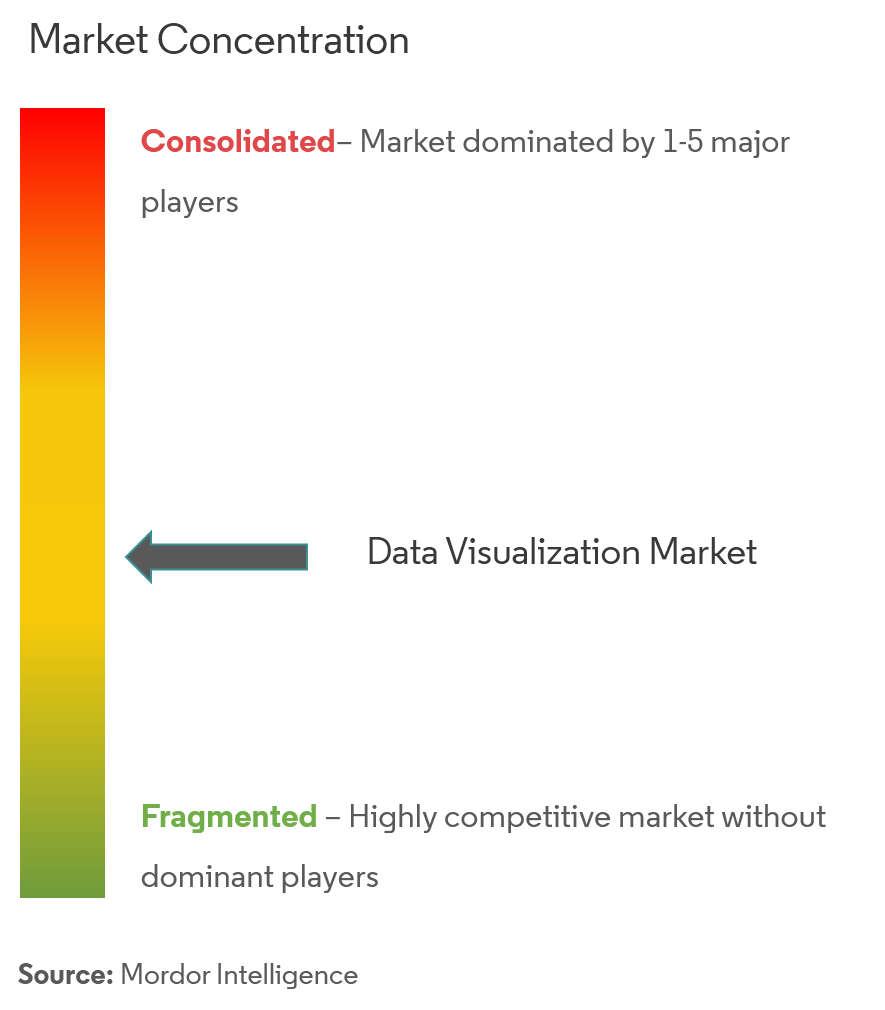
The data visualization market is moderately competitive. The players in the market are innovating in providing strategic solutions to increase their market presence and customer base. This enables them to secure new contracts and tap new markets.
- September 2022: To make Grafana natively compatible with the Azure cloud platform, Microsoft and Grafana Labs have established a strategic agreement. Azure Monitor and Azure Data Explorer are just two cloud services that Microsoft's new Azure Managed Grafana service offers native connections. Version 9.0 of Microsoft's Azure Managed Grafana includes a better alerting feature to inform IT administrators of potential technical difficulties. Zone redundancy and support for an API key are also included in this edition.
- December 2021: To automate data storytelling capabilities to its existing cache of natural language processing tools, Salesforce has acquired Narrative Science, a technology company based in Chicago.
- July 2021: Observable's data visualization platform expanded with the debut of a new enterprise solution. Individuals can make data visualizations for free with Observable's free tier. The Teams tier is on top of that, allowing smaller groups to cooperate on data virtualization using private data sources. The new Enterprise tier is available for enterprises with 25 or more users.
Data Visualization Market Leaders
Salesforce.com Inc.
Microsoft Corporation
SAP SE
SAS Institute Inc.
Oracle Corporation
*Disclaimer: Major Players sorted in no particular order
Data Visualization Market News
- September 2022: To assist industrial organizations in viewing various operational data sources through a single, intelligent dashboard set up in a matter of hours, SymphonyAI Industrial has introduced KPI 360, an AI-driven solution that uses real-time data monitoring and prediction.
- January 2022: INT, a data visualization software company, released the latest edition of IVAAP, its ubiquitous subsurface visualization, and analytics application platform. IVAAP allows users to explore, visualize, and compute energy data with complete OSDU Data Platform compatibility. The latest update also adds 3D seismic volume intersection, 2D seismic overlays, reservoir, and base map widgets to IVAAP's map-based search, data discovery, and data selection to show all energy data types in the cloud.
Data Visualization Market Report - Table of Contents
1. INTRODUCTION
1.1 Study Deliverables
1.2 Study Assumptions
1.3 Scope of the Study
2. RESEARCH METHODOLOGY
3. EXECUTIVE SUMMARY
4. MARKET DYNAMICS
4.1 Market Overview
4.2 Industry Attractiveness - Porter's Five Force Analysis
4.2.1 Threat of New Entrants
4.2.2 Bargaining Power of Buyers/Consumers
4.2.3 Bargaining Power of Suppliers
4.2.4 Threat of Substitute Products
4.2.5 Intensity of Competitive Rivalry
4.3 Value Chain Analysis
4.4 Introduction to Market Drivers and Restraints
4.5 Market Drivers
4.5.1 Cloud Deployment of Data Visualization Solutions
4.5.2 Increasing Need for Quick Decision Making
4.6 Market Restraints
4.6.1 Lack of Tech Savvy and Skilled Workforce/Inability
5. TECHNOLOGY ROADMAP
6. MARKET SEGMENTATION
6.1 Organizational Department
6.1.1 Executive Management
6.1.2 Marketing
6.1.3 Operations
6.1.4 Finance
6.1.5 Sales
6.1.6 Other Organizational Departments
6.2 Deployment Mode
6.2.1 On-premise
6.2.2 Cloud/On-demand
6.3 End User
6.3.1 BFSI
6.3.2 IT and Telecommunication
6.3.3 Retail/E-commerce
6.3.4 Education
6.3.5 Manufacturing
6.3.6 Government
6.3.7 Other End Users
6.4 Geography
6.4.1 North America
6.4.2 Europe
6.4.3 Asia Pacific
6.4.4 Latin America
6.4.5 Middle East & Africa
7. COMPETITIVE LANDSCAPE
7.1 Company Profiles
7.1.1 Salesforce.com Inc. (Tableau Software Inc.)
7.1.2 SAP SE
7.1.3 SAS Institute Inc.
7.1.4 Microsoft Corporation
7.1.5 Oracle Corporation
7.1.6 TIBCO Software Inc.
7.1.7 IBM Corporation
7.1.8 Information Builders
7.1.9 Dundas Data Visualization Inc.
7.1.10 Pentaho Corporation
7.1.11 InetSoft Technology Corporation
7.1.12 MicroStrategy Inc.
- *List Not Exhaustive
8. INVESTMENT ANALYSIS
9. MARKET OPPORTUNITIES AND FUTURE TRENDS
Data Visualization Industry Segmentation
Data visualization represents a wide range of business applications. Visualizing data is a concept that is used in different terms and technologies, including dashboards, infographics, scorecards, analytics, big data, and business intelligence. Data Visualization helps extract a meaningful report from the diverse and rapidly increasing volumes of business data. Many users believe that using big data by data visualization helps in better decision-making.
The Data Visualization Market is segmented by Organization Department (Executive Management, Marketing, Operations), Deployment Mode (On-premise, Cloud/On-demand), End User (BFSI, IT and Telecommunication, Education), and Geography.
| Organizational Department | |
| Executive Management | |
| Marketing | |
| Operations | |
| Finance | |
| Sales | |
| Other Organizational Departments |
| Deployment Mode | |
| On-premise | |
| Cloud/On-demand |
| End User | |
| BFSI | |
| IT and Telecommunication | |
| Retail/E-commerce | |
| Education | |
| Manufacturing | |
| Government | |
| Other End Users |
| Geography | |
| North America | |
| Europe | |
| Asia Pacific | |
| Latin America | |
| Middle East & Africa |
Data Visualization Market Research FAQs
How big is the Data Visualization Market?
The Data Visualization Market size is expected to reach USD 19.81 billion in 2023 and grow at a CAGR of 0.10% to reach USD 19.91 billion by 2028.
What is the current Data Visualization Market size?
In 2023, the Data Visualization Market size is expected to reach USD 19.81 billion.
Who are the key players in Data Visualization Market?
Salesforce.com Inc., Microsoft Corporation, SAP SE, SAS Institute Inc. and Oracle Corporation are the major companies operating in the Data Visualization Market.
Which is the fastest growing region in Data Visualization Market?
Asia Pacific is estimated to grow at the highest CAGR over the forecast period (2022-2028).
Which region has the biggest share in Data Visualization Market?
In 2022, the North America accounts for the largest market share in Data Visualization Market.
Data Visualization Tools Industry Report
Statistics for the 2023 Data Visualization Tools market share, size and revenue growth rate, created by Mordor Intelligence™ Industry Reports. Data Visualization Tools analysis includes a market forecast outlook to 2028 and historical overview. Get a sample of this industry analysis as a free report PDF download.
