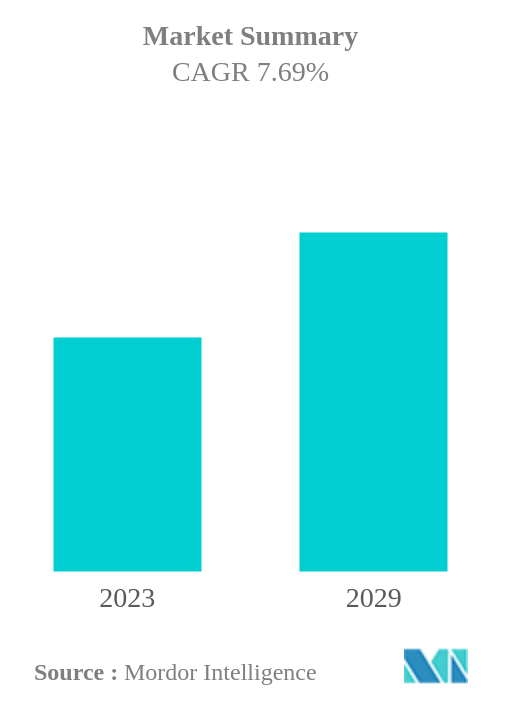
Denmark E-Bike Market Size

| Icons | Lable | Value |
|---|---|---|
|
|
Study Period | 2017 - 2029 |
|
|
Base Year For Estimation | 2022 |
|
|
CAGR | 7.69 % |
|
|
Largest Share by Propulsion Type | Pedal Assisted |
|
|
Fastest Growing by Propulsion Type | Throttle Assisted |
|
|
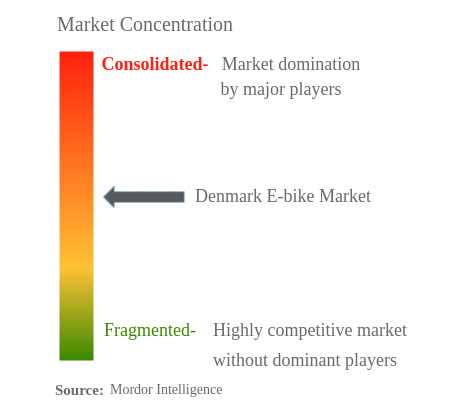
Market Concentration | High |
Major Players |
||
|
|
||
|
*Disclaimer: Major Players sorted in no particular order |
Denmark E-Bike Market Analysis
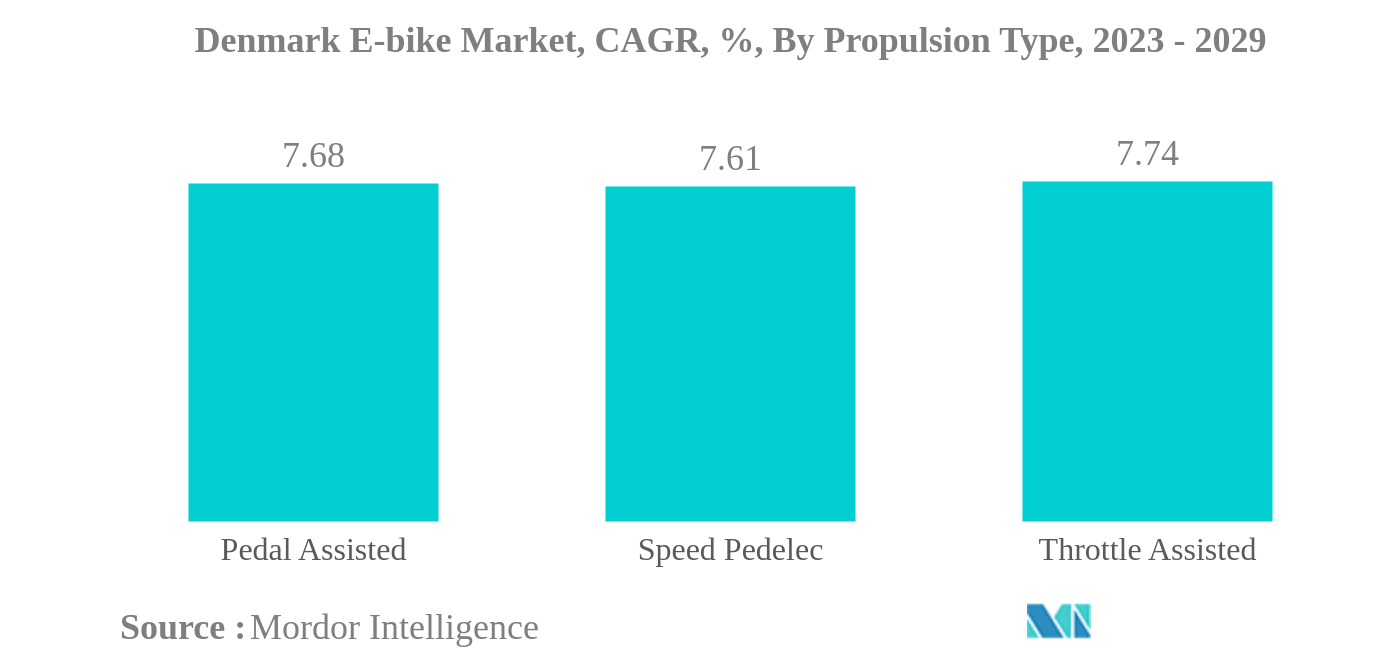
The Denmark E-bike Market is projected to register a CAGR of 7.69%
- Largest Segment by Propulsion Type - Pedal Assisted : Ease of traveling, suitability for recreational activities, ease of carrying heavy loads, and ensuring the fitness levels of consumers are some factors making pedal-assisted e-bikes the largest propulsion-type segment.
- Largest Segment by Application Type - City/Urban : The adoption of bicycles for daily commutes to nearby places, such as offices and shops, has made the sales of city/urban bikes the largest among applications.
- Largest Segment by Battery Type - Lithium-ion Battery : The increasing adoption of lithium-ion battery-equipped bicycles due to high energy density, high power density, lightweight, and long life has made lithium-ion battery the largest segment in the market.
- Fastest-growing Segment by Propulsion Type - Throttle Assisted : Due to big motors and good speed capability, throttle-assisted bikes perform well in terrains, which attracts consumers and increases the sales of such bikes quickly over other types.
Denmark E-Bike Market Trends
This section covers the major market trends shaping the Denmark E-Bike Market according to our research experts:
Pedal Assisted is the largest segment by Propulsion Type.
- In 2018, the Danish government granted access to e-bikes to utilize the dedicated bicycle lanes in the country, which may impact the sales of e-bikes positively. The Parliament approved speed pedelecs, a super electric bike that can achieve speeds of up to 45 kmph, to be used on cycling lanes in the country. The Danish Parliament also ruled that beginning July 1, 2018, people operating superbikes must be at least 15 years old and wear a helmet, with no requirement for a license or number plate.
- In 2019, Finland, Sweden, Norway, Denmark, and Iceland signed a declaration to work toward carbon neutrality. One of the important aspects of this declaration is to decarbonize the transport sector and encourage local companies, investors, local governments, organizations, and consumers to upscale their efforts toward carbon neutrality.
- However, accidents involving e-bikes have become more severe in the country. A report by the Danish Road Traffic Accident Investigation Board (AIB) deduced that age factors impacted a number of incidents, and riding an e-bike is more challenging for the elderly and those suffering from age-related disabilities. This factor may hinder the market's growth to a certain extent in the country.
Denmark E-Bike Industry Overview
The Denmark E-bike Market is moderately consolidated, with the top five companies occupying 59.00%. The major players in this market are Batavus Intercycle Corporation, MHW Bike-House GmbH (Cube Bikes), Qwic, Royal Dutch Gazelle and Van Moof BV (sorted alphabetically).
Denmark E-Bike Market Leaders
Batavus Intercycle Corporation
MHW Bike-House GmbH (Cube Bikes)
Qwic
Royal Dutch Gazelle
Van Moof BV
*Disclaimer: Major Players sorted in no particular order
Denmark E-Bike Market News
- November 2022: The Stormguard E+, a full-suspension e-bike, is unveiled by Giant. The bicycles will be available for purchase in Europe in 2023 and will cost 7,999 Euros for the E+1 and 6,499 Euros for the E+2.
- August 2022: Evans Cycles reintroduces Cube bikes to all 71 locations, During the height of the pandemic, Cube and Evans Cycles put their commercial relationship on pause due to supply chain issues.
- August 2022: Cube's Hybrid One E-Bike Offers Big Miles For Budget-Minded Cyclists, the Hybrid One packs a Bosch electric motor and urban-focused amenities.
Denmark E-Bike Market Report - Table of Contents
1. INTRODUCTION
1.1. Study Assumptions & Market Definition
1.2. Scope of the Study
1.3. Research Methodology
2. KEY INDUSTRY TRENDS
2.1. Bicycle Sales
2.2. GDP Per Capita
2.3. Inflation Rate
2.4. Adoption Rate Of E-Bikes
2.5. Percent Population/Commuters With 5-15 Km Daily Travel Distance
2.6. Bicycle Rental
2.7. E-Bike Battery Price
2.8. Price Chart Of Different Battery Chemistry
2.9. Hyper-Local Delivery
2.10. Dedicated Bicycle Lanes
2.11. Number Of Trekkers
2.12. Battery Charging Capacity
2.13. Traffic Congestion Index
2.14. Regulatory Framework
2.15. Value Chain & Distribution Channel Analysis
3. MARKET SEGMENTATION
3.1. Propulsion Type
3.1.1. Pedal Assisted
3.1.2. Speed Pedelec
3.1.3. Throttle Assisted
3.2. Application Type
3.2.1. Cargo/Utility
3.2.2. City/Urban
3.2.3. Trekking
3.3. Battery Type
3.3.1. Lead Acid Battery
3.3.2. Lithium-ion Battery
3.3.3. Others
4. COMPETITIVE LANDSCAPE
4.1. Key Strategic Moves
4.2. Market Share Analysis
4.3. Company Landscape
4.4. Company Profiles
4.4.1. Batavus Intercycle Corporation
4.4.2. Cortina Bikes
4.4.3. Giant Manufacturing Co. Ltd
4.4.4. Koga
4.4.5. Lekker Bikes
4.4.6. MHW Bike-House GmbH (Cube Bikes)
4.4.7. Qwic
4.4.8. Royal Dutch Gazelle
4.4.9. Sensa Bikes
4.4.10. Van Moof BV
5. KEY STRATEGIC QUESTIONS FOR E BIKES CEOS
6. APPENDIX
6.1. Global Overview
6.1.1. Overview
6.1.2. Porter’s Five Forces Framework
6.1.3. Global Value Chain Analysis
6.1.4. Market Dynamics (DROs)
6.2. Sources & References
6.3. List of Tables & Figures
6.4. Primary Insights
6.5. Data Pack
6.6. Glossary of Terms
List of Tables & Figures
- Figure 1:
- DENMARK E-BIKE MARKET, BICYCLE SALES, VOLUME, THOUSAND UNITS, 2017 - 2029
- Figure 2:
- DENMARK E-BIKE MARKET, GDP PER CAPITA, VALUE, USD, 2017 - 2029
- Figure 3:
- DENMARK E-BIKE MARKET, INFLATION RATE, VALUE, PERCENT, 2017 - 2029
- Figure 4:
- DENMARK E-BIKE MARKET, ADOPTION RATE, VOLUME, PERCENT, 2017 - 2029
- Figure 5:
- DENMARK E-BIKE MARKET, COMMUTERS WITH 5-15 KM TRAVEL DISTANCE, VOLUME, PERCENT, 2017 - 2029
- Figure 6:
- DENMARK E-BIKE MARKET, BICYCLE RENTAL, VALUE, USD MILLION, 2017 - 2029
- Figure 7:
- DENMARK E-BIKE MARKET, E-BIKE BATTERY PRICE, VALUE, USD, 2017 - 2029
- Figure 8:
- DENMARK E-BIKE MARKET, PRICE CHART OF DIFFERENT BATTERY CHEMISTRY, VALUE, USD, 2017 - 2029
- Figure 9:
- DENMARK E-BIKE MARKET, HYPER-LOCAL DELIVERY, VOLUME, THOUSAND UNITS, 2017 - 2029
- Figure 10:
- DENMARK E-BIKE MARKET, DEDICATED BICYCLE LANES, VOLUME, THOUSAND UNITS, 2017 - 2029
- Figure 11:
- DENMARK E-BIKE MARKET, NUMBER OF TREKKERS, VOLUME, THOUSAND UNITS, 2017 - 2029
- Figure 12:
- DENMARK E-BIKE MARKET, BATTERY CHARGING CAPACITY, VOLUME, UNITS, 2017 - 2029
- Figure 13:
- DENMARK E-BIKE MARKET, TRAFFIC CONGESTION INDEX, VOLUME, PERCENT, 2017 - 2022
- Figure 14:
- DENMARK E-BIKE MARKET, VOLUME, UNITS, 2017 - 2029
- Figure 15:
- DENMARK E-BIKE MARKET, VALUE, USD MILLION, 2017 - 2029
- Figure 16:
- DENMARK E-BIKE MARKET, BY PROPULSION TYPE, VOLUME, UNITS, 2017 - 2029
- Figure 17:
- DENMARK E-BIKE MARKET, BY PROPULSION TYPE, VALUE, USD MILLION, 2017 - 2029
- Figure 18:
- DENMARK E-BIKE MARKET, BY PROPULSION TYPE, VOLUME, SHARE (%), 2017 - 2029
- Figure 19:
- DENMARK E-BIKE MARKET, BY PROPULSION TYPE, VALUE, SHARE (%), 2017 - 2029
- Figure 20:
- DENMARK E-BIKE MARKET, BY PROPULSION TYPE, VOLUME, UNITS, 2017 - 2029
- Figure 21:
- DENMARK E-BIKE MARKET, BY PROPULSION TYPE, VALUE, USD MILLION, 2017 - 2029
- Figure 22:
- DENMARK E-BIKE MARKET, BY PROPULSION TYPE, VALUE SHARE (%), 2022 - 2029
- Figure 23:
- DENMARK E-BIKE MARKET, BY PROPULSION TYPE, VOLUME, UNITS, 2017 - 2029
- Figure 24:
- DENMARK E-BIKE MARKET, BY PROPULSION TYPE, VALUE, USD MILLION, 2017 - 2029
- Figure 25:
- DENMARK E-BIKE MARKET, BY PROPULSION TYPE, VALUE SHARE (%), 2022 - 2029
- Figure 26:
- DENMARK E-BIKE MARKET, BY PROPULSION TYPE, VOLUME, UNITS, 2017 - 2029
- Figure 27:
- DENMARK E-BIKE MARKET, BY PROPULSION TYPE, VALUE, USD MILLION, 2017 - 2029
- Figure 28:
- DENMARK E-BIKE MARKET, BY PROPULSION TYPE, VALUE SHARE (%), 2022 - 2029
- Figure 29:
- DENMARK E-BIKE MARKET, BY APPLICATION TYPE, VOLUME, UNITS, 2017 - 2029
- Figure 30:
- DENMARK E-BIKE MARKET, BY APPLICATION TYPE, VALUE, USD MILLION, 2017 - 2029
- Figure 31:
- DENMARK E-BIKE MARKET, BY APPLICATION TYPE, VOLUME, SHARE (%), 2017 - 2029
- Figure 32:
- DENMARK E-BIKE MARKET, BY APPLICATION TYPE, VALUE, SHARE (%), 2017 - 2029
- Figure 33:
- DENMARK E-BIKE MARKET, BY APPLICATION TYPE, VOLUME, UNITS, 2017 - 2029
- Figure 34:
- DENMARK E-BIKE MARKET, BY APPLICATION TYPE, VALUE, USD MILLION, 2017 - 2029
- Figure 35:
- DENMARK E-BIKE MARKET, BY APPLICATION TYPE, VALUE SHARE (%), 2022 - 2029
- Figure 36:
- DENMARK E-BIKE MARKET, BY APPLICATION TYPE, VOLUME, UNITS, 2017 - 2029
- Figure 37:
- DENMARK E-BIKE MARKET, BY APPLICATION TYPE, VALUE, USD MILLION, 2017 - 2029
- Figure 38:
- DENMARK E-BIKE MARKET, BY APPLICATION TYPE, VALUE SHARE (%), 2022 - 2029
- Figure 39:
- DENMARK E-BIKE MARKET, BY APPLICATION TYPE, VOLUME, UNITS, 2017 - 2029
- Figure 40:
- DENMARK E-BIKE MARKET, BY APPLICATION TYPE, VALUE, USD MILLION, 2017 - 2029
- Figure 41:
- DENMARK E-BIKE MARKET, BY APPLICATION TYPE, VALUE SHARE (%), 2022 - 2029
- Figure 42:
- DENMARK E-BIKE MARKET, BY BATTERY TYPE, VOLUME, UNITS, 2017 - 2029
- Figure 43:
- DENMARK E-BIKE MARKET, BY BATTERY TYPE, VALUE, USD MILLION, 2017 - 2029
- Figure 44:
- DENMARK E-BIKE MARKET, BY BATTERY TYPE, VOLUME, SHARE (%), 2017 - 2029
- Figure 45:
- DENMARK E-BIKE MARKET, BY BATTERY TYPE, VALUE, SHARE (%), 2017 - 2029
- Figure 46:
- DENMARK E-BIKE MARKET, BY BATTERY TYPE, VOLUME, UNITS, 2017 - 2029
- Figure 47:
- DENMARK E-BIKE MARKET, BY BATTERY TYPE, VALUE, USD MILLION, 2017 - 2029
- Figure 48:
- DENMARK E-BIKE MARKET, BY BATTERY TYPE, VALUE SHARE (%), 2022 - 2029
- Figure 49:
- DENMARK E-BIKE MARKET, BY BATTERY TYPE, VOLUME, UNITS, 2017 - 2029
- Figure 50:
- DENMARK E-BIKE MARKET, BY BATTERY TYPE, VALUE, USD MILLION, 2017 - 2029
- Figure 51:
- DENMARK E-BIKE MARKET, BY BATTERY TYPE, VALUE SHARE (%), 2022 - 2029
- Figure 52:
- DENMARK E-BIKE MARKET, BY BATTERY TYPE, VOLUME, UNITS, 2017 - 2029
- Figure 53:
- DENMARK E-BIKE MARKET, BY BATTERY TYPE, VALUE, USD MILLION, 2017 - 2029
- Figure 54:
- DENMARK E-BIKE MARKET, BY BATTERY TYPE, VALUE SHARE (%), 2022 - 2029
- Figure 55:
- DENMARK E-BIKE MARKET, MOST ACTIVE COMPANIES, BY NUMBER OF STRATEGIC MOVES, 2018 - 2021
- Figure 56:
- DENMARK E-BIKE MARKET, MOST ADOPTED STRATEGIES, 2018 - 2021
- Figure 57:
- DENMARK E-BIKE MARKET SHARE(%), BY MAJOR PLAYERS, 2022
Denmark E-Bike Industry Segmentation
Pedal Assisted, Speed Pedelec, Throttle Assisted are covered as segments by Propulsion Type. Cargo/Utility, City/Urban, Trekking are covered as segments by Application Type. Lead Acid Battery, Lithium-ion Battery, Others are covered as segments by Battery Type.| Propulsion Type | |
| Pedal Assisted | |
| Speed Pedelec | |
| Throttle Assisted |
| Application Type | |
| Cargo/Utility | |
| City/Urban | |
| Trekking |
| Battery Type | |
| Lead Acid Battery | |
| Lithium-ion Battery | |
| Others |
Market Definition
- By Application Type - E-bikes considered under this segment include city/urban, trekking, and cargo/utility e-bikes. The common types of e-bikes under these three categories include off-road/hybrid, kids, ladies/gents, cross, MTB, folding, fat tire, and sports e-bike.
- By Battery Type - This segment includes lithium-ion batteries, lead-acid batteries, and other battery types. The other battery type category includes nickel-metal hydroxide (NiMH), silicon, and lithium-polymer batteries.
- By Propulsion Type - E-bikes considered under this segment include pedal-assisted e-bikes, throttle-assisted e-bikes, and speed pedelec. While the speed limit of pedal and throttle-assisted e-bikes is usually 25 km/h, the speed limit of speed pedelec is generally 45 km/h (28 mph).
Research Methodology
Mordor Intelligence follows a four-step methodology in all our reports.
- Step-1: Identify Key Variables: In order to build a robust forecasting methodology, the variables and factors identified in Step-1 are tested against available historical market numbers. Through an iterative process, the variables required for market forecast are set and the model is built on the basis of these variables.
- Step-2: Build a Market Model: Market-size estimations for the historical and forecast years have been provided in revenue and volume terms. For sales conversion to volume, the average selling price (ASP) is kept constant throughout the forecast period for each country, and inflation is not a part of the pricing.
- Step-3: Validate and Finalize: In this important step, all market numbers, variables and analyst calls are validated through an extensive network of primary research experts from the market studied. The respondents are selected across levels and functions to generate a holistic picture of the market studied.
- Step-4: Research Outputs: Syndicated Reports, Custom Consulting Assignments, Databases & Subscription Platforms


