Epoxy Adhesive Market Size

| Icons | Lable | Value |
|---|---|---|
|
|
Study Period | 2017 - 2028 |
|
|
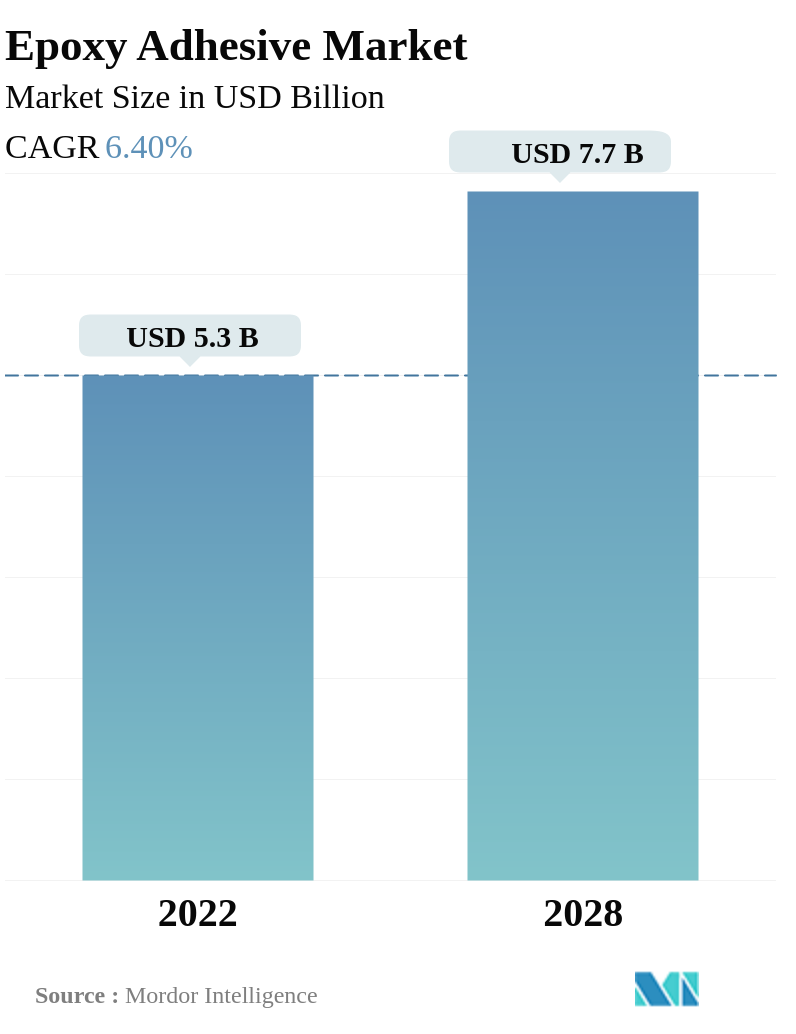
Market Size (2028) | USD 7.7 Billion |
|
|
Market Size (2022) | USD 5.3 Billion |
|
|
Largest Share by End User Industry | Automotive |
|
|
CAGR (2022 - 2028) | 6.40 % |
|
|
Largest Share by Region | Asia-Pacific |
Major Players |
||
|
|
||
|
*Disclaimer: Major Players sorted in no particular order |
Epoxy Adhesive Market Analysis
The Epoxy Adhesive Market is projected to register a CAGR of 6.40%
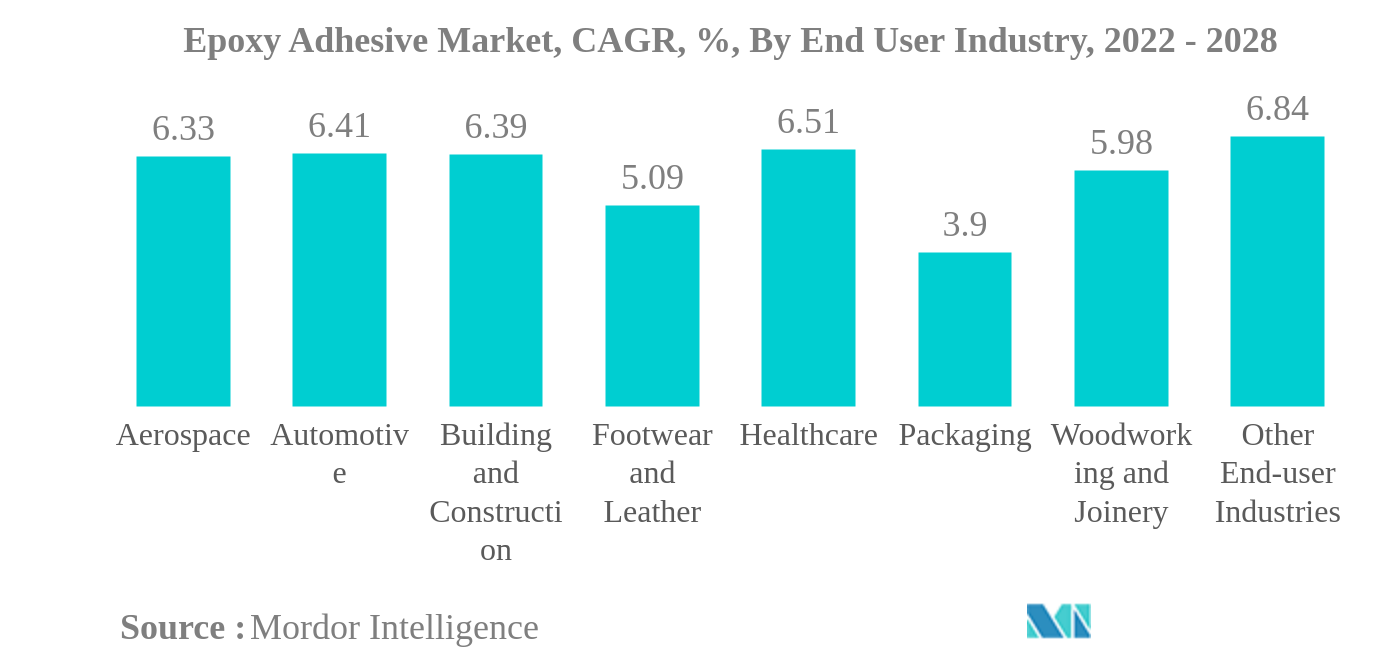
- Automotive is the Largest End User Industry. Automotive is the dominant end-user industry owing to the wide range of adhesive applications for structural bonding and assembly operations.
- Reactive is the Largest Technology. Reactive is the largest technology type in the market owing to its wide range of applications across major end-user industries, including automotive, woodworking & joinery, and building & construction.
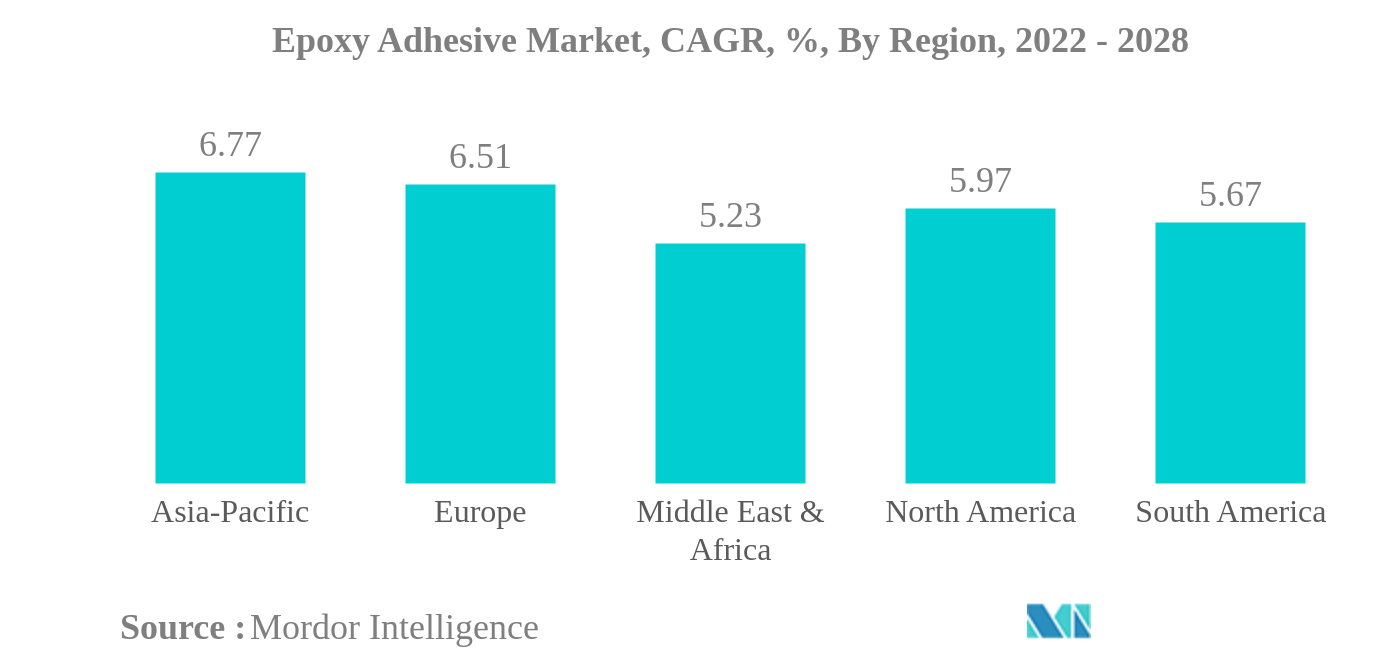
- Asia-Pacific is the Largest Region. Asia-Pacific, mainly driven by India, China, South Korea, and Japan, is a major consumer of epoxy adhesive owing to its usage in several end-user segments.
- Asia-Pacific is the Fastest-growing Region. Due to the increasing population and rapid urbanization in countries such as China, India, South Korea, and Japan, the Asia-Pacific region is projected to be the fastest-growing regional segment during the forecast period.
Epoxy Adhesive Market Trends
This section covers the major market trends shaping the Epoxy Adhesive Market according to our research experts:
Automotive is the largest End User Industry
- Epoxy resin-based adhesives are widely used in the construction industry because of their applications in the construction industry, such as for flooring, roofing, wooden components joinery, etc. The construction industry globally is expected to grow at 3.5% per annum up to 2030. China, India, the United States, and Indonesia are expected to account for 58.3% of the overall construction growth globally. As a result, construction sealants account for a nearly 18% share of the global epoxy adhesive market share by value.
- Epoxy resin-based adhesives are widely used in the automotive industry because of their applicability to surfaces such as glass, metal, plastic, painted surfaces, etc., and their features are helpful in the automotive industry, such as for strong bonding, durability, and long-lasting. These products are used in engines and car gaskets. The electric vehicles segment of the automotive industry is expected to record a CAGR of 17.75% globally in the forecast period because of the increased demand for the same in growing economies. This is expected to increase the demand for automotive epoxy adhesives in the forecast period.
- Epoxy adhesives are widely used for electronics and electrical equipment manufacturing as they can be used for sticking sensors and cables. The global electronics and household appliances industries are expected to record CAGRs of 2.51% and 5.77%, respectively, which is expected to lead to an increase in demand for epoxy adhesives in the forecast period 2022-2028.
- Epoxy resin-based adhesives are used in the healthcare industry for applications such as assembling and bonding medical device parts. The increase in healthcare investments worldwide will lead to an increase in their demand in the forecast period.
Asia-Pacific is the largest Region
- Epoxy adhesives are made up largely of epoxy resin and a curing agent. Two-component epoxy adhesives are made by separately packaging the epoxy and curing agent components. They cure quickly after combining the two components. Almost all two-component room-temperature cure epoxy adhesives are available. All formulated components, including epoxy resin and curing agent, are mixed in advance to make one-component epoxy adhesives. Epoxy adhesives adhere well to various substrates and can be used to attach metals, glass, concrete, ceramics, wood, and many polymers. Curing shrinkage is extremely minimal. The cross-linked chemical structure of cured epoxy resin is strong and rigid, making it appropriate for structural bonding applications. Various epoxy adhesives for diverse uses have been developed by combining various epoxy resins and curing agents.
- Asia-Pacific is the top consumer of epoxy adhesives globally, holding a share of about 47%, followed by North America, Europe, Middle East and Africa, and South America, with shares of 25%, 23.5%, 3.3%, and 3.1%, respectively. Growing construction activities and the rising production of automotive vehicles due to an increase in sales after the COVID-19 pandemic across the region is expected to be the major factor driving the growth of epoxy adhesives.
- Across all the end-use sectors, automotive is the leading consumer of epoxy globally, holding a share of about 30.7%, followed by building and construction, healthcare, aerospace, and woodworking, with shares of about 19.2%, 10.2%, 7%, and 6.6%, respectively. The other end-use industries segment holds about 28%. The rising adoption of EVs to increase sustainability is expected to boost the demand for epoxy adhesives globally.
Epoxy Adhesive Industry Overview
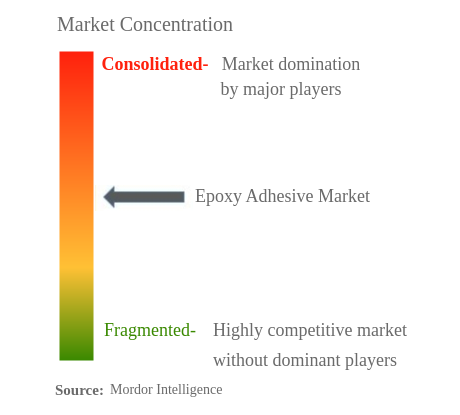
The Epoxy Adhesive Market is moderately consolidated, with the top five companies occupying 47.36%. The major players in this market are 3M, Arkema Group, H.B. Fuller Company, Henkel AG & Co. KGaA and Sika AG (sorted alphabetically).
Epoxy Adhesive Market Leaders
3M
Arkema Group
H.B. Fuller Company
Henkel AG & Co. KGaA
Sika AG
*Disclaimer: Major Players sorted in no particular order
Epoxy Adhesive Market News
- July 2022: Mapei started the construction of its third manufacturing facility in Kosi, Mathura, to cater to the demand generated from Northern India.
- May 2022: ITW Performance Polymers announced a distribution partnership with PREMA SA in Poland for its Devcon brand.
- February 2022: H.B. Fuller announced the acquisition of Fourny NV to strengthen its Construction Adhesives business in Europe.
Epoxy Adhesive Market Report - Table of Contents
1. INTRODUCTION
1.1. Study Assumptions & Market Definition
1.2. Scope of the Study
1.3. Research Methodology
2. KEY INDUSTRY TRENDS
2.1. End User Trends
2.2. Regulatory Framework
2.3. Value Chain & Distribution Channel Analysis
3. MARKET SEGMENTATION
3.1. End User Industry
3.1.1. Aerospace
3.1.2. Automotive
3.1.3. Building and Construction
3.1.4. Footwear and Leather
3.1.5. Healthcare
3.1.6. Packaging
3.1.7. Woodworking and Joinery
3.1.8. Other End-user Industries
3.2. Technology
3.2.1. Reactive
3.2.2. Solvent-borne
3.2.3. UV Cured Adhesives
3.2.4. Water-borne
3.3. Region
3.3.1. Asia-Pacific
3.3.1.1. Australia
3.3.1.2. China
3.3.1.3. India
3.3.1.4. Indonesia
3.3.1.5. Japan
3.3.1.6. Malaysia
3.3.1.7. Singapore
3.3.1.8. South Korea
3.3.1.9. Thailand
3.3.1.10. Rest of Asia-Pacific
3.3.2. Europe
3.3.2.1. France
3.3.2.2. Germany
3.3.2.3. Italy
3.3.2.4. Russia
3.3.2.5. Spain
3.3.2.6. United Kingdom
3.3.2.7. Rest of Europe
3.3.3. Middle East & Africa
3.3.3.1. Saudi Arabia
3.3.3.2. South Africa
3.3.3.3. Rest of Middle East & Africa
3.3.4. North America
3.3.4.1. Canada
3.3.4.2. Mexico
3.3.4.3. United States
3.3.4.4. Rest of North America
3.3.5. South America
3.3.5.1. Argentina
3.3.5.2. Brazil
3.3.5.3. Rest of South America
4. COMPETITIVE LANDSCAPE
4.1. Key Strategic Moves
4.2. Market Share Analysis
4.3. Company Landscape
4.4. Company Profiles
4.4.1. 3M
4.4.2. Arkema Group
4.4.3. H.B. Fuller Company
4.4.4. Henkel AG & Co. KGaA
4.4.5. Hubei Huitian New Materials Co. Ltd
4.4.6. Huntsman International LLC
4.4.7. Illinois Tool Works Inc.
4.4.8. Jowat SE
4.4.9. Kangda New Materials (Group) Co., Ltd.
4.4.10. KLEBCHEMIE M. G. Becker GmbH & Co. KG
4.4.11. MAPEI S.p.A.
4.4.12. NANPAO RESINS CHEMICAL GROUP
4.4.13. Pidilite Industries Ltd.
4.4.14. Sika AG
4.4.15. Soudal Holding N.V.
5. KEY STRATEGIC QUESTIONS FOR ADHESIVES AND SEALANTS CEOS
6. APPENDIX
6.1. Global Adhesives and Sealants Industry Overview
6.1.1. Overview
6.1.2. Porter’s Five Forces Framework
6.1.3. Global Value Chain Analysis
6.1.4. Drivers, Restraints, and Opportunities
6.2. Sources & References
6.3. List of Tables & Figures
6.4. Primary Insights
6.5. Data Pack
6.6. Glossary of Terms
List of Tables & Figures
- Figure 1:
- GLOBAL AIRCRAFT DELIVERIES, VOLUME IN UNITS, 2017-2028
- Figure 2:
- GLOBAL AUTOMOBILE PRODUCTION, VOLUME IN UNITS, 2017-2028
- Figure 3:
- GLOBAL NEW FLOOR AREA, VOLUME IN SQUARE FEET, 2017-2028
- Figure 4:
- GLOBAL FOOTWEAR PRODUCTION, VOLUME IN PAIRS, 2017-2028
- Figure 5:
- GLOBAL PAPER & PAPER BOARD AND PLASTIC PACKAGING, VOLUME IN TONS, 2017-2028
- Figure 6:
- GLOBAL FURNITURE PRODUCTION, VOLUME IN UNITS, 2017-2028
- Figure 7:
- GLOBAL EPOXY ADHESIVE MARKET, VOLUME, TONS, 2017 - 2028
- Figure 8:
- GLOBAL EPOXY ADHESIVE MARKET, VALUE, USD, 2017 - 2028
- Figure 9:
- GLOBAL EPOXY ADHESIVE MARKET, BY END USER INDUSTRY, VOLUME, TONS, 2017 - 2028
- Figure 10:
- GLOBAL EPOXY ADHESIVE MARKET, BY END USER INDUSTRY, VALUE, USD, 2017 - 2028
- Figure 11:
- GLOBAL EPOXY ADHESIVE MARKET, BY END USER INDUSTRY, VOLUME SHARE (%), 2022 VS 2028
- Figure 12:
- GLOBAL EPOXY ADHESIVE MARKET, BY END USER INDUSTRY, VALUE SHARE (%), 2022 VS 2028
- Figure 13:
- GLOBAL EPOXY ADHESIVE MARKET, AEROSPACE, VOLUME, TONS, 2017 - 2028
- Figure 14:
- GLOBAL EPOXY ADHESIVE MARKET, AEROSPACE, VALUE, USD, 2017 - 2028
- Figure 15:
- GLOBAL EPOXY ADHESIVE MARKET, AEROSPACE, BY TECHNOLOGY, VALUE SHARE (%), 2021 VS 2028
- Figure 16:
- GLOBAL EPOXY ADHESIVE MARKET, AUTOMOTIVE, VOLUME, TONS, 2017 - 2028
- Figure 17:
- GLOBAL EPOXY ADHESIVE MARKET, AUTOMOTIVE, VALUE, USD, 2017 - 2028
- Figure 18:
- GLOBAL EPOXY ADHESIVE MARKET, AUTOMOTIVE, BY TECHNOLOGY, VALUE SHARE (%), 2021 VS 2028
- Figure 19:
- GLOBAL EPOXY ADHESIVE MARKET, BUILDING AND CONSTRUCTION, VOLUME, TONS, 2017 - 2028
- Figure 20:
- GLOBAL EPOXY ADHESIVE MARKET, BUILDING AND CONSTRUCTION, VALUE, USD, 2017 - 2028
- Figure 21:
- GLOBAL EPOXY ADHESIVE MARKET, BUILDING AND CONSTRUCTION, BY TECHNOLOGY, VALUE SHARE (%), 2021 VS 2028
- Figure 22:
- GLOBAL EPOXY ADHESIVE MARKET, FOOTWEAR AND LEATHER, VOLUME, TONS, 2017 - 2028
- Figure 23:
- GLOBAL EPOXY ADHESIVE MARKET, FOOTWEAR AND LEATHER, VALUE, USD, 2017 - 2028
- Figure 24:
- GLOBAL EPOXY ADHESIVE MARKET, FOOTWEAR AND LEATHER, BY TECHNOLOGY, VALUE SHARE (%), 2021 VS 2028
- Figure 25:
- GLOBAL EPOXY ADHESIVE MARKET, HEALTHCARE, VOLUME, TONS, 2017 - 2028
- Figure 26:
- GLOBAL EPOXY ADHESIVE MARKET, HEALTHCARE, VALUE, USD, 2017 - 2028
- Figure 27:
- GLOBAL EPOXY ADHESIVE MARKET, HEALTHCARE, BY TECHNOLOGY, VALUE SHARE (%), 2021 VS 2028
- Figure 28:
- GLOBAL EPOXY ADHESIVE MARKET, PACKAGING, VOLUME, TONS, 2017 - 2028
- Figure 29:
- GLOBAL EPOXY ADHESIVE MARKET, PACKAGING, VALUE, USD, 2017 - 2028
- Figure 30:
- GLOBAL EPOXY ADHESIVE MARKET, PACKAGING, BY TECHNOLOGY, VALUE SHARE (%), 2021 VS 2028
- Figure 31:
- GLOBAL EPOXY ADHESIVE MARKET, WOODWORKING AND JOINERY, VOLUME, TONS, 2017 - 2028
- Figure 32:
- GLOBAL EPOXY ADHESIVE MARKET, WOODWORKING AND JOINERY, VALUE, USD, 2017 - 2028
- Figure 33:
- GLOBAL EPOXY ADHESIVE MARKET, WOODWORKING AND JOINERY, BY TECHNOLOGY, VALUE SHARE (%), 2021 VS 2028
- Figure 34:
- GLOBAL EPOXY ADHESIVE MARKET, OTHER END-USER INDUSTRIES, VOLUME, TONS, 2017 - 2028
- Figure 35:
- GLOBAL EPOXY ADHESIVE MARKET, OTHER END-USER INDUSTRIES, VALUE, USD, 2017 - 2028
- Figure 36:
- GLOBAL EPOXY ADHESIVE MARKET, OTHER END-USER INDUSTRIES, BY TECHNOLOGY, VALUE SHARE (%), 2021 VS 2028
- Figure 37:
- GLOBAL EPOXY ADHESIVE MARKET, BY TECHNOLOGY, VOLUME, TONS, 2017 - 2028
- Figure 38:
- GLOBAL EPOXY ADHESIVE MARKET, BY TECHNOLOGY, VALUE, USD, 2017 - 2028
- Figure 39:
- GLOBAL EPOXY ADHESIVE MARKET, BY TECHNOLOGY, VOLUME SHARE (%), 2022 VS 2028
- Figure 40:
- GLOBAL EPOXY ADHESIVE MARKET, BY TECHNOLOGY, VALUE SHARE (%), 2022 VS 2028
- Figure 41:
- GLOBAL EPOXY ADHESIVE MARKET, REACTIVE, VOLUME, TONS, 2017 - 2028
- Figure 42:
- GLOBAL EPOXY ADHESIVE MARKET, REACTIVE, VALUE, USD, 2017 - 2028
- Figure 43:
- GLOBAL EPOXY ADHESIVE MARKET, REACTIVE, BY END USER INDUSTRY, VALUE SHARE (%), 2021 VS 2028
- Figure 44:
- GLOBAL EPOXY ADHESIVE MARKET, SOLVENT-BORNE, VOLUME, TONS, 2017 - 2028
- Figure 45:
- GLOBAL EPOXY ADHESIVE MARKET, SOLVENT-BORNE, VALUE, USD, 2017 - 2028
- Figure 46:
- GLOBAL EPOXY ADHESIVE MARKET, SOLVENT-BORNE, BY END USER INDUSTRY, VALUE SHARE (%), 2021 VS 2028
- Figure 47:
- GLOBAL EPOXY ADHESIVE MARKET, UV CURED ADHESIVES, VOLUME, TONS, 2017 - 2028
- Figure 48:
- GLOBAL EPOXY ADHESIVE MARKET, UV CURED ADHESIVES, VALUE, USD, 2017 - 2028
- Figure 49:
- GLOBAL EPOXY ADHESIVE MARKET, UV CURED ADHESIVES, BY END USER INDUSTRY, VALUE SHARE (%), 2021 VS 2028
- Figure 50:
- GLOBAL EPOXY ADHESIVE MARKET, WATER-BORNE, VOLUME, TONS, 2017 - 2028
- Figure 51:
- GLOBAL EPOXY ADHESIVE MARKET, WATER-BORNE, VALUE, USD, 2017 - 2028
- Figure 52:
- GLOBAL EPOXY ADHESIVE MARKET, WATER-BORNE, BY END USER INDUSTRY, VALUE SHARE (%), 2021 VS 2028
- Figure 53:
- GLOBAL EPOXY ADHESIVE MARKET, BY REGION, VOLUME, TONS, 2017 - 2028
- Figure 54:
- GLOBAL EPOXY ADHESIVE MARKET, BY REGION, VALUE, USD, 2017 - 2028
- Figure 55:
- GLOBAL EPOXY ADHESIVE MARKET, BY REGION, VOLUME SHARE (%), 2022 VS 2028
- Figure 56:
- GLOBAL EPOXY ADHESIVE MARKET, BY REGION, VALUE SHARE (%), 2022 VS 2028
- Figure 57:
- GLOBAL EPOXY ADHESIVE MARKET, BY COUNTRY, ASIA-PACIFIC, VOLUME, TONS, 2017 - 2028
- Figure 58:
- GLOBAL EPOXY ADHESIVE MARKET, BY COUNTRY, ASIA-PACIFIC, VALUE, USD, 2017 - 2028
- Figure 59:
- GLOBAL EPOXY ADHESIVE MARKET, BY COUNTRY, ASIA-PACIFIC, VOLUME SHARE(%), 2022 VS 2028
- Figure 60:
- GLOBAL EPOXY ADHESIVE MARKET, BY COUNTRY, ASIA-PACIFIC, VALUE SHARE(%), 2022 VS 2028
- Figure 61:
- GLOBAL EPOXY ADHESIVE MARKET, AUSTRALIA, VOLUME, TONS, 2017 - 2028
- Figure 62:
- GLOBAL EPOXY ADHESIVE MARKET, AUSTRALIA, VALUE, USD, 2017 - 2028
- Figure 63:
- GLOBAL EPOXY ADHESIVE MARKET, AUSTRALIA, BY END USER INDUSTRY, VALUE SHARE (%), 2021 VS 2028
- Figure 64:
- GLOBAL EPOXY ADHESIVE MARKET, CHINA, VOLUME, TONS, 2017 - 2028
- Figure 65:
- GLOBAL EPOXY ADHESIVE MARKET, CHINA, VALUE, USD, 2017 - 2028
- Figure 66:
- GLOBAL EPOXY ADHESIVE MARKET, CHINA, BY END USER INDUSTRY, VALUE SHARE (%), 2021 VS 2028
- Figure 67:
- GLOBAL EPOXY ADHESIVE MARKET, INDIA, VOLUME, TONS, 2017 - 2028
- Figure 68:
- GLOBAL EPOXY ADHESIVE MARKET, INDIA, VALUE, USD, 2017 - 2028
- Figure 69:
- GLOBAL EPOXY ADHESIVE MARKET, INDIA, BY END USER INDUSTRY, VALUE SHARE (%), 2021 VS 2028
- Figure 70:
- GLOBAL EPOXY ADHESIVE MARKET, INDONESIA, VOLUME, TONS, 2017 - 2028
- Figure 71:
- GLOBAL EPOXY ADHESIVE MARKET, INDONESIA, VALUE, USD, 2017 - 2028
- Figure 72:
- GLOBAL EPOXY ADHESIVE MARKET, INDONESIA, BY END USER INDUSTRY, VALUE SHARE (%), 2021 VS 2028
- Figure 73:
- GLOBAL EPOXY ADHESIVE MARKET, JAPAN, VOLUME, TONS, 2017 - 2028
- Figure 74:
- GLOBAL EPOXY ADHESIVE MARKET, JAPAN, VALUE, USD, 2017 - 2028
- Figure 75:
- GLOBAL EPOXY ADHESIVE MARKET, JAPAN, BY END USER INDUSTRY, VALUE SHARE (%), 2021 VS 2028
- Figure 76:
- GLOBAL EPOXY ADHESIVE MARKET, MALAYSIA, VOLUME, TONS, 2017 - 2028
- Figure 77:
- GLOBAL EPOXY ADHESIVE MARKET, MALAYSIA, VALUE, USD, 2017 - 2028
- Figure 78:
- GLOBAL EPOXY ADHESIVE MARKET, MALAYSIA, BY END USER INDUSTRY, VALUE SHARE (%), 2021 VS 2028
- Figure 79:
- GLOBAL EPOXY ADHESIVE MARKET, SINGAPORE, VOLUME, TONS, 2017 - 2028
- Figure 80:
- GLOBAL EPOXY ADHESIVE MARKET, SINGAPORE, VALUE, USD, 2017 - 2028
- Figure 81:
- GLOBAL EPOXY ADHESIVE MARKET, SINGAPORE, BY END USER INDUSTRY, VALUE SHARE (%), 2021 VS 2028
- Figure 82:
- GLOBAL EPOXY ADHESIVE MARKET, SOUTH KOREA, VOLUME, TONS, 2017 - 2028
- Figure 83:
- GLOBAL EPOXY ADHESIVE MARKET, SOUTH KOREA, VALUE, USD, 2017 - 2028
- Figure 84:
- GLOBAL EPOXY ADHESIVE MARKET, SOUTH KOREA, BY END USER INDUSTRY, VALUE SHARE (%), 2021 VS 2028
- Figure 85:
- GLOBAL EPOXY ADHESIVE MARKET, THAILAND, VOLUME, TONS, 2017 - 2028
- Figure 86:
- GLOBAL EPOXY ADHESIVE MARKET, THAILAND, VALUE, USD, 2017 - 2028
- Figure 87:
- GLOBAL EPOXY ADHESIVE MARKET, THAILAND, BY END USER INDUSTRY, VALUE SHARE (%), 2021 VS 2028
- Figure 88:
- GLOBAL EPOXY ADHESIVE MARKET, REST OF ASIA-PACIFIC, VOLUME, TONS, 2017 - 2028
- Figure 89:
- GLOBAL EPOXY ADHESIVE MARKET, REST OF ASIA-PACIFIC, VALUE, USD, 2017 - 2028
- Figure 90:
- GLOBAL EPOXY ADHESIVE MARKET, REST OF ASIA-PACIFIC, BY END USER INDUSTRY, VALUE SHARE (%), 2021 VS 2028
- Figure 91:
- GLOBAL EPOXY ADHESIVE MARKET, BY COUNTRY, EUROPE, VOLUME, TONS, 2017 - 2028
- Figure 92:
- GLOBAL EPOXY ADHESIVE MARKET, BY COUNTRY, EUROPE, VALUE, USD, 2017 - 2028
- Figure 93:
- GLOBAL EPOXY ADHESIVE MARKET, BY COUNTRY, EUROPE, VOLUME SHARE(%), 2022 VS 2028
- Figure 94:
- GLOBAL EPOXY ADHESIVE MARKET, BY COUNTRY, EUROPE, VALUE SHARE(%), 2022 VS 2028
- Figure 95:
- GLOBAL EPOXY ADHESIVE MARKET, FRANCE, VOLUME, TONS, 2017 - 2028
- Figure 96:
- GLOBAL EPOXY ADHESIVE MARKET, FRANCE, VALUE, USD, 2017 - 2028
- Figure 97:
- GLOBAL EPOXY ADHESIVE MARKET, FRANCE, BY END USER INDUSTRY, VALUE SHARE (%), 2021 VS 2028
- Figure 98:
- GLOBAL EPOXY ADHESIVE MARKET, GERMANY, VOLUME, TONS, 2017 - 2028
- Figure 99:
- GLOBAL EPOXY ADHESIVE MARKET, GERMANY, VALUE, USD, 2017 - 2028
- Figure 100:
- GLOBAL EPOXY ADHESIVE MARKET, GERMANY, BY END USER INDUSTRY, VALUE SHARE (%), 2021 VS 2028
- Figure 101:
- GLOBAL EPOXY ADHESIVE MARKET, ITALY, VOLUME, TONS, 2017 - 2028
- Figure 102:
- GLOBAL EPOXY ADHESIVE MARKET, ITALY, VALUE, USD, 2017 - 2028
- Figure 103:
- GLOBAL EPOXY ADHESIVE MARKET, ITALY, BY END USER INDUSTRY, VALUE SHARE (%), 2021 VS 2028
- Figure 104:
- GLOBAL EPOXY ADHESIVE MARKET, RUSSIA, VOLUME, TONS, 2017 - 2028
- Figure 105:
- GLOBAL EPOXY ADHESIVE MARKET, RUSSIA, VALUE, USD, 2017 - 2028
- Figure 106:
- GLOBAL EPOXY ADHESIVE MARKET, RUSSIA, BY END USER INDUSTRY, VALUE SHARE (%), 2021 VS 2028
- Figure 107:
- GLOBAL EPOXY ADHESIVE MARKET, SPAIN, VOLUME, TONS, 2017 - 2028
- Figure 108:
- GLOBAL EPOXY ADHESIVE MARKET, SPAIN, VALUE, USD, 2017 - 2028
- Figure 109:
- GLOBAL EPOXY ADHESIVE MARKET, SPAIN, BY END USER INDUSTRY, VALUE SHARE (%), 2021 VS 2028
- Figure 110:
- GLOBAL EPOXY ADHESIVE MARKET, UNITED KINGDOM, VOLUME, TONS, 2017 - 2028
- Figure 111:
- GLOBAL EPOXY ADHESIVE MARKET, UNITED KINGDOM, VALUE, USD, 2017 - 2028
- Figure 112:
- GLOBAL EPOXY ADHESIVE MARKET, UNITED KINGDOM, BY END USER INDUSTRY, VALUE SHARE (%), 2021 VS 2028
- Figure 113:
- GLOBAL EPOXY ADHESIVE MARKET, REST OF EUROPE, VOLUME, TONS, 2017 - 2028
- Figure 114:
- GLOBAL EPOXY ADHESIVE MARKET, REST OF EUROPE, VALUE, USD, 2017 - 2028
- Figure 115:
- GLOBAL EPOXY ADHESIVE MARKET, REST OF EUROPE, BY END USER INDUSTRY, VALUE SHARE (%), 2021 VS 2028
- Figure 116:
- GLOBAL EPOXY ADHESIVE MARKET, BY COUNTRY, MIDDLE EAST & AFRICA, VOLUME, TONS, 2017 - 2028
- Figure 117:
- GLOBAL EPOXY ADHESIVE MARKET, BY COUNTRY, MIDDLE EAST & AFRICA, VALUE, USD, 2017 - 2028
- Figure 118:
- GLOBAL EPOXY ADHESIVE MARKET, BY COUNTRY, MIDDLE EAST & AFRICA, VOLUME SHARE(%), 2022 VS 2028
- Figure 119:
- GLOBAL EPOXY ADHESIVE MARKET, BY COUNTRY, MIDDLE EAST & AFRICA, VALUE SHARE(%), 2022 VS 2028
- Figure 120:
- GLOBAL EPOXY ADHESIVE MARKET, SAUDI ARABIA, VOLUME, TONS, 2017 - 2028
- Figure 121:
- GLOBAL EPOXY ADHESIVE MARKET, SAUDI ARABIA, VALUE, USD, 2017 - 2028
- Figure 122:
- GLOBAL EPOXY ADHESIVE MARKET, SAUDI ARABIA, BY END USER INDUSTRY, VALUE SHARE (%), 2021 VS 2028
- Figure 123:
- GLOBAL EPOXY ADHESIVE MARKET, SOUTH AFRICA, VOLUME, TONS, 2017 - 2028
- Figure 124:
- GLOBAL EPOXY ADHESIVE MARKET, SOUTH AFRICA, VALUE, USD, 2017 - 2028
- Figure 125:
- GLOBAL EPOXY ADHESIVE MARKET, SOUTH AFRICA, BY END USER INDUSTRY, VALUE SHARE (%), 2021 VS 2028
- Figure 126:
- GLOBAL EPOXY ADHESIVE MARKET, REST OF MIDDLE EAST & AFRICA, VOLUME, TONS, 2017 - 2028
- Figure 127:
- GLOBAL EPOXY ADHESIVE MARKET, REST OF MIDDLE EAST & AFRICA, VALUE, USD, 2017 - 2028
- Figure 128:
- GLOBAL EPOXY ADHESIVE MARKET, REST OF MIDDLE EAST & AFRICA, BY END USER INDUSTRY, VALUE SHARE (%), 2021 VS 2028
- Figure 129:
- GLOBAL EPOXY ADHESIVE MARKET, BY COUNTRY, NORTH AMERICA, VOLUME, TONS, 2017 - 2028
- Figure 130:
- GLOBAL EPOXY ADHESIVE MARKET, BY COUNTRY, NORTH AMERICA, VALUE, USD, 2017 - 2028
- Figure 131:
- GLOBAL EPOXY ADHESIVE MARKET, BY COUNTRY, NORTH AMERICA, VOLUME SHARE(%), 2022 VS 2028
- Figure 132:
- GLOBAL EPOXY ADHESIVE MARKET, BY COUNTRY, NORTH AMERICA, VALUE SHARE(%), 2022 VS 2028
- Figure 133:
- GLOBAL EPOXY ADHESIVE MARKET, CANADA, VOLUME, TONS, 2017 - 2028
- Figure 134:
- GLOBAL EPOXY ADHESIVE MARKET, CANADA, VALUE, USD, 2017 - 2028
- Figure 135:
- GLOBAL EPOXY ADHESIVE MARKET, CANADA, BY END USER INDUSTRY, VALUE SHARE (%), 2021 VS 2028
- Figure 136:
- GLOBAL EPOXY ADHESIVE MARKET, MEXICO, VOLUME, TONS, 2017 - 2028
- Figure 137:
- GLOBAL EPOXY ADHESIVE MARKET, MEXICO, VALUE, USD, 2017 - 2028
- Figure 138:
- GLOBAL EPOXY ADHESIVE MARKET, MEXICO, BY END USER INDUSTRY, VALUE SHARE (%), 2021 VS 2028
- Figure 139:
- GLOBAL EPOXY ADHESIVE MARKET, UNITED STATES, VOLUME, TONS, 2017 - 2028
- Figure 140:
- GLOBAL EPOXY ADHESIVE MARKET, UNITED STATES, VALUE, USD, 2017 - 2028
- Figure 141:
- GLOBAL EPOXY ADHESIVE MARKET, UNITED STATES, BY END USER INDUSTRY, VALUE SHARE (%), 2021 VS 2028
- Figure 142:
- GLOBAL EPOXY ADHESIVE MARKET, REST OF NORTH AMERICA, VOLUME, TONS, 2017 - 2028
- Figure 143:
- GLOBAL EPOXY ADHESIVE MARKET, REST OF NORTH AMERICA, VALUE, USD, 2017 - 2028
- Figure 144:
- GLOBAL EPOXY ADHESIVE MARKET, REST OF NORTH AMERICA, BY END USER INDUSTRY, VALUE SHARE (%), 2021 VS 2028
- Figure 145:
- GLOBAL EPOXY ADHESIVE MARKET, BY COUNTRY, SOUTH AMERICA, VOLUME, TONS, 2017 - 2028
- Figure 146:
- GLOBAL EPOXY ADHESIVE MARKET, BY COUNTRY, SOUTH AMERICA, VALUE, USD, 2017 - 2028
- Figure 147:
- GLOBAL EPOXY ADHESIVE MARKET, BY COUNTRY, SOUTH AMERICA, VOLUME SHARE(%), 2022 VS 2028
- Figure 148:
- GLOBAL EPOXY ADHESIVE MARKET, BY COUNTRY, SOUTH AMERICA, VALUE SHARE(%), 2022 VS 2028
- Figure 149:
- GLOBAL EPOXY ADHESIVE MARKET, ARGENTINA, VOLUME, TONS, 2017 - 2028
- Figure 150:
- GLOBAL EPOXY ADHESIVE MARKET, ARGENTINA, VALUE, USD, 2017 - 2028
- Figure 151:
- GLOBAL EPOXY ADHESIVE MARKET, ARGENTINA, BY END USER INDUSTRY, VALUE SHARE (%), 2021 VS 2028
- Figure 152:
- GLOBAL EPOXY ADHESIVE MARKET, BRAZIL, VOLUME, TONS, 2017 - 2028
- Figure 153:
- GLOBAL EPOXY ADHESIVE MARKET, BRAZIL, VALUE, USD, 2017 - 2028
- Figure 154:
- GLOBAL EPOXY ADHESIVE MARKET, BRAZIL, BY END USER INDUSTRY, VALUE SHARE (%), 2021 VS 2028
- Figure 155:
- GLOBAL EPOXY ADHESIVE MARKET, REST OF SOUTH AMERICA, VOLUME, TONS, 2017 - 2028
- Figure 156:
- GLOBAL EPOXY ADHESIVE MARKET, REST OF SOUTH AMERICA, VALUE, USD, 2017 - 2028
- Figure 157:
- GLOBAL EPOXY ADHESIVE MARKET, REST OF SOUTH AMERICA, BY END USER INDUSTRY, VALUE SHARE (%), 2021 VS 2028
- Figure 158:
- GLOBAL EPOXY ADHESIVE MARKET, MOST ACTIVE COMPANIES, BY NUMBER OF STRATEGIC MOVES, 2019 - 2021
- Figure 159:
- GLOBAL EPOXY ADHESIVE MARKET, MOST ADOPTED STRATEGIES, 2019 - 2021
- Figure 160:
- GLOBAL EPOXY ADHESIVE MARKET SHARE(%), BY MAJOR PLAYERS REVENUE, 2021
Epoxy Adhesive Industry Segmentation
Aerospace, Automotive, Building and Construction, Footwear and Leather, Healthcare, Packaging, Woodworking and Joinery are covered as segments by End User Industry. Reactive, Solvent-borne, UV Cured Adhesives, Water-borne are covered as segments by Technology. Asia-Pacific, Europe, Middle East & Africa, North America, South America are covered as segments by Region.| End User Industry | |
| Aerospace | |
| Automotive | |
| Building and Construction | |
| Footwear and Leather | |
| Healthcare | |
| Packaging | |
| Woodworking and Joinery | |
| Other End-user Industries |
| Technology | |
| Reactive | |
| Solvent-borne | |
| UV Cured Adhesives | |
| Water-borne |
| Region | ||||||||||||
| ||||||||||||
| ||||||||||||
| ||||||||||||
| ||||||||||||
|
Market Definition
- End-user Industry - Building & Construction, Packaging, Automotive, Aerospace, Woodworking & Joinery, Footwear & Leather, Healthcare, and Others are the end-user industries considered under the epoxy adhesives market.
- Product - All epoxy adhesive products are considered in the market studied
- Resin - Under the scope of the study, one component and two component based epoxies are considered
- Technology - For the purpose of this study, Water-borne, Solvent-borne, Reactive, and UV Cured adhesive technologies are taken into consideration.
Research Methodology
Mordor Intelligence follows a four-step methodology in all our reports.
- Step-1: Identify Key Variables: The quantifiable key variables (industry and extraneous) pertaining to the specific product segment and country are selected from a group of relevant variables & factors based on desk research & literature review; along with primary expert inputs. These variables are further confirmed through regression modeling (wherever required).
- Step-2: Build a Market Model: In order to build a robust forecasting methodology, the variables and factors identified in Step-1 are tested against available historical market numbers. Through an iterative process, the variables required for market forecast are set and the model is built on the basis of these variables.
- Step-3: Validate and Finalize: In this important step, all market numbers, variables and analyst calls are validated through an extensive network of primary research experts from the market studied. The respondents are selected across levels and functions to generate a holistic picture of the market studied.
- Step-4: Research Outputs: Syndicated Reports, Custom Consulting Assignments, Databases & Subscription Platforms


