Europe Agricultural Biologicals Market Size

| Icons | Lable | Value |
|---|---|---|
|
|
Study Period | 2017 - 2029 |
|
|
Base Year For Estimation | 2022 |
|
|
CAGR | 8.52 % |
|
|
Largest Share by Function | Crop Nutrition |
|
|
Largest Share by Country | France |
|
|
Market Concentration | High |
Major Players |
||
|
|
||
|
*Disclaimer: Major Players sorted in no particular order |
Europe Agricultural Biologicals Market Analysis
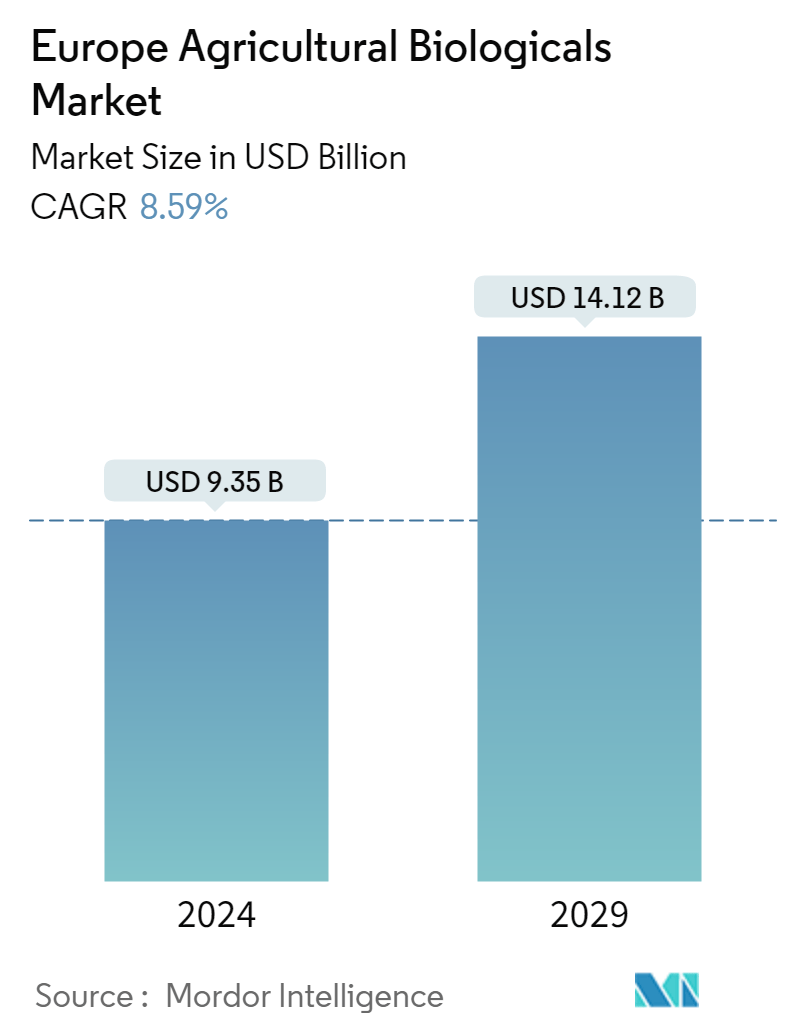
The Europe Agricultural Biologicals Market is projected to register a CAGR of 8.52%
- Meal Based Fertilizers is the Largest Form : Organic fertilizers made from meat and bone meal have an indirect positive impact on the environment by reducing the demand for mineral fertilizers and improve crop yield.
- Organic Fertilizer is the Largest Type : Organic fertilizers are high in organic matter, increases soil biological activity and helps to maintain and improve soil biodiversity and contribute to ecological function.
- Row Crops is the Largest Crop Type : The major row crops produced in the region include wheat, maize, corn, barley, and oats. The dominance of row crops is manily due large cultivation area in the region.
- France is the Largest Country : France is one of the largest organic crop producers in the European region. The overall organic crop production in the country accounts for about 1.1 million hectares in 2022.
Europe Agricultural Biologicals Market Trends
This section covers the major market trends shaping the Europe Agricultural Biologicals Market according to our research experts:
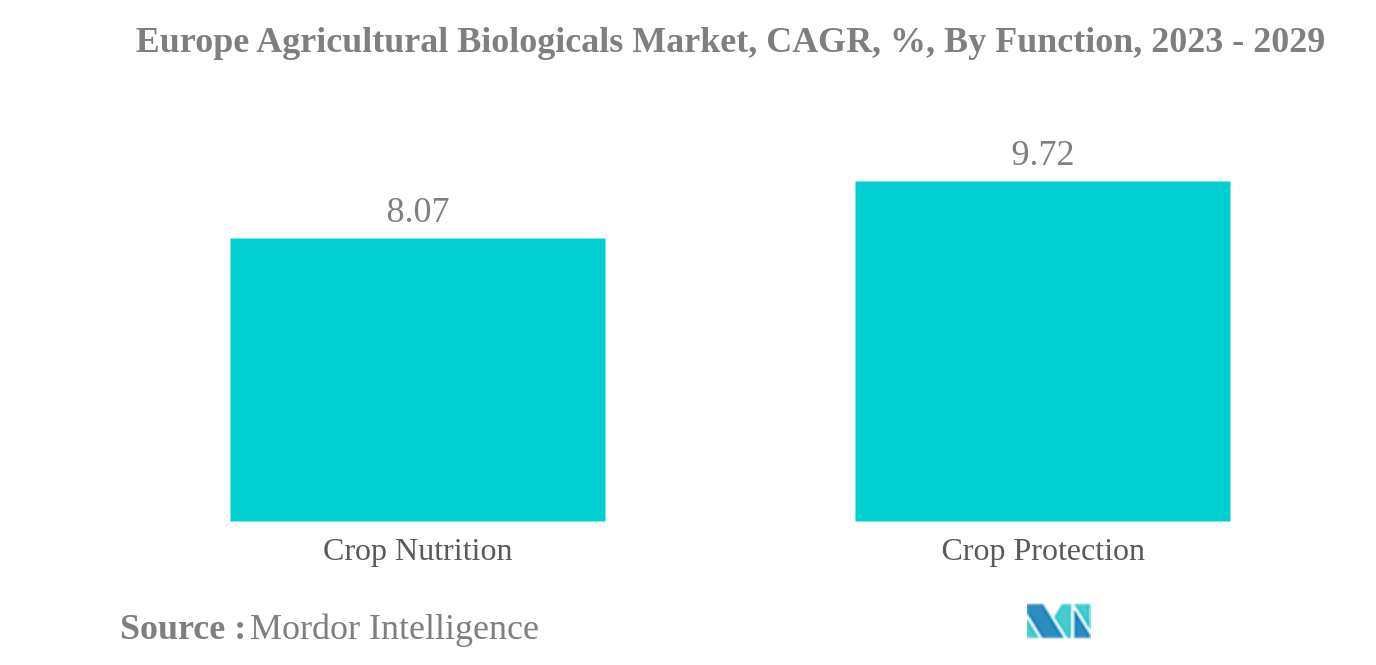
Crop Nutrition is the largest Function
- There are several adverse effects of excessive fertilizer and pesticide use on the ecosystem. Applying nutrients causes air pollution, while nitrous oxide emissions contribute to climate change and leach into water systems. The manufacturing of synthetic fertilizers is responsible for over 40% of the agricultural emissions in the European Union.
- Organic farming aims to develop agricultural systems that use and depend on non-farm inputs far less. Thus, accomplishing the goals of the Farm to Fork and Biodiversity strategies depends heavily on organic agriculture. By 2030, these goals seek to reduce fertilizer consumption by at least 20% and reduce nutrient losses by at least 50% while ensuring that soil fertility does not decline.
- In the crop nutrition segment, France occupies the largest share of 14.4%, valued at USD 847.9 million in 2022. France rose to first place in 2021 as the country experienced the strongest growth in areas dedicated to row crops in six years, amounting to 308,420 hectares, an increase of 150%. Such growth factors are expected to result in increased demand for crop nutrition products such as biofertilizers and biostimulants.
- In the crop protection segment, Italy occupied the third-largest share of 17.3%, valued at USD 364.4 million in 2022. Macrobial biocontrol agents occupied a higher share of 95.9%, valued at about USD 48.9 million in 2022 in the market, followed by microbial agents with a share of 4.1%, valued at about USD 2.0 million in the same year.
- The increasing awareness among consumers regarding the harmful impact of synthetic fertilizers has increased the demand for organic produce at the international and domestic levels. Thus, the market is expected to experience growth in the region during the forecast period.
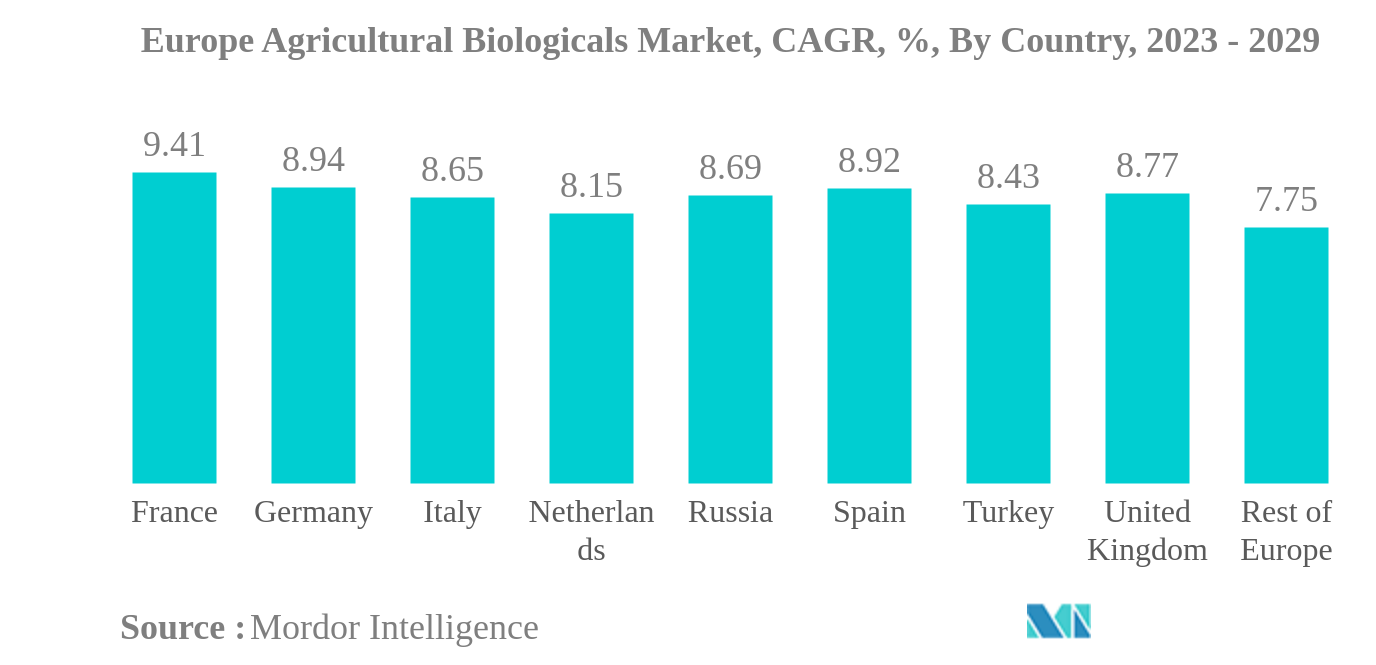
France is the largest Country
- The European region is one of the world's largest organic crop producers, and organic product consumption is high in European countries. Germany and France are some of the major organic crop producers in the region, and they have the highest organic product consumption markets.
- Organic farming is a key sector of European agriculture. In 2019, there were almost 330,000 organic farmers in Europe, reaching up to 20% share of the farming area in the Member States. In addition, one of the targets of the Farm to Fork Strategy concerns the increase in the total farmland under organic farming in Europe, with at least 25% of the EU's agricultural land to be under organic farming by 2030. These initiatives may drive the agricultural biologicals market during the forecast period.
- The overall organic area in the region increased from 4.9 million hectares in 2017 to 6.9 million lakh hectares in 2022. With this increasing trend in overall organic crop area, the biologicals market in the region also increased by about 22.9% during the historical period. It is anticipated to increase by about 63.4% during the forecast period and reach USD 14.11 billion by the end of 2029.
- As an individual country, Germany significantly contributed to the global market for organic products, with demand for organic goods reaching USD 6.3 billion in 2021, or around 10.0% of the total global demand. Germany dominates the European agricultural biologicals market, and it accounted for 8.0% of the market value in 2022.
- The European Commission schemes or projects to decrease the overall chemical inputs in agriculture and the increase in the organic crop area and demand for organic products are anticipated to drive the market during the forecast period (2023-2029).
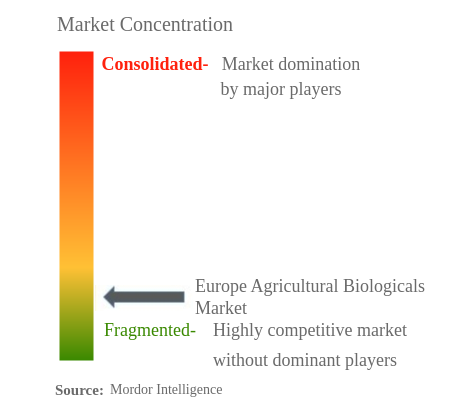
Europe Agricultural Biologicals Industry Overview
The Europe Agricultural Biologicals Market is fragmented, with the top five companies occupying 2.19%. The major players in this market are Agronutrition, Biolchim SpA, Koppert Biological Systems Inc., Symborg Inc. and Trade Corporation International (sorted alphabetically).
Europe Agricultural Biologicals Market Leaders
Agronutrition
Biolchim SpA
Koppert Biological Systems Inc.
Symborg Inc.
Trade Corporation International
*Disclaimer: Major Players sorted in no particular order
Europe Agricultural Biologicals Market News
- March 2021: Symborg opened a new hydrolysis plant in Spain, with a total investment of USD 28.0 million. The plant is designed for manufacturing sustainable agriculture products, such as biofertilizers, biostimulants, and biocontrol solutions imported to the US market.
- February 2021: Koppert developed a biofertilizer product called VICI MYCO D, which is a product based on microorganisms. It contributes to the start and development of the roots of plants as soon as crops are planted. It helps in exploiting mineral resources and improves tolerance to abiotic stresses.
- January 2021: Atlántica Agrícola’s developed Micomix, a biostimulant composed primarily of mycorrhizal fungi, rhizobacteria, and chelated micronutrients. The presence and development of these microorganisms in the rhizosphere create a symbiotic relationship with the plant that favors the absorption of water and mineral nutrients and increases its tolerance to water and salt stress.
Europe Agricultural Biologicals Market Report - Table of Contents
EXECUTIVE SUMMARY & KEY FINDINGS
REPORT OFFERS
1. INTRODUCTION
1.1. Study Assumptions & Market Definition
1.2. Scope of the Study
1.3. Research Methodology
2. KEY INDUSTRY TRENDS
2.1. Area Under Organic Cultivation
2.2. Per Capita Spending On Organic Products
2.3. Regulatory Framework
2.4. Value Chain & Distribution Channel Analysis
3. MARKET SEGMENTATION
3.1. Function
3.1.1. Crop Nutrition
3.1.1.1. Biofertilizer
3.1.1.1.1. Azospirillum
3.1.1.1.2. Azotobacter
3.1.1.1.3. Mycorrhiza
3.1.1.1.4. Phosphate Solubilizing Bacteria
3.1.1.1.5. Rhizobium
3.1.1.1.6. Other Biofertilizers
3.1.1.2. Biostimulants
3.1.1.2.1. Amino Acids
3.1.1.2.2. Fulvic Acid
3.1.1.2.3. Humic Acid
3.1.1.2.4. Protein Hydrolysates
3.1.1.2.5. Seaweed Extracts
3.1.1.2.6. Other Biostimulants
3.1.1.3. Organic Fertilizer
3.1.1.3.1. Manure
3.1.1.3.2. Meal Based Fertilizers
3.1.1.3.3. Oilcakes
3.1.1.3.4. Other Organic Fertilizers
3.1.2. Crop Protection
3.1.2.1. Biocontrol Agents
3.1.2.1.1. Macrobials
3.1.2.1.2. Microbials
3.1.2.2. Biopesticides
3.1.2.2.1. Biofungicides
3.1.2.2.2. Bioherbicides
3.1.2.2.3. Bioinsecticides
3.1.2.2.4. Other Biopesticides
3.2. Crop Type
3.2.1. Cash Crops
3.2.2. Horticultural Crops
3.2.3. Row Crops
3.3. Country
3.3.1. France
3.3.2. Germany
3.3.3. Italy
3.3.4. Netherlands
3.3.5. Russia
3.3.6. Spain
3.3.7. Turkey
3.3.8. United Kingdom
3.3.9. Rest Of Europe
4. COMPETITIVE LANDSCAPE
4.1. Key Strategic Moves
4.2. Market Share Analysis
4.3. Company Landscape
4.4. Company Profiles
4.4.1. Agronutrition
4.4.2. Andermatt Group AG
4.4.3. Atlántica Agrícola
4.4.4. Biolchim SpA
4.4.5. Bionema
4.4.6. Koppert Biological Systems Inc.
4.4.7. Lallemand Inc.
4.4.8. Suståne Natural Fertilizer, Inc
4.4.9. Symborg Inc.
4.4.10. Trade Corporation International
5. KEY STRATEGIC QUESTIONS FOR AGRICULTURAL BIOLOGICALS CEOS
6. APPENDIX
6.1. Global Overview
6.1.1. Overview
6.1.2. Porter’s Five Forces Framework
6.1.3. Global Value Chain Analysis
6.1.4. Market Dynamics (DROs)
6.2. Sources & References
6.3. List of Tables & Figures
6.4. Primary Insights
6.5. Data Pack
6.6. Glossary of Terms
List of Tables & Figures
- Figure 1:
- EUROPE AGRICULTURAL BIOLOGICALS MARKET, AREA UNDER ORGANIC CULTIVATION, HECTARES, 2017 - 2022
- Figure 2:
- EUROPE AGRICULTURAL BIOLOGICALS MARKET, PER CAPITA SPENDING ON ORGANIC PRODUCTS, USD, 2017 - 2022
- Figure 3:
- EUROPE AGRICULTURAL BIOLOGICALS MARKET, VOLUME, METRIC TON, 2017 - 2029
- Figure 4:
- EUROPE AGRICULTURAL BIOLOGICALS MARKET, VALUE, USD, 2017 - 2029
- Figure 5:
- EUROPE AGRICULTURAL BIOLOGICALS MARKET, BY FUNCTION, VOLUME, METRIC TON, 2017 - 2029
- Figure 6:
- EUROPE AGRICULTURAL BIOLOGICALS MARKET, BY FUNCTION, VALUE, USD, 2017 - 2029
- Figure 7:
- EUROPE AGRICULTURAL BIOLOGICALS MARKET, VOLUME SHARE(%), BY FUNCTION, 2017 - 2029
- Figure 8:
- EUROPE AGRICULTURAL BIOLOGICALS MARKET, VALUE SHARE(%), BY FUNCTION, 2017 - 2029
- Figure 9:
- EUROPE AGRICULTURAL BIOLOGICALS MARKET, BY TYPE, VOLUME, METRIC TON, 2017 - 2029
- Figure 10:
- EUROPE AGRICULTURAL BIOLOGICALS MARKET, BY TYPE, VALUE, USD, 2017 - 2029
- Figure 11:
- EUROPE AGRICULTURAL BIOLOGICALS MARKET, VOLUME SHARE(%), BY TYPE, 2017 - 2029
- Figure 12:
- EUROPE AGRICULTURAL BIOLOGICALS MARKET, VALUE SHARE(%), BY TYPE, 2017 - 2029
- Figure 13:
- EUROPE AGRICULTURAL BIOLOGICALS MARKET, BY FORM, VOLUME, METRIC TON, 2017 - 2029
- Figure 14:
- EUROPE AGRICULTURAL BIOLOGICALS MARKET, BY FORM, VALUE, USD, 2017 - 2029
- Figure 15:
- EUROPE AGRICULTURAL BIOLOGICALS MARKET, VOLUME SHARE(%), BY FORM, 2017 - 2029
- Figure 16:
- EUROPE AGRICULTURAL BIOLOGICALS MARKET, VALUE SHARE(%), BY FORM, 2017 - 2029
- Figure 17:
- EUROPE AGRICULTURAL BIOLOGICALS MARKET, BY FORM, VOLUME, METRIC TON, 2017 - 2029
- Figure 18:
- EUROPE AGRICULTURAL BIOLOGICALS MARKET, BY FORM, VALUE, USD, 2017 - 2029
- Figure 19:
- EUROPE AGRICULTURAL BIOLOGICALS MARKET, VALUE SHARE(%), BY CROP TYPE, 2022 - 2029
- Figure 20:
- EUROPE AGRICULTURAL BIOLOGICALS MARKET, BY FORM, VOLUME, METRIC TON, 2017 - 2029
- Figure 21:
- EUROPE AGRICULTURAL BIOLOGICALS MARKET, BY FORM, VALUE, USD, 2017 - 2029
- Figure 22:
- EUROPE AGRICULTURAL BIOLOGICALS MARKET, VALUE SHARE(%), BY CROP TYPE, 2022 - 2029
- Figure 23:
- EUROPE AGRICULTURAL BIOLOGICALS MARKET, BY FORM, VOLUME, METRIC TON, 2017 - 2029
- Figure 24:
- EUROPE AGRICULTURAL BIOLOGICALS MARKET, BY FORM, VALUE, USD, 2017 - 2029
- Figure 25:
- EUROPE AGRICULTURAL BIOLOGICALS MARKET, VALUE SHARE(%), BY CROP TYPE, 2022 - 2029
- Figure 26:
- EUROPE AGRICULTURAL BIOLOGICALS MARKET, BY FORM, VOLUME, METRIC TON, 2017 - 2029
- Figure 27:
- EUROPE AGRICULTURAL BIOLOGICALS MARKET, BY FORM, VALUE, USD, 2017 - 2029
- Figure 28:
- EUROPE AGRICULTURAL BIOLOGICALS MARKET, VALUE SHARE(%), BY CROP TYPE, 2022 - 2029
- Figure 29:
- EUROPE AGRICULTURAL BIOLOGICALS MARKET, BY FORM, VOLUME, METRIC TON, 2017 - 2029
- Figure 30:
- EUROPE AGRICULTURAL BIOLOGICALS MARKET, BY FORM, VALUE, USD, 2017 - 2029
- Figure 31:
- EUROPE AGRICULTURAL BIOLOGICALS MARKET, VALUE SHARE(%), BY CROP TYPE, 2022 - 2029
- Figure 32:
- EUROPE AGRICULTURAL BIOLOGICALS MARKET, BY FORM, VOLUME, METRIC TON, 2017 - 2029
- Figure 33:
- EUROPE AGRICULTURAL BIOLOGICALS MARKET, BY FORM, VALUE, USD, 2017 - 2029
- Figure 34:
- EUROPE AGRICULTURAL BIOLOGICALS MARKET, VALUE SHARE(%), BY CROP TYPE, 2022 - 2029
- Figure 35:
- EUROPE AGRICULTURAL BIOLOGICALS MARKET, BY FORM, VOLUME, METRIC TON, 2017 - 2029
- Figure 36:
- EUROPE AGRICULTURAL BIOLOGICALS MARKET, BY FORM, VALUE, USD, 2017 - 2029
- Figure 37:
- EUROPE AGRICULTURAL BIOLOGICALS MARKET, VOLUME SHARE(%), BY FORM, 2017 - 2029
- Figure 38:
- EUROPE AGRICULTURAL BIOLOGICALS MARKET, VALUE SHARE(%), BY FORM, 2017 - 2029
- Figure 39:
- EUROPE AGRICULTURAL BIOLOGICALS MARKET, BY FORM, VOLUME, METRIC TON, 2017 - 2029
- Figure 40:
- EUROPE AGRICULTURAL BIOLOGICALS MARKET, BY FORM, VALUE, USD, 2017 - 2029
- Figure 41:
- EUROPE AGRICULTURAL BIOLOGICALS MARKET, VALUE SHARE(%), BY CROP TYPE, 2022 - 2029
- Figure 42:
- EUROPE AGRICULTURAL BIOLOGICALS MARKET, BY FORM, VOLUME, METRIC TON, 2017 - 2029
- Figure 43:
- EUROPE AGRICULTURAL BIOLOGICALS MARKET, BY FORM, VALUE, USD, 2017 - 2029
- Figure 44:
- EUROPE AGRICULTURAL BIOLOGICALS MARKET, VALUE SHARE(%), BY CROP TYPE, 2022 - 2029
- Figure 45:
- EUROPE AGRICULTURAL BIOLOGICALS MARKET, BY FORM, VOLUME, METRIC TON, 2017 - 2029
- Figure 46:
- EUROPE AGRICULTURAL BIOLOGICALS MARKET, BY FORM, VALUE, USD, 2017 - 2029
- Figure 47:
- EUROPE AGRICULTURAL BIOLOGICALS MARKET, VALUE SHARE(%), BY CROP TYPE, 2022 - 2029
- Figure 48:
- EUROPE AGRICULTURAL BIOLOGICALS MARKET, BY FORM, VOLUME, METRIC TON, 2017 - 2029
- Figure 49:
- EUROPE AGRICULTURAL BIOLOGICALS MARKET, BY FORM, VALUE, USD, 2017 - 2029
- Figure 50:
- EUROPE AGRICULTURAL BIOLOGICALS MARKET, VALUE SHARE(%), BY CROP TYPE, 2022 - 2029
- Figure 51:
- EUROPE AGRICULTURAL BIOLOGICALS MARKET, BY FORM, VOLUME, METRIC TON, 2017 - 2029
- Figure 52:
- EUROPE AGRICULTURAL BIOLOGICALS MARKET, BY FORM, VALUE, USD, 2017 - 2029
- Figure 53:
- EUROPE AGRICULTURAL BIOLOGICALS MARKET, VALUE SHARE(%), BY CROP TYPE, 2022 - 2029
- Figure 54:
- EUROPE AGRICULTURAL BIOLOGICALS MARKET, BY FORM, VOLUME, METRIC TON, 2017 - 2029
- Figure 55:
- EUROPE AGRICULTURAL BIOLOGICALS MARKET, BY FORM, VALUE, USD, 2017 - 2029
- Figure 56:
- EUROPE AGRICULTURAL BIOLOGICALS MARKET, VALUE SHARE(%), BY CROP TYPE, 2022 - 2029
- Figure 57:
- EUROPE AGRICULTURAL BIOLOGICALS MARKET, BY FORM, VOLUME, METRIC TON, 2017 - 2029
- Figure 58:
- EUROPE AGRICULTURAL BIOLOGICALS MARKET, BY FORM, VALUE, USD, 2017 - 2029
- Figure 59:
- EUROPE AGRICULTURAL BIOLOGICALS MARKET, VOLUME SHARE(%), BY FORM, 2017 - 2029
- Figure 60:
- EUROPE AGRICULTURAL BIOLOGICALS MARKET, VALUE SHARE(%), BY FORM, 2017 - 2029
- Figure 61:
- EUROPE AGRICULTURAL BIOLOGICALS MARKET, BY FORM, VOLUME, METRIC TON, 2017 - 2029
- Figure 62:
- EUROPE AGRICULTURAL BIOLOGICALS MARKET, BY FORM, VALUE, USD, 2017 - 2029
- Figure 63:
- EUROPE AGRICULTURAL BIOLOGICALS MARKET, VALUE SHARE(%), BY CROP TYPE, 2022 - 2029
- Figure 64:
- EUROPE AGRICULTURAL BIOLOGICALS MARKET, BY FORM, VOLUME, METRIC TON, 2017 - 2029
- Figure 65:
- EUROPE AGRICULTURAL BIOLOGICALS MARKET, BY FORM, VALUE, USD, 2017 - 2029
- Figure 66:
- EUROPE AGRICULTURAL BIOLOGICALS MARKET, VALUE SHARE(%), BY CROP TYPE, 2022 - 2029
- Figure 67:
- EUROPE AGRICULTURAL BIOLOGICALS MARKET, BY FORM, VOLUME, METRIC TON, 2017 - 2029
- Figure 68:
- EUROPE AGRICULTURAL BIOLOGICALS MARKET, BY FORM, VALUE, USD, 2017 - 2029
- Figure 69:
- EUROPE AGRICULTURAL BIOLOGICALS MARKET, VALUE SHARE(%), BY CROP TYPE, 2022 - 2029
- Figure 70:
- EUROPE AGRICULTURAL BIOLOGICALS MARKET, BY FORM, VOLUME, METRIC TON, 2017 - 2029
- Figure 71:
- EUROPE AGRICULTURAL BIOLOGICALS MARKET, BY FORM, VALUE, USD, 2017 - 2029
- Figure 72:
- EUROPE AGRICULTURAL BIOLOGICALS MARKET, VALUE SHARE(%), BY CROP TYPE, 2022 - 2029
- Figure 73:
- EUROPE AGRICULTURAL BIOLOGICALS MARKET, BY TYPE, VOLUME, METRIC TON, 2017 - 2029
- Figure 74:
- EUROPE AGRICULTURAL BIOLOGICALS MARKET, BY TYPE, VALUE, USD, 2017 - 2029
- Figure 75:
- EUROPE AGRICULTURAL BIOLOGICALS MARKET, VOLUME SHARE(%), BY TYPE, 2017 - 2029
- Figure 76:
- EUROPE AGRICULTURAL BIOLOGICALS MARKET, VALUE SHARE(%), BY TYPE, 2017 - 2029
- Figure 77:
- EUROPE AGRICULTURAL BIOLOGICALS MARKET, BY FORM, VOLUME, GRAM, 2017 - 2029
- Figure 78:
- EUROPE AGRICULTURAL BIOLOGICALS MARKET, BY FORM, VALUE, USD, 2017 - 2029
- Figure 79:
- EUROPE AGRICULTURAL BIOLOGICALS MARKET, VOLUME SHARE(%), BY FORM, 2017 - 2029
- Figure 80:
- EUROPE AGRICULTURAL BIOLOGICALS MARKET, VALUE SHARE(%), BY FORM, 2017 - 2029
- Figure 81:
- EUROPE AGRICULTURAL BIOLOGICALS MARKET, BY FORM, VOLUME, GRAM, 2017 - 2029
- Figure 82:
- EUROPE AGRICULTURAL BIOLOGICALS MARKET, BY FORM, VALUE, USD, 2017 - 2029
- Figure 83:
- EUROPE AGRICULTURAL BIOLOGICALS MARKET, VALUE SHARE(%), BY CROP TYPE, 2022 - 2029
- Figure 84:
- EUROPE AGRICULTURAL BIOLOGICALS MARKET, BY FORM, VOLUME, GRAM, 2017 - 2029
- Figure 85:
- EUROPE AGRICULTURAL BIOLOGICALS MARKET, BY FORM, VALUE, USD, 2017 - 2029
- Figure 86:
- EUROPE AGRICULTURAL BIOLOGICALS MARKET, VALUE SHARE(%), BY CROP TYPE, 2022 - 2029
- Figure 87:
- EUROPE AGRICULTURAL BIOLOGICALS MARKET, BY FORM, VOLUME, METRIC TON, 2017 - 2029
- Figure 88:
- EUROPE AGRICULTURAL BIOLOGICALS MARKET, BY FORM, VALUE, USD, 2017 - 2029
- Figure 89:
- EUROPE AGRICULTURAL BIOLOGICALS MARKET, VOLUME SHARE(%), BY FORM, 2017 - 2029
- Figure 90:
- EUROPE AGRICULTURAL BIOLOGICALS MARKET, VALUE SHARE(%), BY FORM, 2017 - 2029
- Figure 91:
- EUROPE AGRICULTURAL BIOLOGICALS MARKET, BY FORM, VOLUME, METRIC TON, 2017 - 2029
- Figure 92:
- EUROPE AGRICULTURAL BIOLOGICALS MARKET, BY FORM, VALUE, USD, 2017 - 2029
- Figure 93:
- EUROPE AGRICULTURAL BIOLOGICALS MARKET, VALUE SHARE(%), BY CROP TYPE, 2022 - 2029
- Figure 94:
- EUROPE AGRICULTURAL BIOLOGICALS MARKET, BY FORM, VOLUME, METRIC TON, 2017 - 2029
- Figure 95:
- EUROPE AGRICULTURAL BIOLOGICALS MARKET, BY FORM, VALUE, USD, 2017 - 2029
- Figure 96:
- EUROPE AGRICULTURAL BIOLOGICALS MARKET, VALUE SHARE(%), BY CROP TYPE, 2022 - 2029
- Figure 97:
- EUROPE AGRICULTURAL BIOLOGICALS MARKET, BY FORM, VOLUME, METRIC TON, 2017 - 2029
- Figure 98:
- EUROPE AGRICULTURAL BIOLOGICALS MARKET, BY FORM, VALUE, USD, 2017 - 2029
- Figure 99:
- EUROPE AGRICULTURAL BIOLOGICALS MARKET, VALUE SHARE(%), BY CROP TYPE, 2022 - 2029
- Figure 100:
- EUROPE AGRICULTURAL BIOLOGICALS MARKET, BY FORM, VOLUME, METRIC TON, 2017 - 2029
- Figure 101:
- EUROPE AGRICULTURAL BIOLOGICALS MARKET, BY FORM, VALUE, USD, 2017 - 2029
- Figure 102:
- EUROPE AGRICULTURAL BIOLOGICALS MARKET, VALUE SHARE(%), BY CROP TYPE, 2022 - 2029
- Figure 103:
- EUROPE AGRICULTURAL BIOLOGICALS MARKET, BY CROP TYPE, VOLUME, METRIC TON, 2017 - 2029
- Figure 104:
- EUROPE AGRICULTURAL BIOLOGICALS MARKET, BY CROP TYPE, VALUE, USD, 2017 - 2029
- Figure 105:
- EUROPE AGRICULTURAL BIOLOGICALS MARKET, VOLUME SHARE(%), BY CROP TYPE, 2017 - 2029
- Figure 106:
- EUROPE AGRICULTURAL BIOLOGICALS MARKET, VALUE SHARE(%), BY CROP TYPE, 2017 - 2029
- Figure 107:
- EUROPE AGRICULTURAL BIOLOGICALS MARKET, BY CROP TYPE, VOLUME, METRIC TON, 2017 - 2029
- Figure 108:
- EUROPE AGRICULTURAL BIOLOGICALS MARKET, BY CROP TYPE, VALUE, USD, 2017 - 2029
- Figure 109:
- EUROPE AGRICULTURAL BIOLOGICALS MARKET, VALUE SHARE(%), BY FUNCTION, 2022 - 2029
- Figure 110:
- EUROPE AGRICULTURAL BIOLOGICALS MARKET, BY CROP TYPE, VOLUME, METRIC TON, 2017 - 2029
- Figure 111:
- EUROPE AGRICULTURAL BIOLOGICALS MARKET, BY CROP TYPE, VALUE, USD, 2017 - 2029
- Figure 112:
- EUROPE AGRICULTURAL BIOLOGICALS MARKET, VALUE SHARE(%), BY FUNCTION, 2022 - 2029
- Figure 113:
- EUROPE AGRICULTURAL BIOLOGICALS MARKET, BY CROP TYPE, VOLUME, METRIC TON, 2017 - 2029
- Figure 114:
- EUROPE AGRICULTURAL BIOLOGICALS MARKET, BY CROP TYPE, VALUE, USD, 2017 - 2029
- Figure 115:
- EUROPE AGRICULTURAL BIOLOGICALS MARKET, VALUE SHARE(%), BY FUNCTION, 2022 - 2029
- Figure 116:
- EUROPE AGRICULTURAL BIOLOGICALS MARKET, BY COUNTRY, VOLUME, METRIC TON, 2017 - 2029
- Figure 117:
- EUROPE AGRICULTURAL BIOLOGICALS MARKET, BY COUNTRY, VALUE, USD, 2017 - 2029
- Figure 118:
- EUROPE AGRICULTURAL BIOLOGICALS MARKET, VOLUME SHARE(%), BY COUNTRY, 2017 - 2029
- Figure 119:
- EUROPE AGRICULTURAL BIOLOGICALS MARKET, VALUE SHARE(%), BY COUNTRY, 2017 - 2029
- Figure 120:
- EUROPE AGRICULTURAL BIOLOGICALS MARKET, BY COUNTRY, VOLUME, METRIC TON, 2017 - 2029
- Figure 121:
- EUROPE AGRICULTURAL BIOLOGICALS MARKET, BY COUNTRY, VALUE, USD, 2017 - 2029
- Figure 122:
- EUROPE AGRICULTURAL BIOLOGICALS MARKET, VALUE SHARE(%), BY FUNCTION, 2022 - 2029
- Figure 123:
- EUROPE AGRICULTURAL BIOLOGICALS MARKET, BY COUNTRY, VOLUME, METRIC TON, 2017 - 2029
- Figure 124:
- EUROPE AGRICULTURAL BIOLOGICALS MARKET, BY COUNTRY, VALUE, USD, 2017 - 2029
- Figure 125:
- EUROPE AGRICULTURAL BIOLOGICALS MARKET, VALUE SHARE(%), BY FUNCTION, 2022 - 2029
- Figure 126:
- EUROPE AGRICULTURAL BIOLOGICALS MARKET, BY COUNTRY, VOLUME, METRIC TON, 2017 - 2029
- Figure 127:
- EUROPE AGRICULTURAL BIOLOGICALS MARKET, BY COUNTRY, VALUE, USD, 2017 - 2029
- Figure 128:
- EUROPE AGRICULTURAL BIOLOGICALS MARKET, VALUE SHARE(%), BY FUNCTION, 2022 - 2029
- Figure 129:
- EUROPE AGRICULTURAL BIOLOGICALS MARKET, BY COUNTRY, VOLUME, METRIC TON, 2017 - 2029
- Figure 130:
- EUROPE AGRICULTURAL BIOLOGICALS MARKET, BY COUNTRY, VALUE, USD, 2017 - 2029
- Figure 131:
- EUROPE AGRICULTURAL BIOLOGICALS MARKET, VALUE SHARE(%), BY FUNCTION, 2022 - 2029
- Figure 132:
- EUROPE AGRICULTURAL BIOLOGICALS MARKET, BY COUNTRY, VOLUME, METRIC TON, 2017 - 2029
- Figure 133:
- EUROPE AGRICULTURAL BIOLOGICALS MARKET, BY COUNTRY, VALUE, USD, 2017 - 2029
- Figure 134:
- EUROPE AGRICULTURAL BIOLOGICALS MARKET, VALUE SHARE(%), BY FUNCTION, 2022 - 2029
- Figure 135:
- EUROPE AGRICULTURAL BIOLOGICALS MARKET, BY COUNTRY, VOLUME, METRIC TON, 2017 - 2029
- Figure 136:
- EUROPE AGRICULTURAL BIOLOGICALS MARKET, BY COUNTRY, VALUE, USD, 2017 - 2029
- Figure 137:
- EUROPE AGRICULTURAL BIOLOGICALS MARKET, VALUE SHARE(%), BY FUNCTION, 2022 - 2029
- Figure 138:
- EUROPE AGRICULTURAL BIOLOGICALS MARKET, BY COUNTRY, VOLUME, METRIC TON, 2017 - 2029
- Figure 139:
- EUROPE AGRICULTURAL BIOLOGICALS MARKET, BY COUNTRY, VALUE, USD, 2017 - 2029
- Figure 140:
- EUROPE AGRICULTURAL BIOLOGICALS MARKET, VALUE SHARE(%), BY FUNCTION, 2022 - 2029
- Figure 141:
- EUROPE AGRICULTURAL BIOLOGICALS MARKET, BY COUNTRY, VOLUME, METRIC TON, 2017 - 2029
- Figure 142:
- EUROPE AGRICULTURAL BIOLOGICALS MARKET, BY COUNTRY, VALUE, USD, 2017 - 2029
- Figure 143:
- EUROPE AGRICULTURAL BIOLOGICALS MARKET, VALUE SHARE(%), BY FUNCTION, 2022 - 2029
- Figure 144:
- EUROPE AGRICULTURAL BIOLOGICALS MARKET, BY COUNTRY, VOLUME, METRIC TON, 2017 - 2029
- Figure 145:
- EUROPE AGRICULTURAL BIOLOGICALS MARKET, BY COUNTRY, VALUE, USD, 2017 - 2029
- Figure 146:
- EUROPE AGRICULTURAL BIOLOGICALS MARKET, VALUE SHARE(%), BY FUNCTION, 2022 - 2029
- Figure 147:
- EUROPE AGRICULTURAL BIOLOGICALS MARKET, MOST ACTIVE COMPANIES, BY NUMBER OF STRATEGIC MOVES, 2017-2022
- Figure 148:
- EUROPE AGRICULTURAL BIOLOGICALS MARKET, MOST ADOPTED STRATEGIES, 2017-2022
- Figure 149:
- EUROPE AGRICULTURAL BIOLOGICALS MARKET SHARE(%), BY MAJOR PLAYERS, 2022
Europe Agricultural Biologicals Industry Segmentation
Crop Nutrition, Crop Protection are covered as segments by Function. Cash Crops, Horticultural Crops, Row Crops are covered as segments by Crop Type. France, Germany, Italy, Netherlands, Russia, Spain, Turkey, United Kingdom are covered as segments by Country.| Function | ||||||||||||||||||||||||
| ||||||||||||||||||||||||
|
| Crop Type | |
| Cash Crops | |
| Horticultural Crops | |
| Row Crops |
| Country | |
| France | |
| Germany | |
| Italy | |
| Netherlands | |
| Russia | |
| Spain | |
| Turkey | |
| United Kingdom | |
| Rest Of Europe |
Market Definition
- AVERAGE DOSAGE RATE - This refers to the average volume of agricultural biologicals applied per hectare of farmland in the respective region/country.
- CROP TYPE - Row Crops: Cereals, Pulses, Oilseeds, and Forage Crops Horticulture: Fruits, and Vegetables, Cash Crops: Plantation Crops and Spices.
- FUNCTIONS - Crop Nutrition: Organic Fertilizer, Biofertilizer, Biostimulants. Crop Protection: Biopesticides, Biocontrol Agents
- MARKET ESTIMATION LEVEL - Market Estimations for various types of agricultural biologicals has been done at the product-level.
Research Methodology
Mordor Intelligence follows a four-step methodology in all our reports.
- Step-1: Identify Key Variables: In order to build a robust forecasting methodology, the variables and factors identified in Step-1 are tested against available historical market numbers. Through an iterative process, the variables required for market forecast are set and the model is built on the basis of these variables.
- Step-2: Build a Market Model: Market-size estimations for the forecast years are in nominal terms. Inflation is not a part of the pricing, and the average selling price (ASP) is kept constant throughout the forecast period.
- Step-3: Validate and Finalize: In this important step, all market numbers, variables and analyst calls are validated through an extensive network of primary research experts from the market studied. The respondents are selected across levels and functions to generate a holistic picture of the market studied.
- Step-4: Research Outputs: Syndicated Reports, Custom Consulting Assignments, Databases & Subscription Platforms.


