Europe Animal Protein Market Size

| Icons | Lable | Value |
|---|---|---|
|
|
Study Period | 2017 - 2029 |
|
|
Base Year For Estimation | 2022 |
|
|
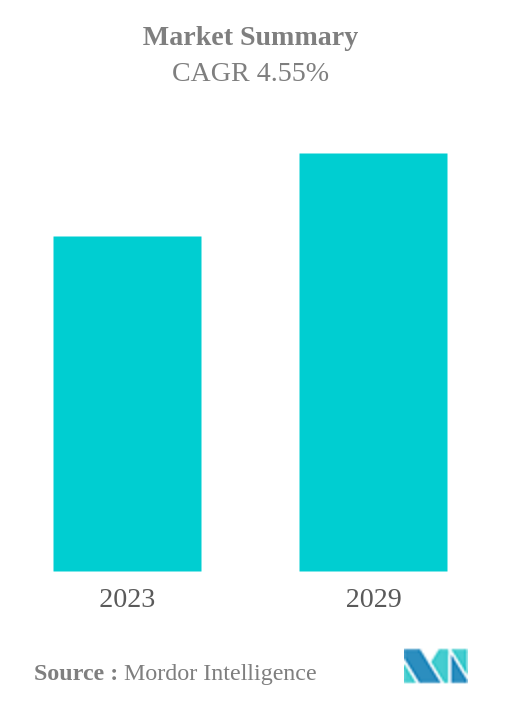
CAGR | 4.55 % |
|
|
Largest Share by End User | Food and Beverages |
|
|
Largest Share by Country | Russia |
|
|
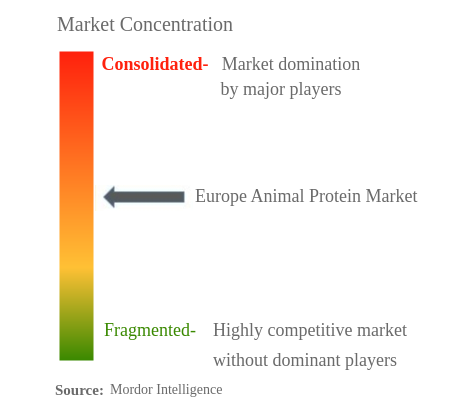
Market Concentration | High |
Major Players |
||
|
|
||
|
*Disclaimer: Major Players sorted in no particular order |
Europe Animal Protein Market Analysis
The Europe Animal Protein Market is projected to register a CAGR of 4.55%
- Gelatin is the Largest Protein Type: In Europe, the food industry is the largest contributor to the growth of gelatin as it is considered optimal for bakery and confectionery segments.
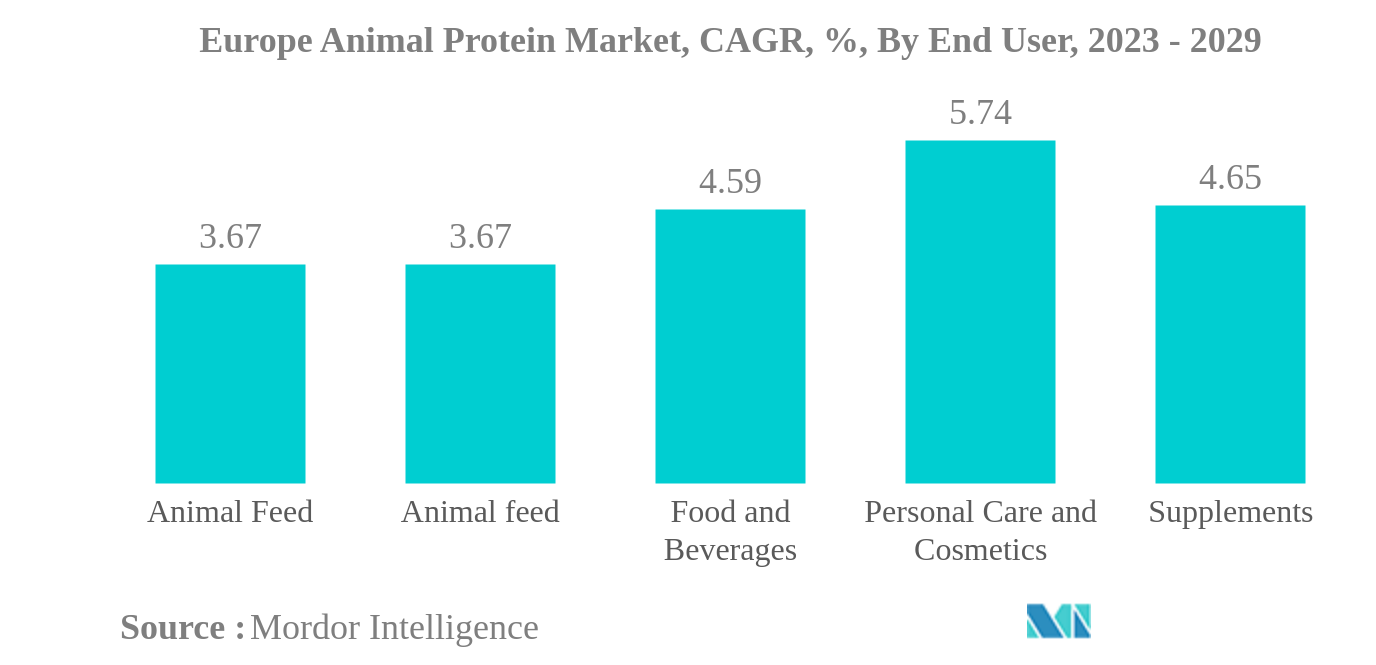
- Food and Beverages is the Largest End User: Increased demand for healthy foods, especially skin-boosting foods, has boosted animal protein demand in the F&B market, making it a leader in the end-user category.
- Collagen is the Fastest-growing Protein Type: The ingredient possesses multi-functionality and contributes to enhanced texture leading the food and beverages industry to drive segmental growth, mainly in bakery.
- Personal Care and Cosmetics is the Fastest-growing End User: Protein-enriched skin, body, and hair care products are on the rise. Players are offering protein ingredients with distinct concentrations as per requirements, which is boosting the segment.
Europe Animal Protein Market Trends
This section covers the major market trends shaping the Europe Animal Protein Market according to our research experts:
Food and Beverages is the largest End User
- The market has animal protein applications in many end-user segments, primarily driven by the F&B and supplements segments. In 2022, the two segments together held a share of 40% of animal protein volume consumed in Europe. Increased consumption of gelatin as an emulsifier in protein-based products is the major factor driving the market. In 2021, 60% of millennials and Gen Z consumers sought curated baked bakeries that offered functional bakery goods in Europe.
- The supplements have been gaining acceptance among the rising number of fitness enthusiasts in the region. In fact, under the supplements segment, sports/performance nutrition remained the most dominant and yet the fastest-growing sub-segment, with a projected CAGR of 5.40%, by volume, during the forecast period. Over the review period, the number of members in health and fitness clubs in Europe rose by about 12 million. This increase portrays a vast potential for products like protein powders. Top athletes are increasingly influencing millennials worldwide. Due to this, the demand for energizing products and weight management sports nutrition is surging.
- Insect protein dominates the animal feed market and is anticipated to register a CAGR of 2.39%, by value, throughout the forecast period. In Europe, more than USD 1 billion has been invested in this sector since its establishment, and this figure is expected to reach USD 2.95 billion at the end of the forecast period. The use of insect-processed animal proteins (PAPs) in poultry and pig feed was approved by the European Union in 2021, which is expected to create new opportunities, beginning with the introduction of such components into such animals' diets. The following usage of insects in organically raised poultry and pigs is expected to drive the market.
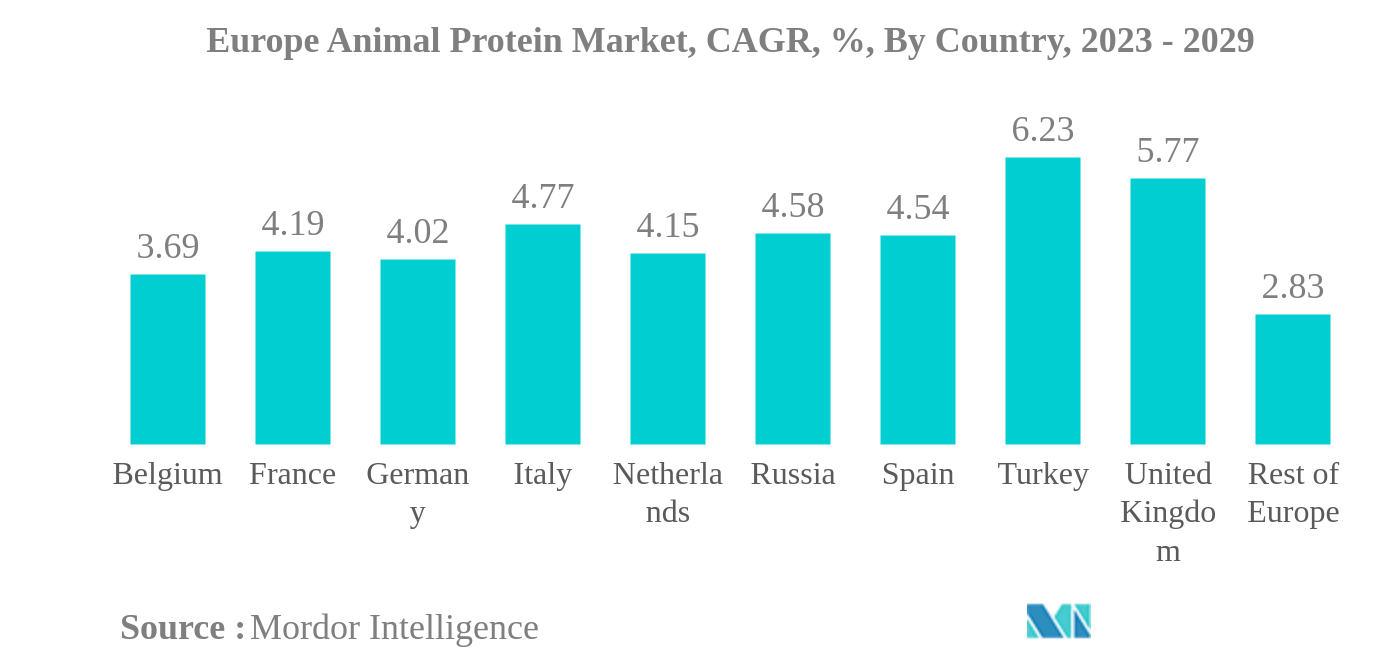
Russia is the largest Country
- By country, Russia retained its top position in 2022. Food and beverages remained the largest consumer of animal proteins, with the bakery segment accounting for a major volume of 54% during the base year. Animal proteins, such as gelatin and collagen, are widely used in making cakes and pastries. Cakes and pastries make up the second-largest industry, holding 11% of the market shares in the region. An average Russian citizen consumes about 260 pounds of baked goods per year. In 2020, the country had over 690 large bakeries, 4,800 mid-sized enterprises, and more than 7,000 small and micro-bakeries.
- The UK whey protein market holds a share of 26.27% in Europe. It is one of the strongest markets in Europe. Whey protein has increased applications in the supplements and food and beverage industries in the United Kingdom. Almost 3.5 million Britons were recorded to have had type-3 diabetes in 2020. To cope with diabetes, whey protein is effective as it instantly increases the insulin level. The intake of whey protein supplements helps people with type-3 diabetes control their blood sugar levels. As a result, there is a steady increase in the demand for whey protein in the supplements segment.
- Germany holds a significant share of the animal protein market. Gelatin protein (26.85%) and whey protein (20.14%) hold the major market shares in the country. Gelatin protein is dominated by the food and beverage sector, and the beverage sub-segment is the fastest-growing in the market. In 2021, an average German consumed 9.9 liters per capita of fruit juice. Gelatin is effective in removing fruit juice precipitates that might cause haze. Gelatin, when used in doses of 1%-5% concentrations, aids the retention of natural fluids and improves texture and flavor.
Europe Animal Protein Industry Overview
The Europe Animal Protein Market is moderately consolidated, with the top five companies occupying 41.77%. The major players in this market are Agrial Enterprise, Arla Foods amba, Darling Ingredients Inc., Koninklijke FrieslandCampina NV and SAS Gelatines Weishardt (sorted alphabetically).
Europe Animal Protein Market Leaders
Agrial Enterprise
Arla Foods amba
Darling Ingredients Inc.
Koninklijke FrieslandCampina NV
SAS Gelatines Weishardt
*Disclaimer: Major Players sorted in no particular order
Europe Animal Protein Market News
- November 2021: Lactalis Ingredients launched new high-protein product concepts using Pronativ® Native Micellar Casein and Pronativ® Native Whey Protein. Some of the derived concepts are high-protein shakes and high-protein pudding.
- April 2021: Ÿnsect acquired Protifarm, one of the leading insect protein producers for human applications. The joint offering accelerated its manufacturing capabilities with a third production site, strengthening Ÿnsect’s position in the global insect protein market.
- February 2021: Lactalis Ingredients launched a new Pronativ Native Micellar Casein, marketed as a pure and natural protein. It uses a cold filtration method to extract whey directly from milk without adding additives or chemicals.
Europe Animal Protein Market Report - Table of Contents
EXECUTIVE SUMMARY & KEY FINDINGS
1. INTRODUCTION
1.1. Study Assumptions & Market Definition
1.2. Scope of the Study
1.3. Research Methodology
2. KEY INDUSTRY TRENDS
2.1. End User Market Volume
2.2. Protein Consumption Trends
2.3. Production Trends
2.4. Regulatory Framework
2.5. Value Chain & Distribution Channel Analysis
3. MARKET SEGMENTATION
3.1. Protein Type
3.1.1. Casein and Caseinates
3.1.2. Collagen
3.1.3. Egg Protein
3.1.4. Gelatin
3.1.5. Insect Protein
3.1.6. Milk Protein
3.1.7. Whey Protein
3.1.8. Other Animal Protein
3.2. End User
3.2.1. Animal Feed
3.2.2. Food and Beverages
3.2.2.1. By Sub End User
3.2.2.1.1. Bakery
3.2.2.1.2. Beverages
3.2.2.1.3. Breakfast Cereals
3.2.2.1.4. Condiments/Sauces
3.2.2.1.5. Confectionery
3.2.2.1.6. Dairy and Dairy Alternative Products
3.2.2.1.7. RTE/RTC Food Products
3.2.2.1.8. Snacks
3.2.3. Personal Care and Cosmetics
3.2.4. Supplements
3.2.4.1. By Sub End User
3.2.4.1.1. Baby Food and Infant Formula
3.2.4.1.2. Elderly Nutrition and Medical Nutrition
3.2.4.1.3. Sport/Performance Nutrition
3.3. Country
3.3.1. Belgium
3.3.2. France
3.3.3. Germany
3.3.4. Italy
3.3.5. Netherlands
3.3.6. Russia
3.3.7. Spain
3.3.8. Turkey
3.3.9. United Kingdom
3.3.10. Rest of Europe
4. COMPETITIVE LANDSCAPE
4.1. Key Strategic Moves
4.2. Market Share Analysis
4.3. Company Landscape
4.4. Company Profiles
4.4.1. Agrial Enterprise
4.4.2. Arla Foods amba
4.4.3. Darling Ingredients Inc.
4.4.4. Groupe LACTALIS
4.4.5. Koninklijke FrieslandCampina NV
4.4.6. Lactoprot Deutschland GmbH
4.4.7. LAÏTA
4.4.8. SAS Gelatines Weishardt
4.4.9. Ÿnsect
5. KEY STRATEGIC QUESTIONS FOR PROTEIN INGREDIENTS INDUSTRY CEOS
6. APPENDIX
6.1. Global Overview
6.1.1. Overview
6.1.2. Porter’s Five Forces Framework
6.1.3. Global Value Chain Analysis
6.1.4. Market Dynamics (DROs)
6.2. Sources & References
6.3. List of Tables & Figures
6.4. Primary Insights
6.5. Data Pack
6.6. Glossary of Terms
List of Tables & Figures
- Figure 1:
- EUROPE BABY FOOD AND INFANT FORMULA MARKET, VOLUME IN METRIC TONNES, 2017 - 2029
- Figure 2:
- EUROPE BAKERY MARKET, VOLUME IN METRIC TONNES, 2017 - 2029
- Figure 3:
- EUROPE BEVERAGES MARKET, VOLUME IN METRIC TONNES, 2017 - 2029
- Figure 4:
- EUROPE BREAKFAST CEREALS MARKET, VOLUME IN METRIC TONNES, 2017 - 2029
- Figure 5:
- EUROPE CONDIMENTS/SAUCES MARKET, VOLUME IN METRIC TONNES, 2017 - 2029
- Figure 6:
- EUROPE CONFECTIONERY MARKET, VOLUME IN METRIC TONNES, 2017 - 2029
- Figure 7:
- EUROPE DAIRY AND DAIRY ALTERNATIVE PRODUCTS MARKET, VOLUME IN METRIC TONNES, 2017 - 2029
- Figure 8:
- EUROPE ELDERLY NUTRITION AND MEDICAL NUTRITION MARKET, VOLUME IN METRIC TONNES, 2017 - 2029
- Figure 9:
- EUROPE MEAT/POULTRY/SEAFOOD AND MEAT ALTERNATIVE PRODUCTS MARKET, VOLUME IN METRIC TONNES, 2017 - 2029
- Figure 10:
- EUROPE RTE/RTC FOOD PRODUCTS MARKET, VOLUME IN METRIC TONNES, 2017 - 2029
- Figure 11:
- EUROPE SNACKS MARKET, VOLUME IN METRIC TONNES, 2017 - 2029
- Figure 12:
- EUROPE SPORT/PERFORMANCE NUTRITION MARKET, VOLUME IN METRIC TONNES, 2017 - 2029
- Figure 13:
- EUROPE ANIMAL FEED MARKET, VOLUME IN METRIC TONNES, 2017 - 2029
- Figure 14:
- EUROPE PERSONAL CARE AND COSMETICS MARKET, VOLUME IN METRIC TONNES, 2017 - 2029
- Figure 15:
- EUROPE PER CAPITA CONSUMPTION OF ANIMAL PROTEIN, IN GRAM, 2017 - 2029
- Figure 16:
- EUROPE ANIMAL PROTEIN RAW MATERIAL PRODUCTION, IN METRIC TONNES, 2017 - 2021
- Figure 17:
- EUROPE ANIMAL PROTEIN MARKET, 2015-2026
- Figure 18:
- EUROPE ANIMAL PROTEIN MARKET, 2015-2026
- Figure 19:
- EUROPE ANIMAL PROTEIN MARKET, VOLUME IN METRIC TONNES, BY PROTEIN TYPE, 2017 - 2029
- Figure 20:
- EUROPE ANIMAL PROTEIN MARKET, VALUE IN USD, BY PROTEIN TYPE, 2017 - 2029
- Figure 21:
- EUROPE ANIMAL PROTEIN MARKET, VALUE SHARE (%), BY PROTEIN TYPE, 2017 VS 2023 VS 2029
- Figure 22:
- EUROPE ANIMAL PROTEIN MARKET, VOLUME SHARE (%), BY PROTEIN TYPE, 2017 VS 2023 VS 2029
- Figure 23:
- EUROPE ANIMAL PROTEIN MARKET, VOLUME IN METRIC TONNES, CASEIN AND CASEINATES, 2017 - 2029
- Figure 24:
- EUROPE ANIMAL PROTEIN MARKET, VALUE IN USD, CASEIN AND CASEINATES, 2017 - 2029
- Figure 25:
- EUROPE ANIMAL PROTEIN MARKET, CASEIN AND CASEINATES, VALUE SHARE (%), BY END USER, 2022 VS 2029
- Figure 26:
- EUROPE ANIMAL PROTEIN MARKET, VOLUME IN METRIC TONNES, COLLAGEN, 2017 - 2029
- Figure 27:
- EUROPE ANIMAL PROTEIN MARKET, VALUE IN USD, COLLAGEN, 2017 - 2029
- Figure 28:
- EUROPE ANIMAL PROTEIN MARKET, COLLAGEN, VALUE SHARE (%), BY END USER, 2022 VS 2029
- Figure 29:
- EUROPE ANIMAL PROTEIN MARKET, VOLUME IN METRIC TONNES, EGG PROTEIN, 2017 - 2029
- Figure 30:
- EUROPE ANIMAL PROTEIN MARKET, VALUE IN USD, EGG PROTEIN, 2017 - 2029
- Figure 31:
- EUROPE ANIMAL PROTEIN MARKET, EGG PROTEIN, VALUE SHARE (%), BY END USER, 2022 VS 2029
- Figure 32:
- EUROPE ANIMAL PROTEIN MARKET, VOLUME IN METRIC TONNES, GELATIN, 2017 - 2029
- Figure 33:
- EUROPE ANIMAL PROTEIN MARKET, VALUE IN USD, GELATIN, 2017 - 2029
- Figure 34:
- EUROPE ANIMAL PROTEIN MARKET, GELATIN, VALUE SHARE (%), BY END USER, 2022 VS 2029
- Figure 35:
- EUROPE ANIMAL PROTEIN MARKET, VOLUME IN METRIC TONNES, INSECT PROTEIN, 2017 - 2029
- Figure 36:
- EUROPE ANIMAL PROTEIN MARKET, VALUE IN USD, INSECT PROTEIN, 2017 - 2029
- Figure 37:
- EUROPE ANIMAL PROTEIN MARKET, INSECT PROTEIN, VALUE SHARE (%), BY END USER, 2022 VS 2029
- Figure 38:
- EUROPE ANIMAL PROTEIN MARKET, VOLUME IN METRIC TONNES, MILK PROTEIN, 2017 - 2029
- Figure 39:
- EUROPE ANIMAL PROTEIN MARKET, VALUE IN USD, MILK PROTEIN, 2017 - 2029
- Figure 40:
- EUROPE ANIMAL PROTEIN MARKET, MILK PROTEIN, VALUE SHARE (%), BY END USER, 2022 VS 2029
- Figure 41:
- EUROPE ANIMAL PROTEIN MARKET, VOLUME IN METRIC TONNES, WHEY PROTEIN, 2017 - 2029
- Figure 42:
- EUROPE ANIMAL PROTEIN MARKET, VALUE IN USD, WHEY PROTEIN, 2017 - 2029
- Figure 43:
- EUROPE ANIMAL PROTEIN MARKET, WHEY PROTEIN, VALUE SHARE (%), BY END USER, 2022 VS 2029
- Figure 44:
- EUROPE ANIMAL PROTEIN MARKET, VOLUME IN METRIC TONNES, OTHER ANIMAL PROTEIN, 2017 - 2029
- Figure 45:
- EUROPE ANIMAL PROTEIN MARKET, VALUE IN USD, OTHER ANIMAL PROTEIN, 2017 - 2029
- Figure 46:
- EUROPE ANIMAL PROTEIN MARKET, OTHER ANIMAL PROTEIN, VALUE SHARE (%), BY END USER, 2022 VS 2029
- Figure 47:
- EUROPE ANIMAL PROTEIN MARKET, VOLUME IN METRIC TONNES, BY END USER, 2017 - 2029
- Figure 48:
- EUROPE ANIMAL PROTEIN MARKET, VALUE IN USD, BY END USER, 2017 - 2029
- Figure 49:
- EUROPE ANIMAL PROTEIN MARKET, VALUE SHARE (%), BY END USER, 2017 VS 2023 VS 2029
- Figure 50:
- EUROPE ANIMAL PROTEIN MARKET, VOLUME SHARE (%), BY END USER, 2017 VS 2023 VS 2029
- Figure 51:
- EUROPE ANIMAL PROTEIN MARKET, VOLUME IN METRIC TONNES, ANIMAL FEED, 2017 - 2029
- Figure 52:
- EUROPE ANIMAL PROTEIN MARKET, VALUE IN USD, ANIMAL FEED, 2017 - 2029
- Figure 53:
- EUROPE ANIMAL PROTEIN MARKET, ANIMAL FEED, VALUE SHARE (%), BY PROTEIN TYPE, 2022 VS 2029
- Figure 54:
- EUROPE ANIMAL PROTEIN MARKET, VOLUME IN METRIC TONNES, BY SUB END USER, 2017 - 2029
- Figure 55:
- EUROPE ANIMAL PROTEIN MARKET, VALUE IN USD, BY SUB END USER, 2017 - 2029
- Figure 56:
- EUROPE ANIMAL PROTEIN MARKET, VALUE SHARE (%), BY SUB END USER, 2017 VS 2023 VS 2029
- Figure 57:
- EUROPE ANIMAL PROTEIN MARKET, VOLUME SHARE (%), BY SUB END USER, 2017 VS 2023 VS 2029
- Figure 58:
- EUROPE ANIMAL PROTEIN MARKET, VOLUME IN METRIC TONNES, BAKERY, 2017 - 2029
- Figure 59:
- EUROPE ANIMAL PROTEIN MARKET, VALUE IN USD, BAKERY, 2017 - 2029
- Figure 60:
- EUROPE ANIMAL PROTEIN MARKET, BAKERY, VALUE SHARE (%), BY PROTEIN TYPE, 2022 VS 2029
- Figure 61:
- EUROPE ANIMAL PROTEIN MARKET, VOLUME IN METRIC TONNES, BEVERAGES, 2017 - 2029
- Figure 62:
- EUROPE ANIMAL PROTEIN MARKET, VALUE IN USD, BEVERAGES, 2017 - 2029
- Figure 63:
- EUROPE ANIMAL PROTEIN MARKET, BEVERAGES, VALUE SHARE (%), BY PROTEIN TYPE, 2022 VS 2029
- Figure 64:
- EUROPE ANIMAL PROTEIN MARKET, VOLUME IN METRIC TONNES, BREAKFAST CEREALS, 2017 - 2029
- Figure 65:
- EUROPE ANIMAL PROTEIN MARKET, VALUE IN USD, BREAKFAST CEREALS, 2017 - 2029
- Figure 66:
- EUROPE ANIMAL PROTEIN MARKET, BREAKFAST CEREALS, VALUE SHARE (%), BY PROTEIN TYPE, 2022 VS 2029
- Figure 67:
- EUROPE ANIMAL PROTEIN MARKET, VOLUME IN METRIC TONNES, CONDIMENTS/SAUCES, 2017 - 2029
- Figure 68:
- EUROPE ANIMAL PROTEIN MARKET, VALUE IN USD, CONDIMENTS/SAUCES, 2017 - 2029
- Figure 69:
- EUROPE ANIMAL PROTEIN MARKET, CONDIMENTS/SAUCES, VALUE SHARE (%), BY PROTEIN TYPE, 2022 VS 2029
- Figure 70:
- EUROPE ANIMAL PROTEIN MARKET, VOLUME IN METRIC TONNES, CONFECTIONERY, 2017 - 2029
- Figure 71:
- EUROPE ANIMAL PROTEIN MARKET, VALUE IN USD, CONFECTIONERY, 2017 - 2029
- Figure 72:
- EUROPE ANIMAL PROTEIN MARKET, CONFECTIONERY, VALUE SHARE (%), BY PROTEIN TYPE, 2022 VS 2029
- Figure 73:
- EUROPE ANIMAL PROTEIN MARKET, VOLUME IN METRIC TONNES, DAIRY AND DAIRY ALTERNATIVE PRODUCTS, 2017 - 2029
- Figure 74:
- EUROPE ANIMAL PROTEIN MARKET, VALUE IN USD, DAIRY AND DAIRY ALTERNATIVE PRODUCTS, 2017 - 2029
- Figure 75:
- EUROPE ANIMAL PROTEIN MARKET, DAIRY AND DAIRY ALTERNATIVE PRODUCTS, VALUE SHARE (%), BY PROTEIN TYPE, 2022 VS 2029
- Figure 76:
- EUROPE ANIMAL PROTEIN MARKET, VOLUME IN METRIC TONNES, RTE/RTC FOOD PRODUCTS, 2017 - 2029
- Figure 77:
- EUROPE ANIMAL PROTEIN MARKET, VALUE IN USD, RTE/RTC FOOD PRODUCTS, 2017 - 2029
- Figure 78:
- EUROPE ANIMAL PROTEIN MARKET, RTE/RTC FOOD PRODUCTS, VALUE SHARE (%), BY PROTEIN TYPE, 2022 VS 2029
- Figure 79:
- EUROPE ANIMAL PROTEIN MARKET, VOLUME IN METRIC TONNES, SNACKS, 2017 - 2029
- Figure 80:
- EUROPE ANIMAL PROTEIN MARKET, VALUE IN USD, SNACKS, 2017 - 2029
- Figure 81:
- EUROPE ANIMAL PROTEIN MARKET, SNACKS, VALUE SHARE (%), BY PROTEIN TYPE, 2022 VS 2029
- Figure 82:
- EUROPE ANIMAL PROTEIN MARKET, VOLUME IN METRIC TONNES, PERSONAL CARE AND COSMETICS, 2017 - 2029
- Figure 83:
- EUROPE ANIMAL PROTEIN MARKET, VALUE IN USD, PERSONAL CARE AND COSMETICS, 2017 - 2029
- Figure 84:
- EUROPE ANIMAL PROTEIN MARKET, PERSONAL CARE AND COSMETICS, VALUE SHARE (%), BY PROTEIN TYPE, 2022 VS 2029
- Figure 85:
- EUROPE ANIMAL PROTEIN MARKET, VOLUME IN METRIC TONNES, BY SUB END USER, 2017 - 2029
- Figure 86:
- EUROPE ANIMAL PROTEIN MARKET, VALUE IN USD, BY SUB END USER, 2017 - 2029
- Figure 87:
- EUROPE ANIMAL PROTEIN MARKET, VALUE SHARE (%), BY SUB END USER, 2017 VS 2023 VS 2029
- Figure 88:
- EUROPE ANIMAL PROTEIN MARKET, VOLUME SHARE (%), BY SUB END USER, 2017 VS 2023 VS 2029
- Figure 89:
- EUROPE ANIMAL PROTEIN MARKET, VOLUME IN METRIC TONNES, BABY FOOD AND INFANT FORMULA, 2017 - 2029
- Figure 90:
- EUROPE ANIMAL PROTEIN MARKET, VALUE IN USD, BABY FOOD AND INFANT FORMULA, 2017 - 2029
- Figure 91:
- EUROPE ANIMAL PROTEIN MARKET, BABY FOOD AND INFANT FORMULA, VALUE SHARE (%), BY PROTEIN TYPE, 2022 VS 2029
- Figure 92:
- EUROPE ANIMAL PROTEIN MARKET, VOLUME IN METRIC TONNES, ELDERLY NUTRITION AND MEDICAL NUTRITION, 2017 - 2029
- Figure 93:
- EUROPE ANIMAL PROTEIN MARKET, VALUE IN USD, ELDERLY NUTRITION AND MEDICAL NUTRITION, 2017 - 2029
- Figure 94:
- EUROPE ANIMAL PROTEIN MARKET, ELDERLY NUTRITION AND MEDICAL NUTRITION, VALUE SHARE (%), BY PROTEIN TYPE, 2022 VS 2029
- Figure 95:
- EUROPE ANIMAL PROTEIN MARKET, VOLUME IN METRIC TONNES, SPORT/PERFORMANCE NUTRITION, 2017 - 2029
- Figure 96:
- EUROPE ANIMAL PROTEIN MARKET, VALUE IN USD, SPORT/PERFORMANCE NUTRITION, 2017 - 2029
- Figure 97:
- EUROPE ANIMAL PROTEIN MARKET, SPORT/PERFORMANCE NUTRITION, VALUE SHARE (%), BY PROTEIN TYPE, 2022 VS 2029
- Figure 98:
- EUROPE ANIMAL PROTEIN MARKET, VOLUME IN METRIC TONNES, BY COUNTRY, 2017 - 2029
- Figure 99:
- EUROPE ANIMAL PROTEIN MARKET, VALUE IN USD, BY COUNTRY, 2017 - 2029
- Figure 100:
- EUROPE ANIMAL PROTEIN MARKET, VALUE SHARE (%), BY COUNTRY, 2017 VS 2023 VS 2029
- Figure 101:
- EUROPE ANIMAL PROTEIN MARKET, VOLUME SHARE (%), BY COUNTRY, 2017 VS 2023 VS 2029
- Figure 102:
- EUROPE ANIMAL PROTEIN MARKET, VOLUME IN METRIC TONNES, BELGIUM, 2017 - 2029
- Figure 103:
- EUROPE ANIMAL PROTEIN MARKET, VALUE IN USD, BELGIUM, 2017 - 2029
- Figure 104:
- EUROPE ANIMAL PROTEIN MARKET, VALUE SHARE (%), BELGIUM, BY PROTEIN TYPE, 2022 VS 2029
- Figure 105:
- EUROPE ANIMAL PROTEIN MARKET, VOLUME IN METRIC TONNES, FRANCE, 2017 - 2029
- Figure 106:
- EUROPE ANIMAL PROTEIN MARKET, VALUE IN USD, FRANCE, 2017 - 2029
- Figure 107:
- EUROPE ANIMAL PROTEIN MARKET, VALUE SHARE (%), FRANCE, BY PROTEIN TYPE, 2022 VS 2029
- Figure 108:
- EUROPE ANIMAL PROTEIN MARKET, VOLUME IN METRIC TONNES, GERMANY, 2017 - 2029
- Figure 109:
- EUROPE ANIMAL PROTEIN MARKET, VALUE IN USD, GERMANY, 2017 - 2029
- Figure 110:
- EUROPE ANIMAL PROTEIN MARKET, VALUE SHARE (%), GERMANY, BY PROTEIN TYPE, 2022 VS 2029
- Figure 111:
- EUROPE ANIMAL PROTEIN MARKET, VOLUME IN METRIC TONNES, ITALY, 2017 - 2029
- Figure 112:
- EUROPE ANIMAL PROTEIN MARKET, VALUE IN USD, ITALY, 2017 - 2029
- Figure 113:
- EUROPE ANIMAL PROTEIN MARKET, VALUE SHARE (%), ITALY, BY PROTEIN TYPE, 2022 VS 2029
- Figure 114:
- EUROPE ANIMAL PROTEIN MARKET, VOLUME IN METRIC TONNES, NETHERLANDS, 2017 - 2029
- Figure 115:
- EUROPE ANIMAL PROTEIN MARKET, VALUE IN USD, NETHERLANDS, 2017 - 2029
- Figure 116:
- EUROPE ANIMAL PROTEIN MARKET, VALUE SHARE (%), NETHERLANDS, BY PROTEIN TYPE, 2022 VS 2029
- Figure 117:
- EUROPE ANIMAL PROTEIN MARKET, VOLUME IN METRIC TONNES, RUSSIA, 2017 - 2029
- Figure 118:
- EUROPE ANIMAL PROTEIN MARKET, VALUE IN USD, RUSSIA, 2017 - 2029
- Figure 119:
- EUROPE ANIMAL PROTEIN MARKET, VALUE SHARE (%), RUSSIA, BY PROTEIN TYPE, 2022 VS 2029
- Figure 120:
- EUROPE ANIMAL PROTEIN MARKET, VOLUME IN METRIC TONNES, SPAIN, 2017 - 2029
- Figure 121:
- EUROPE ANIMAL PROTEIN MARKET, VALUE IN USD, SPAIN, 2017 - 2029
- Figure 122:
- EUROPE ANIMAL PROTEIN MARKET, VALUE SHARE (%), SPAIN, BY PROTEIN TYPE, 2022 VS 2029
- Figure 123:
- EUROPE ANIMAL PROTEIN MARKET, VOLUME IN METRIC TONNES, TURKEY, 2017 - 2029
- Figure 124:
- EUROPE ANIMAL PROTEIN MARKET, VALUE IN USD, TURKEY, 2017 - 2029
- Figure 125:
- EUROPE ANIMAL PROTEIN MARKET, VALUE SHARE (%), TURKEY, BY PROTEIN TYPE, 2022 VS 2029
- Figure 126:
- EUROPE ANIMAL PROTEIN MARKET, VOLUME IN METRIC TONNES, UNITED KINGDOM, 2017 - 2029
- Figure 127:
- EUROPE ANIMAL PROTEIN MARKET, VALUE IN USD, UNITED KINGDOM, 2017 - 2029
- Figure 128:
- EUROPE ANIMAL PROTEIN MARKET, VALUE SHARE (%), UNITED KINGDOM, BY PROTEIN TYPE, 2022 VS 2029
- Figure 129:
- EUROPE ANIMAL PROTEIN MARKET, VOLUME IN METRIC TONNES, REST OF EUROPE, 2017 - 2029
- Figure 130:
- EUROPE ANIMAL PROTEIN MARKET, VALUE IN USD, REST OF EUROPE, 2017 - 2029
- Figure 131:
- EUROPE ANIMAL PROTEIN MARKET, VALUE SHARE (%), REST OF EUROPE, BY PROTEIN TYPE, 2022 VS 2029
- Figure 132:
- EUROPE ANIMAL PROTEIN MARKET, MOST ACTIVE COMPANIES, BY NUMBER OF STRATEGIC MOVES, 2017 - 2022
- Figure 133:
- EUROPE ANIMAL PROTEIN MARKET, TOTAL NUMBER OF STRATEGIC MOVES, 2017 - 2022
- Figure 134:
- EUROPE ANIMAL PROTEIN MARKET SHARE(%), BY KEY PLAYERS, 2021
Europe Animal Protein Industry Segmentation
Casein and Caseinates, Collagen, Egg Protein, Gelatin, Insect Protein, Milk Protein, Whey Protein are covered as segments by Protein Type. Animal Feed, Food and Beverages, Personal Care and Cosmetics, Supplements are covered as segments by End User. Belgium, France, Germany, Italy, Netherlands, Russia, Spain, Turkey, United Kingdom are covered as segments by Country.| Protein Type | |
| Casein and Caseinates | |
| Collagen | |
| Egg Protein | |
| Gelatin | |
| Insect Protein | |
| Milk Protein | |
| Whey Protein | |
| Other Animal Protein |
| End User | ||||||||||||
| Animal Feed | ||||||||||||
| ||||||||||||
| Personal Care and Cosmetics | ||||||||||||
|
| Country | |
| Belgium | |
| France | |
| Germany | |
| Italy | |
| Netherlands | |
| Russia | |
| Spain | |
| Turkey | |
| United Kingdom | |
| Rest of Europe |
Market Definition
- End User - The Protein Ingredients Market operates on a B2B basis. Food, Beverages, Supplements, Animal Feed, and Personal Care & Cosmetic manufacturers are considered to be end-consumers in the market studied. The scope excludes manufacturers buying liquid/dry whey to be used for application as a binding agent or thickener or other non-protein applications.
- Penetration Rate - Penetration Rate is defined as the percentage of Protein-Fortified End User Market Volume in the Overall End User Market Volume.
- Average Protein Content - It is the average protein content present in per 100 g of product manufactured by all end-user companies considered under the scope of this report.
Research Methodology
Mordor Intelligence follows a four-step methodology in all our reports.
- Step-1: Identify Key Variables: The quantifiable key variables (industry and extraneous) pertaining to the specific product segment and country are selected from a group of relevant variables & factors based on desk research & literature review; along with primary expert inputs. These variables are further confirmed through regression modeling (wherever required).
- Step-2: Build a Market Model: In order to build a robust forecasting methodology, the variables and factors identified in Step-1 are tested against available historical market numbers. Through an iterative process, the variables required for market forecast are set and the model is built on the basis of these variables.
- Step-3: Validate and Finalize: In this important step, all market numbers, variables and analyst calls are validated through an extensive network of primary research experts from the market studied. The respondents are selected across levels and functions to generate a holistic picture of the market studied.
- Step-4: Research Outputs: Syndicated Reports, Custom Consulting Assignments, Databases & Subscription Platforms


