Europe Biostimulants Market Size

| Icons | Lable | Value |
|---|---|---|
|
|
Study Period | 2017 - 2029 |
|
|
Base Year For Estimation | 2022 |
|
|
CAGR | 8.00 % |
|
|
Largest Share by Form | Amino Acids |
|
|
Largest Share by Country | France |
|
|
Market Concentration | High |
Major Players |
||
|
|
||
|
*Disclaimer: Major Players sorted in no particular order |
Europe Biostimulants Market Analysis
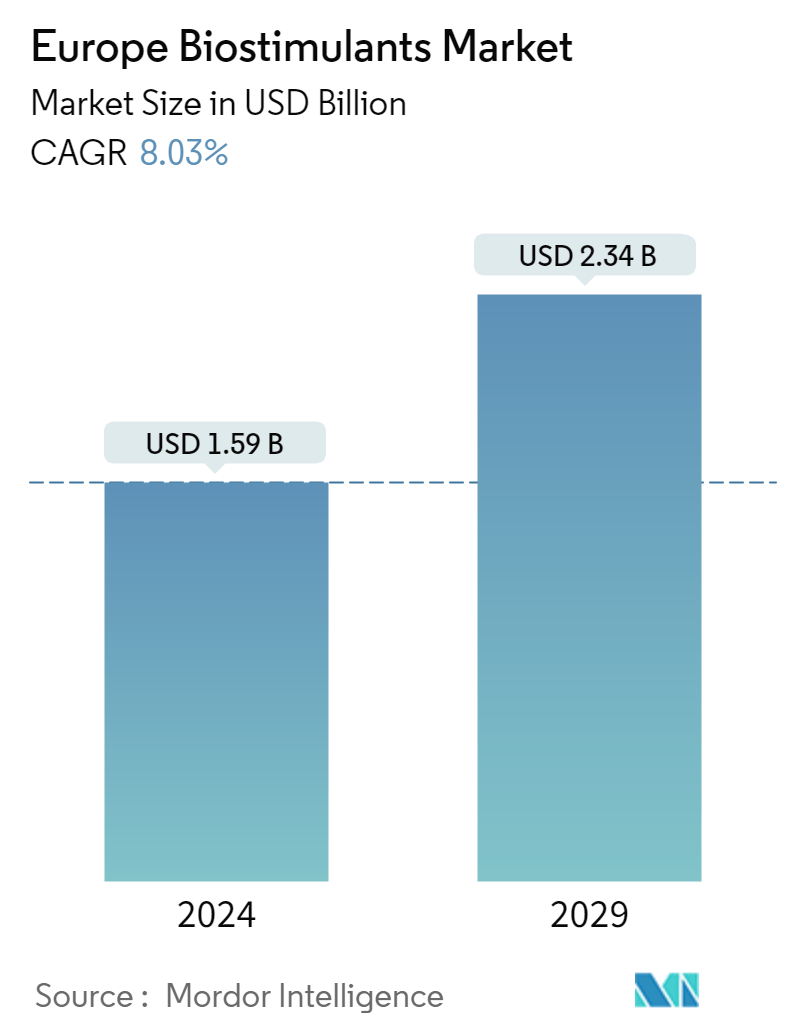
The Europe Biostimulants Market is projected to register a CAGR of 8.00%
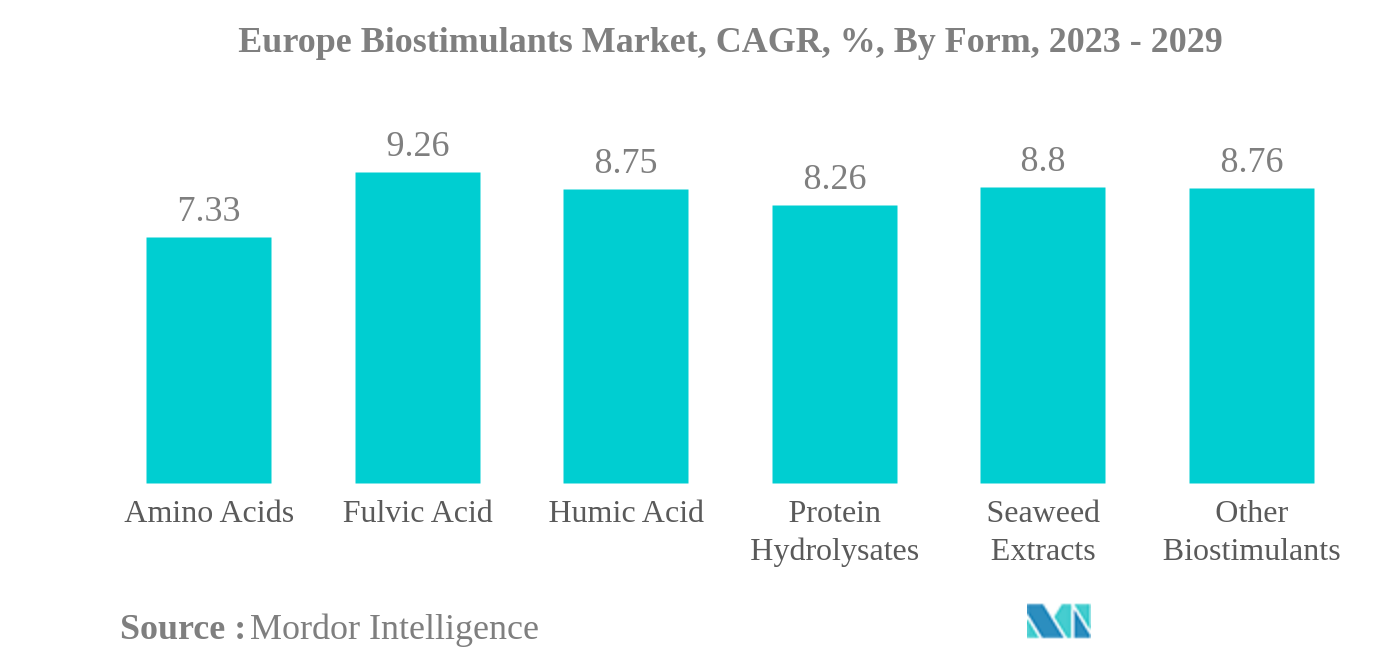
- Amino Acids is the Largest Form : Amino acids are the most consumed biostimulants in Europe. They play important role in enhancing plant productivity especially, under abiotic and biotic stress conditions.
- Fulvic Acid is the Fastest-growing Form : Fulvic acid aids in increased nutrient uptake and consequently, improved growth and yield of crops. Field crops dominated the fulvic acid market with a share of 78.7% in 2022.
- Row Crops is the Largest Crop Type : The dominance of the row crop is mainly due to its large cultivation area in the region, which accounts for about 82.3% of the total organic crop area in the region in 2022.
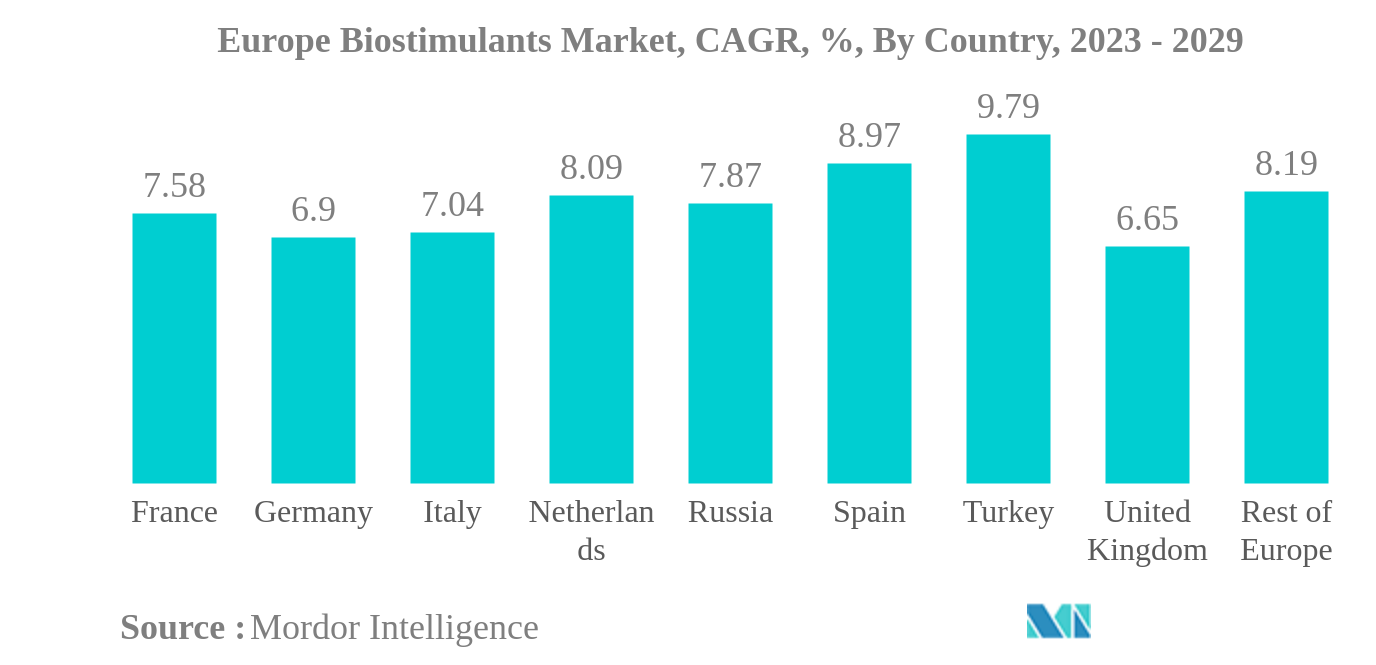
- France is the Largest Country : France is the largest market for biostimulants in the European Region. Amino acids dominated the France biostimulants market by contributing to market share of 77.6% in 2022.
Europe Biostimulants Market Trends
This section covers the major market trends shaping the Europe Biostimulants Market according to our research experts:
Amino Acids is the largest Form
- Biostimulants refer to substances and microorganisms utilized to improve plant growth and development. In Europe, the biostimulant market is projected to experience significant growth, estimated at 53.3%, within the forecast period. Humic acid, fulvic acid, amino acids, protein hydrolysates, seaweed extracts, and other biostimulants, such as plant and animal derivatives, are Europe's most commonly used biostimulants.
- Amino acids hold the largest market share in the European biostimulant market, accounting for 56.7% in 2022. This is attributed to their ability to enhance plant health and tolerance to stress and their chelating effects that protect plants from heavy metals and contribute to micronutrient mobility and acquisition.
- Foliar application of biostimulants is effective through absorption by mesophyll cells via the cuticle and epidermal cells. When supplied via soil, absorption occurs through root epidermal cells and is redistributed via the xylem.
- The biostimulant market for row crops is dominant, holding a share of 78.1% in 2022 and is expected to grow by 62.0% within the forecast period (2023-2029). This is due to the significant area under cultivation for row crops, occupying 82.3% of the total organic crop area in the region in 2022.
- The growing awareness of the benefits of biostimulants among farmers in enhancing crop resistance to biotic and abiotic stress, improving nutrient absorption, and their application in both organic and non-organic farms are expected to drive the market during the forecast period (2023-2029).
France is the largest Country
- The biostimulants market in Europe is dominated by France, which held an 18.0% market share in 2022. French farmers are adopting biostimulants as an alternative to intensive chemical inputs, aligning with public policy objectives to reduce chemical use in agriculture.
- Italy is the second-largest and the fastest growing market. It is projected to have a 7.0% CAGR during the forecast period. Italy's high adoption of organic farming, with 15.0% of agricultural land under organic farming, is contributing to the market growth. Germany is the third-largest market, with a 12.4% market share, and the formation of clear regulations by regulatory bodies may further strengthen the market.
- The formation of clear regulations by the regulatory bodies may further help in strengthening the biostimulants market in the country. In May 2020, the European Commission's Farms to Fork Strategy stated that organic is a key sector to achieve the European Green Deal's food ambitions. The strategy also stated that the market for organic food is set to continue and, therefore, organic farming needs to be further promoted. The EU has developed strict standards to encourage organic farming and advance ecological safety, contributing to the growth of the biostimulants market.
- Biostimulants are becoming more widely adopted as people become more aware of the negative effects of chemically produced pesticides and fertilizers on human health. Biostimulants are also non-toxic and do not contaminate the soil, further contributing to their growing adoption throughout Europe.
Europe Biostimulants Industry Overview
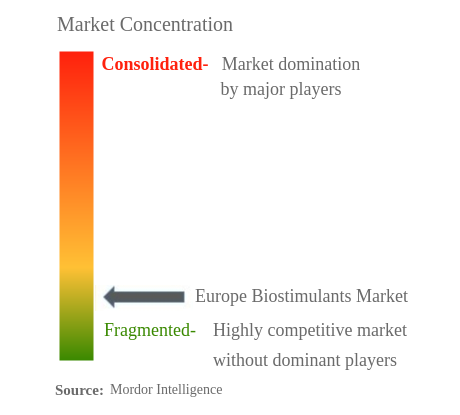
The Europe Biostimulants Market is fragmented, with the top five companies occupying 5.76%. The major players in this market are Agronutrition, BioAtlantis Ltd, Biolchim SPA, Trade Corporation International and Valagro (sorted alphabetically).
Europe Biostimulants Market Leaders
Agronutrition
BioAtlantis Ltd
Biolchim SPA
Trade Corporation International
Valagro
*Disclaimer: Major Players sorted in no particular order
Europe Biostimulants Market News
- September 2021: Tradecorp launched Biimore worldwide, a biostimulant obtained from a plant fermentation process. Biimore is made up of a unique combination of primary and secondary compounds, L-α amino acids, vitamins, sugars, and traces of other natural compounds.
- January 2021: Atlántica Agrícola developed Micomix, a biostimulant composed primarily of mycorrhizal fungi, rhizobacteria, and chelated micronutrients. The presence and development of these microorganisms in the rhizosphere create a symbiotic relationship with the plant that favors the absorption of water and mineral nutrients and increases its tolerance to water and salt stress.
- October 2018: Atlántica Agrícola introduced Razormin, a biostimulant with a great rooting effect whose well-balanced formulation induces rooting and, subsequently, the plant root and leaf mass development, thus stimulating cell division and elongation. The presence of amino acids and polysaccharides favors the absorption of nutrients (both macro and micro), which results in the better development of the plant.
Europe Biostimulants Market Report - Table of Contents
EXECUTIVE SUMMARY & KEY FINDINGS
REPORT OFFERS
1. INTRODUCTION
1.1. Study Assumptions & Market Definition
1.2. Scope of the Study
1.3. Research Methodology
2. KEY INDUSTRY TRENDS
2.1. Area Under Organic Cultivation
2.2. Per Capita Spending On Organic Products
2.3. Regulatory Framework
2.4. Value Chain & Distribution Channel Analysis
3. MARKET SEGMENTATION
3.1. Form
3.1.1. Amino Acids
3.1.2. Fulvic Acid
3.1.3. Humic Acid
3.1.4. Protein Hydrolysates
3.1.5. Seaweed Extracts
3.1.6. Other Biostimulants
3.2. Crop Type
3.2.1. Cash Crops
3.2.2. Horticultural Crops
3.2.3. Row Crops
3.3. Country
3.3.1. France
3.3.2. Germany
3.3.3. Italy
3.3.4. Netherlands
3.3.5. Russia
3.3.6. Spain
3.3.7. Turkey
3.3.8. United Kingdom
3.3.9. Rest Of Europe
4. COMPETITIVE LANDSCAPE
4.1. Key Strategic Moves
4.2. Market Share Analysis
4.3. Company Landscape
4.4. Company Profiles
4.4.1. AGLUKON Spezialduenger GmbH & Co.
4.4.2. Agronutrition
4.4.3. Atlántica Agrícola
4.4.4. BioAtlantis Ltd
4.4.5. Biolchim SPA
4.4.6. Bionema
4.4.7. Ficosterra
4.4.8. Green Has Italia S.p.A
4.4.9. Trade Corporation International
4.4.10. Valagro
5. KEY STRATEGIC QUESTIONS FOR AGRICULTURAL BIOLOGICALS CEOS
6. APPENDIX
6.1. Global Overview
6.1.1. Overview
6.1.2. Porter’s Five Forces Framework
6.1.3. Global Value Chain Analysis
6.1.4. Market Dynamics (DROs)
6.2. Sources & References
6.3. List of Tables & Figures
6.4. Primary Insights
6.5. Data Pack
6.6. Glossary of Terms
List of Tables & Figures
- Figure 1:
- EUROPE BIOSTIMULANTS MARKET, AREA UNDER ORGANIC CULTIVATION, HECTARES, 2017 - 2022
- Figure 2:
- EUROPE BIOSTIMULANTS MARKET, PER CAPITA SPENDING ON ORGANIC PRODUCTS, USD, 2017 - 2022
- Figure 3:
- EUROPE BIOSTIMULANTS MARKET, VOLUME, METRIC TON, 2017 - 2029
- Figure 4:
- EUROPE BIOSTIMULANTS MARKET, VALUE, USD, 2017 - 2029
- Figure 5:
- EUROPE BIOSTIMULANTS MARKET, BY FORM, VOLUME, METRIC TON, 2017 - 2029
- Figure 6:
- EUROPE BIOSTIMULANTS MARKET, BY FORM, VALUE, USD, 2017 - 2029
- Figure 7:
- EUROPE BIOSTIMULANTS MARKET, VOLUME SHARE(%), BY FORM, 2017 - 2029
- Figure 8:
- EUROPE BIOSTIMULANTS MARKET, VALUE SHARE(%), BY FORM, 2017 - 2029
- Figure 9:
- EUROPE BIOSTIMULANTS MARKET, BY FORM, VOLUME, METRIC TON, 2017 - 2029
- Figure 10:
- EUROPE BIOSTIMULANTS MARKET, BY FORM, VALUE, USD, 2017 - 2029
- Figure 11:
- EUROPE BIOSTIMULANTS MARKET, VALUE SHARE(%), BY CROP TYPE, 2022 - 2029
- Figure 12:
- EUROPE BIOSTIMULANTS MARKET, BY FORM, VOLUME, METRIC TON, 2017 - 2029
- Figure 13:
- EUROPE BIOSTIMULANTS MARKET, BY FORM, VALUE, USD, 2017 - 2029
- Figure 14:
- EUROPE BIOSTIMULANTS MARKET, VALUE SHARE(%), BY CROP TYPE, 2022 - 2029
- Figure 15:
- EUROPE BIOSTIMULANTS MARKET, BY FORM, VOLUME, METRIC TON, 2017 - 2029
- Figure 16:
- EUROPE BIOSTIMULANTS MARKET, BY FORM, VALUE, USD, 2017 - 2029
- Figure 17:
- EUROPE BIOSTIMULANTS MARKET, VALUE SHARE(%), BY CROP TYPE, 2022 - 2029
- Figure 18:
- EUROPE BIOSTIMULANTS MARKET, BY FORM, VOLUME, METRIC TON, 2017 - 2029
- Figure 19:
- EUROPE BIOSTIMULANTS MARKET, BY FORM, VALUE, USD, 2017 - 2029
- Figure 20:
- EUROPE BIOSTIMULANTS MARKET, VALUE SHARE(%), BY CROP TYPE, 2022 - 2029
- Figure 21:
- EUROPE BIOSTIMULANTS MARKET, BY FORM, VOLUME, METRIC TON, 2017 - 2029
- Figure 22:
- EUROPE BIOSTIMULANTS MARKET, BY FORM, VALUE, USD, 2017 - 2029
- Figure 23:
- EUROPE BIOSTIMULANTS MARKET, VALUE SHARE(%), BY CROP TYPE, 2022 - 2029
- Figure 24:
- EUROPE BIOSTIMULANTS MARKET, BY FORM, VOLUME, METRIC TON, 2017 - 2029
- Figure 25:
- EUROPE BIOSTIMULANTS MARKET, BY FORM, VALUE, USD, 2017 - 2029
- Figure 26:
- EUROPE BIOSTIMULANTS MARKET, VALUE SHARE(%), BY CROP TYPE, 2022 - 2029
- Figure 27:
- EUROPE BIOSTIMULANTS MARKET, BY CROP TYPE, VOLUME, METRIC TON, 2017 - 2029
- Figure 28:
- EUROPE BIOSTIMULANTS MARKET, BY CROP TYPE, VALUE, USD, 2017 - 2029
- Figure 29:
- EUROPE BIOSTIMULANTS MARKET, VOLUME SHARE(%), BY CROP TYPE, 2017 - 2029
- Figure 30:
- EUROPE BIOSTIMULANTS MARKET, VALUE SHARE(%), BY CROP TYPE, 2017 - 2029
- Figure 31:
- EUROPE BIOSTIMULANTS MARKET, BY CROP TYPE, VOLUME, METRIC TON, 2017 - 2029
- Figure 32:
- EUROPE BIOSTIMULANTS MARKET, BY CROP TYPE, VALUE, USD, 2017 - 2029
- Figure 33:
- EUROPE BIOSTIMULANTS MARKET, VALUE SHARE(%), BY FORM, 2022 - 2029
- Figure 34:
- EUROPE BIOSTIMULANTS MARKET, BY CROP TYPE, VOLUME, METRIC TON, 2017 - 2029
- Figure 35:
- EUROPE BIOSTIMULANTS MARKET, BY CROP TYPE, VALUE, USD, 2017 - 2029
- Figure 36:
- EUROPE BIOSTIMULANTS MARKET, VALUE SHARE(%), BY FORM, 2022 - 2029
- Figure 37:
- EUROPE BIOSTIMULANTS MARKET, BY CROP TYPE, VOLUME, METRIC TON, 2017 - 2029
- Figure 38:
- EUROPE BIOSTIMULANTS MARKET, BY CROP TYPE, VALUE, USD, 2017 - 2029
- Figure 39:
- EUROPE BIOSTIMULANTS MARKET, VALUE SHARE(%), BY FORM, 2022 - 2029
- Figure 40:
- EUROPE BIOSTIMULANTS MARKET, BY COUNTRY, VOLUME, METRIC TON, 2017 - 2029
- Figure 41:
- EUROPE BIOSTIMULANTS MARKET, BY COUNTRY, VALUE, USD, 2017 - 2029
- Figure 42:
- EUROPE BIOSTIMULANTS MARKET, VOLUME SHARE(%), BY COUNTRY, 2017 - 2029
- Figure 43:
- EUROPE BIOSTIMULANTS MARKET, VALUE SHARE(%), BY COUNTRY, 2017 - 2029
- Figure 44:
- EUROPE BIOSTIMULANTS MARKET, BY COUNTRY, VOLUME, METRIC TON, 2017 - 2029
- Figure 45:
- EUROPE BIOSTIMULANTS MARKET, BY COUNTRY, VALUE, USD, 2017 - 2029
- Figure 46:
- EUROPE BIOSTIMULANTS MARKET, VALUE SHARE(%), BY FORM, 2022 - 2029
- Figure 47:
- EUROPE BIOSTIMULANTS MARKET, BY COUNTRY, VOLUME, METRIC TON, 2017 - 2029
- Figure 48:
- EUROPE BIOSTIMULANTS MARKET, BY COUNTRY, VALUE, USD, 2017 - 2029
- Figure 49:
- EUROPE BIOSTIMULANTS MARKET, VALUE SHARE(%), BY FORM, 2022 - 2029
- Figure 50:
- EUROPE BIOSTIMULANTS MARKET, BY COUNTRY, VOLUME, METRIC TON, 2017 - 2029
- Figure 51:
- EUROPE BIOSTIMULANTS MARKET, BY COUNTRY, VALUE, USD, 2017 - 2029
- Figure 52:
- EUROPE BIOSTIMULANTS MARKET, VALUE SHARE(%), BY FORM, 2022 - 2029
- Figure 53:
- EUROPE BIOSTIMULANTS MARKET, BY COUNTRY, VOLUME, METRIC TON, 2017 - 2029
- Figure 54:
- EUROPE BIOSTIMULANTS MARKET, BY COUNTRY, VALUE, USD, 2017 - 2029
- Figure 55:
- EUROPE BIOSTIMULANTS MARKET, VALUE SHARE(%), BY FORM, 2022 - 2029
- Figure 56:
- EUROPE BIOSTIMULANTS MARKET, BY COUNTRY, VOLUME, METRIC TON, 2017 - 2029
- Figure 57:
- EUROPE BIOSTIMULANTS MARKET, BY COUNTRY, VALUE, USD, 2017 - 2029
- Figure 58:
- EUROPE BIOSTIMULANTS MARKET, VALUE SHARE(%), BY FORM, 2022 - 2029
- Figure 59:
- EUROPE BIOSTIMULANTS MARKET, BY COUNTRY, VOLUME, METRIC TON, 2017 - 2029
- Figure 60:
- EUROPE BIOSTIMULANTS MARKET, BY COUNTRY, VALUE, USD, 2017 - 2029
- Figure 61:
- EUROPE BIOSTIMULANTS MARKET, VALUE SHARE(%), BY FORM, 2022 - 2029
- Figure 62:
- EUROPE BIOSTIMULANTS MARKET, BY COUNTRY, VOLUME, METRIC TON, 2017 - 2029
- Figure 63:
- EUROPE BIOSTIMULANTS MARKET, BY COUNTRY, VALUE, USD, 2017 - 2029
- Figure 64:
- EUROPE BIOSTIMULANTS MARKET, VALUE SHARE(%), BY FORM, 2022 - 2029
- Figure 65:
- EUROPE BIOSTIMULANTS MARKET, BY COUNTRY, VOLUME, METRIC TON, 2017 - 2029
- Figure 66:
- EUROPE BIOSTIMULANTS MARKET, BY COUNTRY, VALUE, USD, 2017 - 2029
- Figure 67:
- EUROPE BIOSTIMULANTS MARKET, VALUE SHARE(%), BY FORM, 2022 - 2029
- Figure 68:
- EUROPE BIOSTIMULANTS MARKET, BY COUNTRY, VOLUME, METRIC TON, 2017 - 2029
- Figure 69:
- EUROPE BIOSTIMULANTS MARKET, BY COUNTRY, VALUE, USD, 2017 - 2029
- Figure 70:
- EUROPE BIOSTIMULANTS MARKET, VALUE SHARE(%), BY FORM, 2022 - 2029
- Figure 71:
- EUROPE BIOSTIMULANTS MARKET, MOST ACTIVE COMPANIES, BY NUMBER OF STRATEGIC MOVES, 2017-2022
- Figure 72:
- EUROPE BIOSTIMULANTS MARKET, MOST ADOPTED STRATEGIES, 2017-2022
- Figure 73:
- EUROPE BIOSTIMULANTS MARKET SHARE(%), BY MAJOR PLAYERS, 2022
Europe Biostimulants Industry Segmentation
Amino Acids, Fulvic Acid, Humic Acid, Protein Hydrolysates, Seaweed Extracts are covered as segments by Form. Cash Crops, Horticultural Crops, Row Crops are covered as segments by Crop Type. France, Germany, Italy, Netherlands, Russia, Spain, Turkey, United Kingdom are covered as segments by Country.| Form | |
| Amino Acids | |
| Fulvic Acid | |
| Humic Acid | |
| Protein Hydrolysates | |
| Seaweed Extracts | |
| Other Biostimulants |
| Crop Type | |
| Cash Crops | |
| Horticultural Crops | |
| Row Crops |
| Country | |
| France | |
| Germany | |
| Italy | |
| Netherlands | |
| Russia | |
| Spain | |
| Turkey | |
| United Kingdom | |
| Rest Of Europe |
Market Definition
- AVERAGE DOSAGE RATE - This refers to the average volume of biostimulants applied per hectare of farmland in the respective region/country.
- CROP TYPE - Row Crops: Cereals, Pulses, Oilseeds, and Forage Crops Horticulture: Fruits, and Vegetables, Cash Crops: Plantation Crops and Spices.
- FUNCTIONS - Biostimulants
- MARKET ESTIMATION LEVEL - Market Estimations for various types of biostimulants has been done at the product-level.
Research Methodology
Mordor Intelligence follows a four-step methodology in all our reports.
- Step-1: Identify Key Variables: In order to build a robust forecasting methodology, the variables and factors identified in Step-1 are tested against available historical market numbers. Through an iterative process, the variables required for market forecast are set and the model is built on the basis of these variables.
- Step-2: Build a Market Model: Market-size estimations for the forecast years are in nominal terms. Inflation is not a part of the pricing, and the average selling price (ASP) is kept constant throughout the forecast period.
- Step-3: Validate and Finalize: In this important step, all market numbers, variables and analyst calls are validated through an extensive network of primary research experts from the market studied. The respondents are selected across levels and functions to generate a holistic picture of the market studied.
- Step-4: Research Outputs: Syndicated Reports, Custom Consulting Assignments, Databases & Subscription Platforms.


