Europe Soy Protein Market Size

| Icons | Lable | Value |
|---|---|---|
|
|
Study Period | 2017 - 2029 |
|
|
Base Year For Estimation | 2022 |
|
|
CAGR | 3.68 % |
|
|
Largest Share by End User | Animal Feed |
|
|
Largest Share by Country | Russia |
|
|
Market Concentration | High |
Major Players |
||
|
|
||
|
*Disclaimer: Major Players sorted in no particular order |
Europe Soy Protein Market Analysis
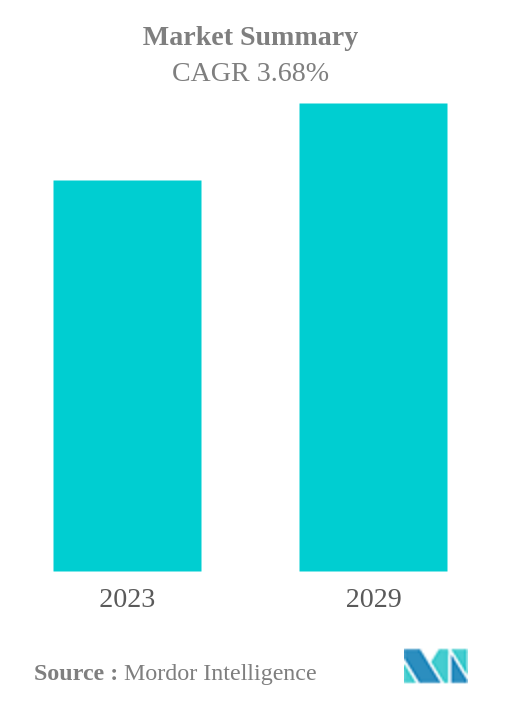
The Europe Soy Protein Market is projected to register a CAGR of 3.68%
- Concentrates is the Largest Form : Constant research and innovations, mainly in animal feed, support the application of soy protein concentrates, projected to drive the segment.
- Animal Feed is the Largest End User : Soy protein is widely used in the region’s animal feed sector due to its distinct benefits like protein digestibility, apt amino acid profile, extended shelf life, etc.
- Textured/Hydrolyzed is the Fastest-growing Form : Soy protein is widely used in the region’s animal feed sector due to its distinct benefits like protein digestibility, apt amino acid profile, extended shelf life, etc.
- Supplements is the Fastest-growing End User : The rising consumer focus on health and sports fitness is anticipated to drive the segment. Among all, soy preference in the sector propels segmental growth.
Europe Soy Protein Market Trends
This section covers the major market trends shaping the Europe Soy Protein Market according to our research experts:
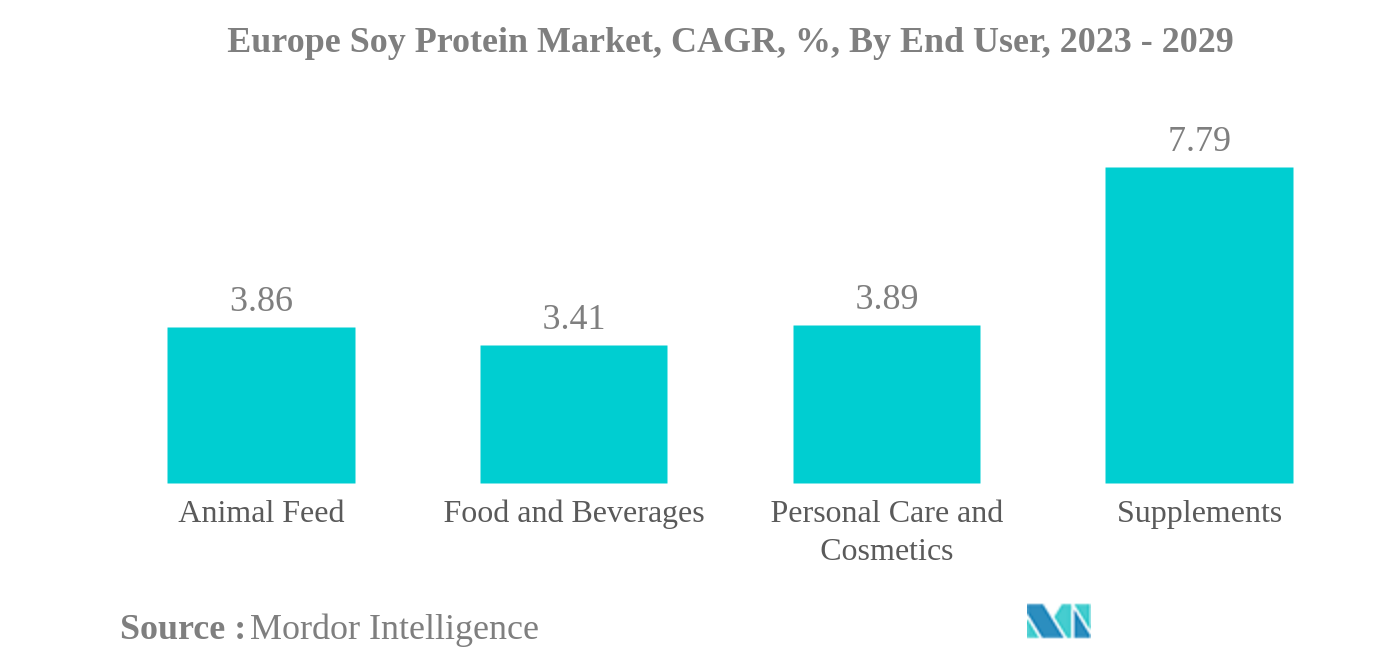
Animal Feed is the largest End User
- Soy protein is projected to register a CAGR of 2.65% by value during the forecast period in the animal feed industry. The EU imports 18.5 million tonnes of soybean meal every year, of which 95% goes toward feeding animals. The soy protein demand in animal feed witnessed a major push due to government initiatives and manufacturers' increased competitiveness. For instance, the Protein Plan announced by the European Federation of the Compound Feed Industry (FEFAC) boosted the demand for plant proteins significantly in the animal feed industry, including soy protein.
- The F&B industry is another key end-user segment, primarily driven by the surging demand in the RTE/RTC foods sub-segment. Thus, the segment is projected to witness the fastest CAGR of 8.99% by value. In Europe, the flexitarian population has doubled from 1.3 million to around 2.6 million, representing 3.2% of the population in 2020. Vegetarians, pescatarians, and flexitarians, the group in total, represented about 30.9% of the population in 2020. Soy protein also serves as an alternative to animal-derived meals and provides numerous functionalities like high digestibility, a great amino acid profile, a low level of anti-nutritional factors, and long shelf life.
- Soy protein holds a significant share of the supplements market. It is projected to register a growth of 6.19% by value during the forecast period. Soy protein has the properties of lowering cholesterol levels and its high nutritional fiber content. In 2021, there were about 2.5 million Europeans affected with hypercholesterolemia. The market for soy protein witnessed an increase in demand due to the rising nutritional values and health benefits in the supplements market.
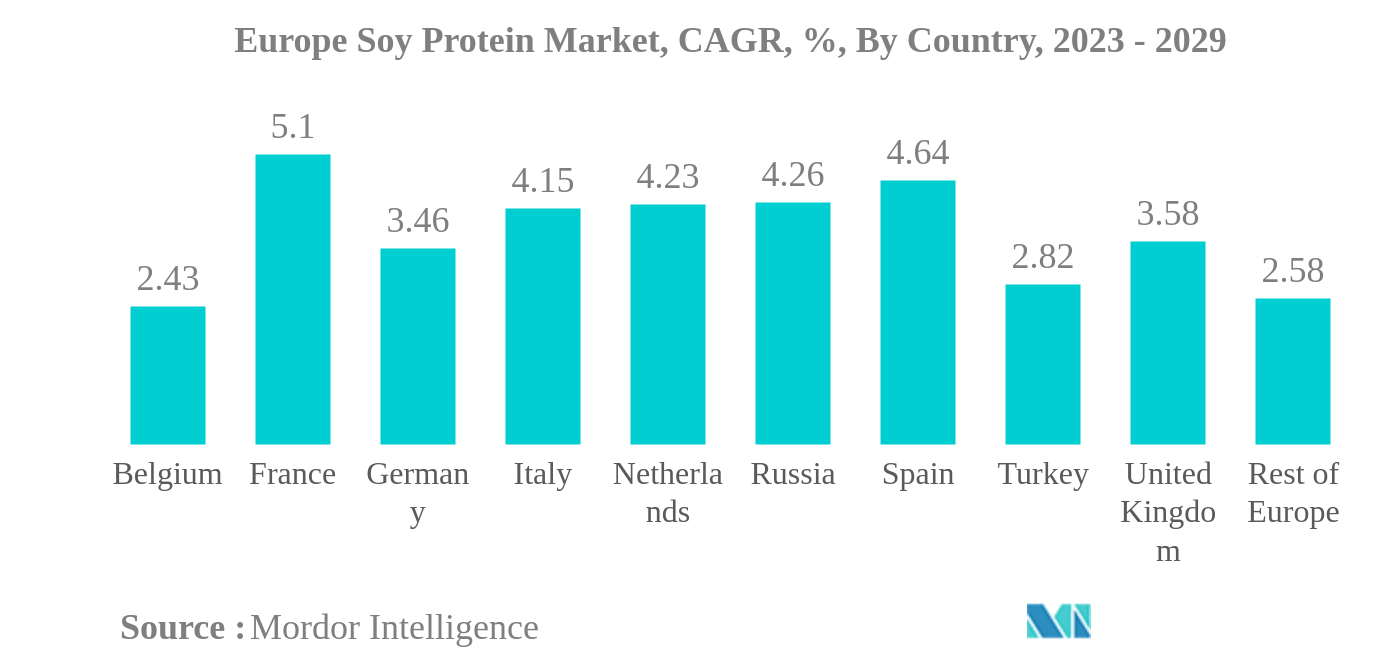
Russia is the largest Country
- The market witnessed a three-fold Y-o-Y growth rate of 8%, by value, in 2020. Owing to the COVID-19 impact, due to the increased prices of raw materials in the country. In 2020, despite measures taken by the Russian government through the introduction of export customs duty on soybeans, the selling prices of soybeans increased in the Central Federal District, which led to increased soy protein prices. Therefore, the price of SPI inclined by 0.21% in 2020, compared to the 0.16% average growth rate of price over the previous four years.
- France is projected to be the fastest-growing country in terms of value, with a CAGR of 5.14% during the forecast period. The country has planned to raise the sowing area for protein-rich crops, especially soy, by 40% from 2022 and double it over the next ten years, reducing soy protein prices and further boosting its sales. Moreover, AFNOR (Association Française de Normalization) has introduced the standard that soy juices sold domestically are made from a minimum of 3.2 g of soy protein per 100 ml and have no trace of dairy products, creating opportunities for manufacturers.
- In 2022, Russia remained the largest soy protein consumer in the region, which is further projected to register a CAGR of 4.29% during the forecast period. The demand was majorly driven by the country's large consumer base and high demand from the F&B segment, accounting for a 44.35% volume share in 2020. The demand for soy products is expected to increase exponentially in the future, as most consumers perceive soybeans as a cheap and healthy substitute for animal protein.
Europe Soy Protein Industry Overview
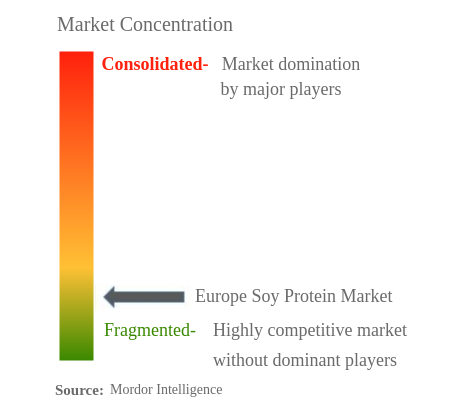
The Europe Soy Protein Market is fragmented, with the top five companies occupying 26.34%. The major players in this market are Archer Daniels Midland Company, CHS Inc., International Flavors & Fragrances Inc., Kerry Group PLC and The Scoular Company (sorted alphabetically).
Europe Soy Protein Market Leaders
Archer Daniels Midland Company
CHS Inc.
International Flavors & Fragrances Inc.
Kerry Group PLC
The Scoular Company
*Disclaimer: Major Players sorted in no particular order
Europe Soy Protein Market News
- March 2021: Fuji Oil Group appointed Mikio Sakai as the new president and CEO. Mikio Sakai is engaged in developing Plant-based Food Solutions as a core concept to grow a third business pillar, along with the Oil and Fat and Chocolate businesses. Plant-based Food Solutions include soy meat and soybeans, which are used as raw materials for plant-based protein.
- February 2021: DuPont merged its Nutrition Business with International Flavors & Fragrances (IFF), establishing a company that may become a leading ingredients supplier to the food industry in the United States. The company generated a revenue of USD 11 billion, and it may supply soy proteins and other ingredients for consumer products.
- October 2020: Archer Daniels Midland Company expanded the production of non-GMO soy protein concentrates at its facility in the Netherlands. The concentrates are available in powder forms and can be used in all types of food applications.
Europe Soy Protein Market Report - Table of Contents
EXECUTIVE SUMMARY & KEY FINDINGS
1. INTRODUCTION
1.1. Study Assumptions & Market Definition
1.2. Scope of the Study
1.3. Research Methodology
2. KEY INDUSTRY TRENDS
2.1. End User Market Volume
2.2. Protein Consumption Trends
2.3. Production Trends
2.4. Regulatory Framework
2.5. Value Chain & Distribution Channel Analysis
3. MARKET SEGMENTATION
3.1. Form
3.1.1. Concentrates
3.1.2. Isolates
3.1.3. Textured/Hydrolyzed
3.2. End User
3.2.1. Animal Feed
3.2.2. Food And Beverages
3.2.2.1. By Sub End User
3.2.2.1.1. Bakery
3.2.2.1.2. Beverages
3.2.2.1.3. Breakfast Cereals
3.2.2.1.4. Condiments/Sauces
3.2.2.1.5. Dairy And Dairy Alternative Products
3.2.2.1.6. Meat/Poultry/Seafood And Meat Alternative Products
3.2.2.1.7. RTE/RTC Food Products
3.2.2.1.8. Snacks
3.2.3. Personal Care And Cosmetics
3.2.4. Supplements
3.2.4.1. By Sub End User
3.2.4.1.1. Baby Food And Infant Formula
3.2.4.1.2. Elderly Nutrition And Medical Nutrition
3.2.4.1.3. Sport/Performance Nutrition
3.3. Country
3.3.1. Belgium
3.3.2. France
3.3.3. Germany
3.3.4. Italy
3.3.5. Netherlands
3.3.6. Russia
3.3.7. Spain
3.3.8. Turkey
3.3.9. United Kingdom
3.3.10. Rest Of Europe
4. COMPETITIVE LANDSCAPE
4.1. Key Strategic Moves
4.2. Market Share Analysis
4.3. Company Landscape
4.4. Company Profiles
4.4.1. A. Costantino & C. SpA
4.4.2. Archer Daniels Midland Company
4.4.3. CHS Inc.
4.4.4. Fuji Oil Group
4.4.5. International Flavors & Fragrances Inc.
4.4.6. Kerry Group PLC
4.4.7. The Scoular Company
4.4.8. Wilmar International Ltd
5. KEY STRATEGIC QUESTIONS FOR PROTEIN INGREDIENTS INDUSTRY CEOS
6. APPENDIX
6.1. Global Overview
6.1.1. Overview
6.1.2. Porter’s Five Forces Framework
6.1.3. Global Value Chain Analysis
6.1.4. Market Dynamics (DROs)
6.2. Sources & References
6.3. List of Tables & Figures
6.4. Primary Insights
6.5. Data Pack
6.6. Glossary of Terms
List of Tables & Figures
- Figure 1:
- EUROPE BABY FOOD AND INFANT FORMULA MARKET, VOLUME IN METRIC TONNES, 2017 - 2029
- Figure 2:
- EUROPE BAKERY MARKET, VOLUME IN METRIC TONNES, 2017 - 2029
- Figure 3:
- EUROPE BEVERAGES MARKET, VOLUME IN METRIC TONNES, 2017 - 2029
- Figure 4:
- EUROPE BREAKFAST CEREALS MARKET, VOLUME IN METRIC TONNES, 2017 - 2029
- Figure 5:
- EUROPE CONDIMENTS/SAUCES MARKET, VOLUME IN METRIC TONNES, 2017 - 2029
- Figure 6:
- EUROPE CONFECTIONERY MARKET, VOLUME IN METRIC TONNES, 2017 - 2029
- Figure 7:
- EUROPE DAIRY AND DAIRY ALTERNATIVE PRODUCTS MARKET, VOLUME IN METRIC TONNES, 2017 - 2029
- Figure 8:
- EUROPE ELDERLY NUTRITION AND MEDICAL NUTRITION MARKET, VOLUME IN METRIC TONNES, 2017 - 2029
- Figure 9:
- EUROPE MEAT/POULTRY/SEAFOOD AND MEAT ALTERNATIVE PRODUCTS MARKET, VOLUME IN METRIC TONNES, 2017 - 2029
- Figure 10:
- EUROPE RTE/RTC FOOD PRODUCTS MARKET, VOLUME IN METRIC TONNES, 2017 - 2029
- Figure 11:
- EUROPE SNACKS MARKET, VOLUME IN METRIC TONNES, 2017 - 2029
- Figure 12:
- EUROPE SPORT/PERFORMANCE NUTRITION MARKET, VOLUME IN METRIC TONNES, 2017 - 2029
- Figure 13:
- EUROPE ANIMAL FEED MARKET, VOLUME IN METRIC TONNES, 2017 - 2029
- Figure 14:
- EUROPE PERSONAL CARE AND COSMETICS MARKET, VOLUME IN METRIC TONNES, 2017 - 2029
- Figure 15:
- EUROPE PER CAPITA CONSUMPTION OF PLANT PROTEIN, IN GRAM, 2017 - 2029
- Figure 16:
- EUROPE SOY PRODUCTION, IN METRIC TONNES, 2017 - 2021
- Figure 17:
- EUROPE SOY PROTEIN MARKET, 2015-2026
- Figure 18:
- EUROPE SOY PROTEIN MARKET, 2015-2026
- Figure 19:
- EUROPE SOY PROTEIN MARKET, VOLUME IN METRIC TONNES, BY FORM, 2017 - 2029
- Figure 20:
- EUROPE SOY PROTEIN MARKET, VALUE IN USD, BY FORM, 2017 - 2029
- Figure 21:
- EUROPE SOY PROTEIN MARKET, VALUE SHARE (%), BY FORM, 2017 VS 2023 VS 2029
- Figure 22:
- EUROPE SOY PROTEIN MARKET, VOLUME SHARE (%), BY FORM, 2017 VS 2023 VS 2029
- Figure 23:
- EUROPE SOY PROTEIN MARKET, VOLUME IN METRIC TONNES, CONCENTRATES, 2017 - 2029
- Figure 24:
- EUROPE SOY PROTEIN MARKET, VALUE IN USD, CONCENTRATES, 2017 - 2029
- Figure 25:
- EUROPE SOY PROTEIN MARKET, CONCENTRATES, VALUE SHARE (%), BY END USER, 2022 VS 2029
- Figure 26:
- EUROPE SOY PROTEIN MARKET, VOLUME IN METRIC TONNES, ISOLATES, 2017 - 2029
- Figure 27:
- EUROPE SOY PROTEIN MARKET, VALUE IN USD, ISOLATES, 2017 - 2029
- Figure 28:
- EUROPE SOY PROTEIN MARKET, ISOLATES, VALUE SHARE (%), BY END USER, 2022 VS 2029
- Figure 29:
- EUROPE SOY PROTEIN MARKET, VOLUME IN METRIC TONNES, TEXTURED/HYDROLYZED, 2017 - 2029
- Figure 30:
- EUROPE SOY PROTEIN MARKET, VALUE IN USD, TEXTURED/HYDROLYZED, 2017 - 2029
- Figure 31:
- EUROPE SOY PROTEIN MARKET, TEXTURED/HYDROLYZED, VALUE SHARE (%), BY END USER, 2022 VS 2029
- Figure 32:
- EUROPE SOY PROTEIN MARKET, VOLUME IN METRIC TONNES, BY END USER, 2017 - 2029
- Figure 33:
- EUROPE SOY PROTEIN MARKET, VALUE IN USD, BY END USER, 2017 - 2029
- Figure 34:
- EUROPE SOY PROTEIN MARKET, VALUE SHARE (%), BY END USER, 2017 VS 2023 VS 2029
- Figure 35:
- EUROPE SOY PROTEIN MARKET, VOLUME SHARE (%), BY END USER, 2017 VS 2023 VS 2029
- Figure 36:
- EUROPE SOY PROTEIN MARKET, VOLUME IN METRIC TONNES, ANIMAL FEED, 2017 - 2029
- Figure 37:
- EUROPE SOY PROTEIN MARKET, VALUE IN USD, ANIMAL FEED, 2017 - 2029
- Figure 38:
- EUROPE SOY PROTEIN MARKET, ANIMAL FEED, VALUE SHARE (%), BY FORM, 2022 VS 2029
- Figure 39:
- EUROPE SOY PROTEIN MARKET, VOLUME IN METRIC TONNES, BY SUB END USER, 2017 - 2029
- Figure 40:
- EUROPE SOY PROTEIN MARKET, VALUE IN USD, BY SUB END USER, 2017 - 2029
- Figure 41:
- EUROPE SOY PROTEIN MARKET, VALUE SHARE (%), BY SUB END USER, 2017 VS 2023 VS 2029
- Figure 42:
- EUROPE SOY PROTEIN MARKET, VOLUME SHARE (%), BY SUB END USER, 2017 VS 2023 VS 2029
- Figure 43:
- EUROPE SOY PROTEIN MARKET, VOLUME IN METRIC TONNES, BAKERY, 2017 - 2029
- Figure 44:
- EUROPE SOY PROTEIN MARKET, VALUE IN USD, BAKERY, 2017 - 2029
- Figure 45:
- EUROPE SOY PROTEIN MARKET, BAKERY, VALUE SHARE (%), BY FORM, 2022 VS 2029
- Figure 46:
- EUROPE SOY PROTEIN MARKET, VOLUME IN METRIC TONNES, BEVERAGES, 2017 - 2029
- Figure 47:
- EUROPE SOY PROTEIN MARKET, VALUE IN USD, BEVERAGES, 2017 - 2029
- Figure 48:
- EUROPE SOY PROTEIN MARKET, BEVERAGES, VALUE SHARE (%), BY FORM, 2022 VS 2029
- Figure 49:
- EUROPE SOY PROTEIN MARKET, VOLUME IN METRIC TONNES, BREAKFAST CEREALS, 2017 - 2029
- Figure 50:
- EUROPE SOY PROTEIN MARKET, VALUE IN USD, BREAKFAST CEREALS, 2017 - 2029
- Figure 51:
- EUROPE SOY PROTEIN MARKET, BREAKFAST CEREALS, VALUE SHARE (%), BY FORM, 2022 VS 2029
- Figure 52:
- EUROPE SOY PROTEIN MARKET, VOLUME IN METRIC TONNES, CONDIMENTS/SAUCES, 2017 - 2029
- Figure 53:
- EUROPE SOY PROTEIN MARKET, VALUE IN USD, CONDIMENTS/SAUCES, 2017 - 2029
- Figure 54:
- EUROPE SOY PROTEIN MARKET, CONDIMENTS/SAUCES, VALUE SHARE (%), BY FORM, 2022 VS 2029
- Figure 55:
- EUROPE SOY PROTEIN MARKET, VOLUME IN METRIC TONNES, DAIRY AND DAIRY ALTERNATIVE PRODUCTS, 2017 - 2029
- Figure 56:
- EUROPE SOY PROTEIN MARKET, VALUE IN USD, DAIRY AND DAIRY ALTERNATIVE PRODUCTS, 2017 - 2029
- Figure 57:
- EUROPE SOY PROTEIN MARKET, DAIRY AND DAIRY ALTERNATIVE PRODUCTS, VALUE SHARE (%), BY FORM, 2022 VS 2029
- Figure 58:
- EUROPE SOY PROTEIN MARKET, VOLUME IN METRIC TONNES, MEAT/POULTRY/SEAFOOD AND MEAT ALTERNATIVE PRODUCTS, 2017 - 2029
- Figure 59:
- EUROPE SOY PROTEIN MARKET, VALUE IN USD, MEAT/POULTRY/SEAFOOD AND MEAT ALTERNATIVE PRODUCTS, 2017 - 2029
- Figure 60:
- EUROPE SOY PROTEIN MARKET, MEAT/POULTRY/SEAFOOD AND MEAT ALTERNATIVE PRODUCTS, VALUE SHARE (%), BY FORM, 2022 VS 2029
- Figure 61:
- EUROPE SOY PROTEIN MARKET, VOLUME IN METRIC TONNES, RTE/RTC FOOD PRODUCTS, 2017 - 2029
- Figure 62:
- EUROPE SOY PROTEIN MARKET, VALUE IN USD, RTE/RTC FOOD PRODUCTS, 2017 - 2029
- Figure 63:
- EUROPE SOY PROTEIN MARKET, RTE/RTC FOOD PRODUCTS, VALUE SHARE (%), BY FORM, 2022 VS 2029
- Figure 64:
- EUROPE SOY PROTEIN MARKET, VOLUME IN METRIC TONNES, SNACKS, 2017 - 2029
- Figure 65:
- EUROPE SOY PROTEIN MARKET, VALUE IN USD, SNACKS, 2017 - 2029
- Figure 66:
- EUROPE SOY PROTEIN MARKET, SNACKS, VALUE SHARE (%), BY FORM, 2022 VS 2029
- Figure 67:
- EUROPE SOY PROTEIN MARKET, VOLUME IN METRIC TONNES, PERSONAL CARE AND COSMETICS, 2017 - 2029
- Figure 68:
- EUROPE SOY PROTEIN MARKET, VALUE IN USD, PERSONAL CARE AND COSMETICS, 2017 - 2029
- Figure 69:
- EUROPE SOY PROTEIN MARKET, PERSONAL CARE AND COSMETICS, VALUE SHARE (%), BY FORM, 2022 VS 2029
- Figure 70:
- EUROPE SOY PROTEIN MARKET, VOLUME IN METRIC TONNES, BY SUB END USER, 2017 - 2029
- Figure 71:
- EUROPE SOY PROTEIN MARKET, VALUE IN USD, BY SUB END USER, 2017 - 2029
- Figure 72:
- EUROPE SOY PROTEIN MARKET, VALUE SHARE (%), BY SUB END USER, 2017 VS 2023 VS 2029
- Figure 73:
- EUROPE SOY PROTEIN MARKET, VOLUME SHARE (%), BY SUB END USER, 2017 VS 2023 VS 2029
- Figure 74:
- EUROPE SOY PROTEIN MARKET, VOLUME IN METRIC TONNES, BABY FOOD AND INFANT FORMULA, 2017 - 2029
- Figure 75:
- EUROPE SOY PROTEIN MARKET, VALUE IN USD, BABY FOOD AND INFANT FORMULA, 2017 - 2029
- Figure 76:
- EUROPE SOY PROTEIN MARKET, BABY FOOD AND INFANT FORMULA, VALUE SHARE (%), BY FORM, 2022 VS 2029
- Figure 77:
- EUROPE SOY PROTEIN MARKET, VOLUME IN METRIC TONNES, ELDERLY NUTRITION AND MEDICAL NUTRITION, 2017 - 2029
- Figure 78:
- EUROPE SOY PROTEIN MARKET, VALUE IN USD, ELDERLY NUTRITION AND MEDICAL NUTRITION, 2017 - 2029
- Figure 79:
- EUROPE SOY PROTEIN MARKET, ELDERLY NUTRITION AND MEDICAL NUTRITION, VALUE SHARE (%), BY FORM, 2022 VS 2029
- Figure 80:
- EUROPE SOY PROTEIN MARKET, VOLUME IN METRIC TONNES, SPORT/PERFORMANCE NUTRITION, 2017 - 2029
- Figure 81:
- EUROPE SOY PROTEIN MARKET, VALUE IN USD, SPORT/PERFORMANCE NUTRITION, 2017 - 2029
- Figure 82:
- EUROPE SOY PROTEIN MARKET, SPORT/PERFORMANCE NUTRITION, VALUE SHARE (%), BY FORM, 2022 VS 2029
- Figure 83:
- EUROPE SOY PROTEIN MARKET, VOLUME IN METRIC TONNES, BY COUNTRY, 2017 - 2029
- Figure 84:
- EUROPE SOY PROTEIN MARKET, VALUE IN USD, BY COUNTRY, 2017 - 2029
- Figure 85:
- EUROPE SOY PROTEIN MARKET, VALUE SHARE (%), BY COUNTRY, 2017 VS 2023 VS 2029
- Figure 86:
- EUROPE SOY PROTEIN MARKET, VOLUME SHARE (%), BY COUNTRY, 2017 VS 2023 VS 2029
- Figure 87:
- EUROPE SOY PROTEIN MARKET, VOLUME IN METRIC TONNES, BELGIUM, 2017 - 2029
- Figure 88:
- EUROPE SOY PROTEIN MARKET, VALUE IN USD, BELGIUM, 2017 - 2029
- Figure 89:
- EUROPE SOY PROTEIN MARKET, VALUE SHARE (%), BELGIUM, BY END USER, 2022 VS 2029
- Figure 90:
- EUROPE SOY PROTEIN MARKET, VOLUME IN METRIC TONNES, FRANCE, 2017 - 2029
- Figure 91:
- EUROPE SOY PROTEIN MARKET, VALUE IN USD, FRANCE, 2017 - 2029
- Figure 92:
- EUROPE SOY PROTEIN MARKET, VALUE SHARE (%), FRANCE, BY END USER, 2022 VS 2029
- Figure 93:
- EUROPE SOY PROTEIN MARKET, VOLUME IN METRIC TONNES, GERMANY, 2017 - 2029
- Figure 94:
- EUROPE SOY PROTEIN MARKET, VALUE IN USD, GERMANY, 2017 - 2029
- Figure 95:
- EUROPE SOY PROTEIN MARKET, VALUE SHARE (%), GERMANY, BY END USER, 2022 VS 2029
- Figure 96:
- EUROPE SOY PROTEIN MARKET, VOLUME IN METRIC TONNES, ITALY, 2017 - 2029
- Figure 97:
- EUROPE SOY PROTEIN MARKET, VALUE IN USD, ITALY, 2017 - 2029
- Figure 98:
- EUROPE SOY PROTEIN MARKET, VALUE SHARE (%), ITALY, BY END USER, 2022 VS 2029
- Figure 99:
- EUROPE SOY PROTEIN MARKET, VOLUME IN METRIC TONNES, NETHERLANDS, 2017 - 2029
- Figure 100:
- EUROPE SOY PROTEIN MARKET, VALUE IN USD, NETHERLANDS, 2017 - 2029
- Figure 101:
- EUROPE SOY PROTEIN MARKET, VALUE SHARE (%), NETHERLANDS, BY END USER, 2022 VS 2029
- Figure 102:
- EUROPE SOY PROTEIN MARKET, VOLUME IN METRIC TONNES, RUSSIA, 2017 - 2029
- Figure 103:
- EUROPE SOY PROTEIN MARKET, VALUE IN USD, RUSSIA, 2017 - 2029
- Figure 104:
- EUROPE SOY PROTEIN MARKET, VALUE SHARE (%), RUSSIA, BY END USER, 2022 VS 2029
- Figure 105:
- EUROPE SOY PROTEIN MARKET, VOLUME IN METRIC TONNES, SPAIN, 2017 - 2029
- Figure 106:
- EUROPE SOY PROTEIN MARKET, VALUE IN USD, SPAIN, 2017 - 2029
- Figure 107:
- EUROPE SOY PROTEIN MARKET, VALUE SHARE (%), SPAIN, BY END USER, 2022 VS 2029
- Figure 108:
- EUROPE SOY PROTEIN MARKET, VOLUME IN METRIC TONNES, TURKEY, 2017 - 2029
- Figure 109:
- EUROPE SOY PROTEIN MARKET, VALUE IN USD, TURKEY, 2017 - 2029
- Figure 110:
- EUROPE SOY PROTEIN MARKET, VALUE SHARE (%), TURKEY, BY END USER, 2022 VS 2029
- Figure 111:
- EUROPE SOY PROTEIN MARKET, VOLUME IN METRIC TONNES, UNITED KINGDOM, 2017 - 2029
- Figure 112:
- EUROPE SOY PROTEIN MARKET, VALUE IN USD, UNITED KINGDOM, 2017 - 2029
- Figure 113:
- EUROPE SOY PROTEIN MARKET, VALUE SHARE (%), UNITED KINGDOM, BY END USER, 2022 VS 2029
- Figure 114:
- EUROPE SOY PROTEIN MARKET, VOLUME IN METRIC TONNES, REST OF EUROPE, 2017 - 2029
- Figure 115:
- EUROPE SOY PROTEIN MARKET, VALUE IN USD, REST OF EUROPE, 2017 - 2029
- Figure 116:
- EUROPE SOY PROTEIN MARKET, VALUE SHARE (%), REST OF EUROPE, BY END USER, 2022 VS 2029
- Figure 117:
- EUROPE SOY PROTEIN MARKET, MOST ACTIVE COMPANIES, BY NUMBER OF STRATEGIC MOVES, 2017 - 2022
- Figure 118:
- EUROPE SOY PROTEIN MARKET, TOTAL NUMBER OF STRATEGIC MOVES, 2017 - 2022
- Figure 119:
- EUROPE SOY PROTEIN MARKET SHARE(%), BY KEY PLAYERS, 2021
Europe Soy Protein Industry Segmentation
Concentrates, Isolates, Textured/Hydrolyzed are covered as segments by Form. Animal Feed, Food And Beverages, Personal Care And Cosmetics, Supplements are covered as segments by End User. Belgium, France, Germany, Italy, Netherlands, Russia, Spain, Turkey, United Kingdom are covered as segments by Country.| Form | |
| Concentrates | |
| Isolates | |
| Textured/Hydrolyzed |
| End User | ||||||||||||
| Animal Feed | ||||||||||||
| ||||||||||||
| Personal Care And Cosmetics | ||||||||||||
|
| Country | |
| Belgium | |
| France | |
| Germany | |
| Italy | |
| Netherlands | |
| Russia | |
| Spain | |
| Turkey | |
| United Kingdom | |
| Rest Of Europe |
Market Definition
- End User - The Protein Ingredients Market operates on a B2B basis. Food, Beverages, Supplements, Animal Feed, and Personal Care & Cosmetic manufacturers are considered to be end-consumers in the market studied. The scope excludes manufacturers buying liquid/dry whey to be used for application as a binding agent or thickener or other non-protein applications.
- Penetration Rate - Penetration Rate is defined as the percentage of Protein-Fortified End User Market Volume in the Overall End User Market Volume.
- Average Protein Content - It is the average protein content present in per 100 g of product manufactured by all end-user companies considered under the scope of this report.
Research Methodology
Mordor Intelligence follows a four-step methodology in all our reports.
- Step-1: Identify Key Variables: The quantifiable key variables (industry and extraneous) pertaining to the specific product segment and country are selected from a group of relevant variables & factors based on desk research & literature review; along with primary expert inputs. These variables are further confirmed through regression modeling (wherever required).
- Step-2: Build a Market Model: In order to build a robust forecasting methodology, the variables and factors identified in Step-1 are tested against available historical market numbers. Through an iterative process, the variables required for market forecast are set and the model is built on the basis of these variables.
- Step-3: Validate and Finalize: In this important step, all market numbers, variables and analyst calls are validated through an extensive network of primary research experts from the market studied. The respondents are selected across levels and functions to generate a holistic picture of the market studied.
- Step-4: Research Outputs: Syndicated Reports, Custom Consulting Assignments, Databases & Subscription Platforms


