Germany Protein Market Size

| Icons | Lable | Value |
|---|---|---|
|
|
Study Period | 2017 - 2029 |
|
|
Base Year For Estimation | 2022 |
|
|
CAGR | 4.23 % |
|
|
Largest Share by End User | Food and Beverages |
|
|
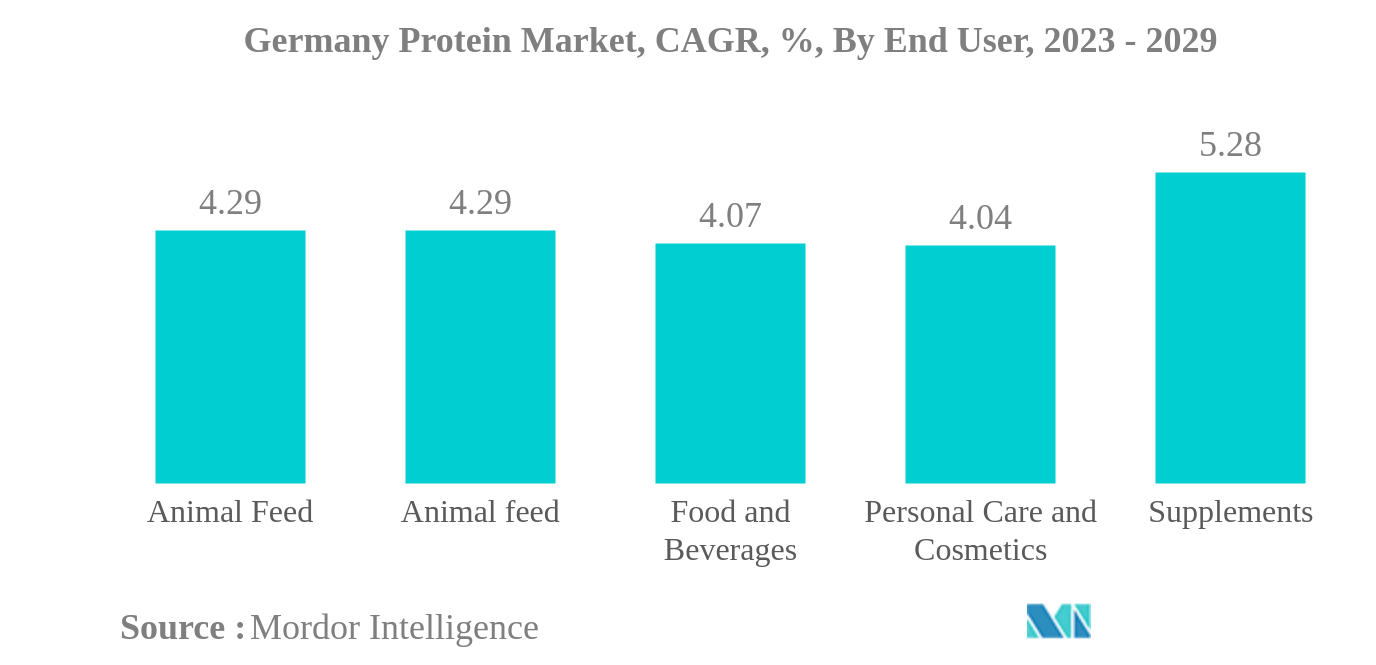
Fastest Growing by End User | Supplements |
|
|
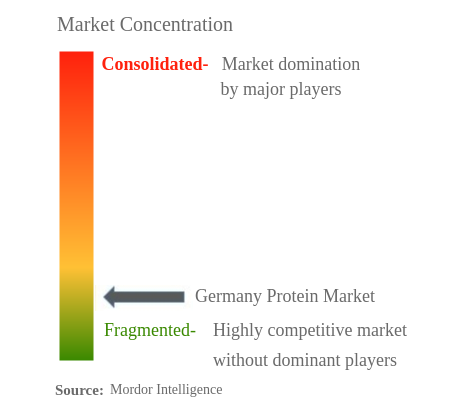
Market Concentration | High |
Major Players |
||
|
|
||
|
*Disclaimer: Major Players sorted in no particular order |
Germany Protein Market Analysis
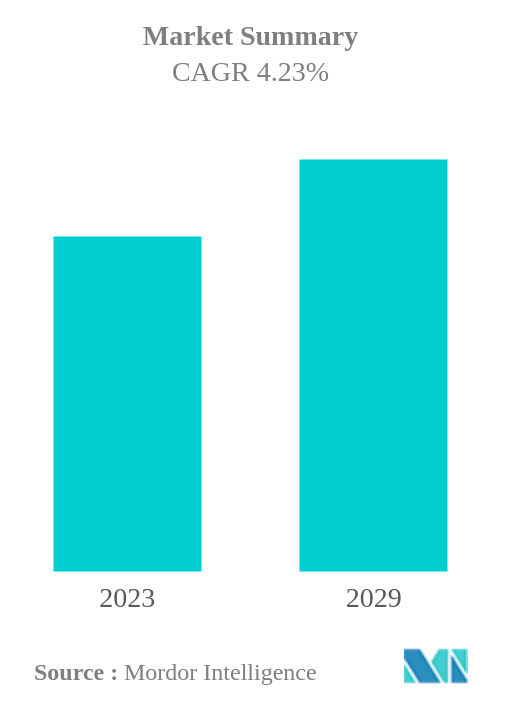
The Germany Protein Market is projected to register a CAGR of 4.23%
- Plant is the Largest Source: Immense availability, functionality, vegan protein source, and low price of soy, wheat, and pea have contributed to the leading position of plant proteins in the country.
- Food and Beverages is the Largest End User: The F&B industry dominates the market, primarily led by bakery and meat and dairy alternatives due to their functionalities that make them highly preferred ingredients.
- Plant is the Fastest-growing Source: The surging demand for plant proteins (pea and soy protein) from beverages, breakfast cereals, and confectionery contributed to their fastest growth in the country.
- Supplements is the Fastest-growing End User: The rising consumer focus on health and sports fitness is anticipated to drive the segment. Among all, the preference for soy in the sector is propelling segmental growth.
Germany Protein Market Trends
This section covers the major market trends shaping the Germany Protein Market according to our research experts:
Food and Beverages is the largest End User
- By application, the food and beverage (F&B) segment is leading the German protein market. It accounted for a major share of 55.4% by volume, followed by animal feed holding a 39.9% share in 2022. However, the beverage sub-segment is anticipated to record the fastest CAGR of 7.22%, by volume, during the forecast period, as Germans are known for their preference for fizzy drinking water and fruit juices, drinks, and nectars with added proteins.
- In the F&B segment, the meat/poultry/seafood and meat alternative products sub-segment accounted for the major share by volume in 2020, followed by the dairy and dairy alternative products sub-segment. As meat alternatives record increased demand, the German government invested around USD 780,000 in 2018 in research projects such as 'Texturing Mechanisms in the Wet Extrusion of Soy and Pea Protein,' aimed at making the texture of vegan meat more 'realistic' with the use of soy and pea proteins.
- The market growth is primarily driven by the rising number of vegan and flexitarian consumers increasingly relying on or being open-to animal-free product offerings. As of 2020, the number of vegans in Germany had doubled from 1.3 million to 2.6 million, representing 3.2% of the population.
- The sports/performance nutrition supplement sub-segment is projected to be the fastest-growing end-user application with a CAGR value of 6.28% during the forecast period 2023-2029. For instance, according to the global health and fitness association IHRSA, since 2016, the number of fitness club members in Germany increased by 14% to reach 64.76 million in 2019. In 2021, North Rhine-Westphalia had the most sports clubs among German states, numbering around 18,000, followed by Bavaria with 11,725 and Baden-Württemberg with 11,274.
Germany Protein Industry Overview
The Germany Protein Market is fragmented, with the top five companies occupying 24.05%. The major players in this market are Archer Daniels Midland Company, Arla Foods AmbA, Darling Ingredients Inc., Kerry Group PLC and Royal FrieslandCampina N.V (sorted alphabetically).
Germany Protein Market Leaders
Archer Daniels Midland Company
Arla Foods AmbA
Darling Ingredients Inc.
Kerry Group PLC
Royal FrieslandCampina N.V
*Disclaimer: Major Players sorted in no particular order
Germany Protein Market News
- March 2022: Stegmann Emmental Käsereien GmbH has now operates as MEGGLE Cheese GmbH. It has been part of the MEGGLE Group since May 2021.
- December 2021: Effective January 1, 2022, Henning Dehler will be in the role of Chief Financial Officer at MEGGLE Group GmbH. He will be responsible for the areas of finance, and information technology, as well as corporate development and transformation.
- August 2021: Arla Foods Ingredients launched MicelPure™, a micellar casein isolate, in the market. The new micellar casein isolate contains a minimum of 87% of native protein, is low in lactose and fat, is heat-stable, and has a neutral taste. It is majorly used in RTD beverages, high-protein beverages, and powder shakes.
Germany Protein Market Report - Table of Contents
EXECUTIVE SUMMARY & KEY FINDINGS
1. INTRODUCTION
1.1. Study Assumptions & Market Definition
1.2. Scope of the Study
1.3. Research Methodology
2. KEY INDUSTRY TRENDS
2.1. End User Market Volume
2.2. Protein Consumption Trends
2.3. Production Trends
2.4. Regulatory Framework
2.5. Value Chain & Distribution Channel Analysis
3. MARKET SEGMENTATION
3.1. Source
3.1.1. Animal
3.1.1.1. By Protein Type
3.1.1.1.1. Casein and Caseinates
3.1.1.1.2. Collagen
3.1.1.1.3. Egg Protein
3.1.1.1.4. Gelatin
3.1.1.1.5. Insect Protein
3.1.1.1.6. Milk Protein
3.1.1.1.7. Whey Protein
3.1.1.1.8. Other Animal Protein
3.1.2. Microbial
3.1.2.1. By Protein Type
3.1.2.1.1. Algae Protein
3.1.2.1.2. Mycoprotein
3.1.3. Plant
3.1.3.1. By Protein Type
3.1.3.1.1. Hemp Protein
3.1.3.1.2. Pea Protein
3.1.3.1.3. Potato Protein
3.1.3.1.4. Rice Protein
3.1.3.1.5. Soy Protein
3.1.3.1.6. Wheat Protein
3.1.3.1.7. Other Plant Protein
3.2. End User
3.2.1. Animal Feed
3.2.2. Food and Beverages
3.2.2.1. By Sub End User
3.2.2.1.1. Bakery
3.2.2.1.2. Beverages
3.2.2.1.3. Breakfast Cereals
3.2.2.1.4. Condiments/Sauces
3.2.2.1.5. Confectionery
3.2.2.1.6. Dairy and Dairy Alternative Products
3.2.2.1.7. Meat/Poultry/Seafood and Meat Alternative Products
3.2.2.1.8. RTE/RTC Food Products
3.2.2.1.9. Snacks
3.2.3. Personal Care and Cosmetics
3.2.4. Supplements
3.2.4.1. By Sub End User
3.2.4.1.1. Baby Food and Infant Formula
3.2.4.1.2. Elderly Nutrition and Medical Nutrition
3.2.4.1.3. Sport/Performance Nutrition
4. COMPETITIVE LANDSCAPE
4.1. Key Strategic Moves
4.2. Market Share Analysis
4.3. Company Landscape
4.4. Company Profiles
4.4.1. Agrial Enterprise
4.4.2. Archer Daniels Midland Company
4.4.3. Arla Foods AmbA
4.4.4. Darling Ingredients Inc.
4.4.5. Fonterra Co-operative Group Limited
4.4.6. Kerry Group PLC
4.4.7. Lactoprot Deutschland GmbH
4.4.8. Lantmännen
4.4.9. MEGGLE GmbH & Co. KG
4.4.10. Roquette Frère
4.4.11. Royal FrieslandCampina N.V
4.4.12. Tessenderlo Group
4.4.13. Ÿnsect
5. KEY STRATEGIC QUESTIONS FOR PROTEIN INGREDIENTS INDUSTRY CEOS
6. APPENDIX
6.1. Global Overview
6.1.1. Overview
6.1.2. Porter’s Five Forces Framework
6.1.3. Global Value Chain Analysis
6.1.4. Market Dynamics (DROs)
6.2. Sources & References
6.3. List of Tables & Figures
6.4. Primary Insights
6.5. Data Pack
6.6. Glossary of Terms
List of Tables & Figures
- Figure 1:
- GERMANY BABY FOOD AND INFANT FORMULA MARKET, VOLUME IN METRIC TONNES, 2017 - 2029
- Figure 2:
- GERMANY BAKERY MARKET, VOLUME IN METRIC TONNES, 2017 - 2029
- Figure 3:
- GERMANY BEVERAGES MARKET, VOLUME IN METRIC TONNES, 2017 - 2029
- Figure 4:
- GERMANY BREAKFAST CEREALS MARKET, VOLUME IN METRIC TONNES, 2017 - 2029
- Figure 5:
- GERMANY CONDIMENTS/SAUCES MARKET, VOLUME IN METRIC TONNES, 2017 - 2029
- Figure 6:
- GERMANY CONFECTIONERY MARKET, VOLUME IN METRIC TONNES, 2017 - 2029
- Figure 7:
- GERMANY DAIRY AND DAIRY ALTERNATIVE PRODUCTS MARKET, VOLUME IN METRIC TONNES, 2017 - 2029
- Figure 8:
- GERMANY ELDERLY NUTRITION AND MEDICAL NUTRITION MARKET, VOLUME IN METRIC TONNES, 2017 - 2029
- Figure 9:
- GERMANY MEAT/POULTRY/SEAFOOD AND MEAT ALTERNATIVE PRODUCTS MARKET, VOLUME IN METRIC TONNES, 2017 - 2029
- Figure 10:
- GERMANY RTE/RTC FOOD PRODUCTS MARKET, VOLUME IN METRIC TONNES, 2017 - 2029
- Figure 11:
- GERMANY SNACKS MARKET, VOLUME IN METRIC TONNES, 2017 - 2029
- Figure 12:
- GERMANY SPORT/PERFORMANCE NUTRITION MARKET, VOLUME IN METRIC TONNES, 2017 - 2029
- Figure 13:
- GERMANY ANIMAL FEED MARKET, VOLUME IN METRIC TONNES, 2017 - 2029
- Figure 14:
- GERMANY PERSONAL CARE AND COSMETICS MARKET, VOLUME IN METRIC TONNES, 2017 - 2029
- Figure 15:
- GERMANY PER CAPITA CONSUMPTION OF ANIMAL PROTEIN, IN GRAM, 2017 - 2029
- Figure 16:
- GERMANY PER CAPITA CONSUMPTION OF PLANT PROTEIN, IN GRAM, 2017 - 2029
- Figure 17:
- GERMANY ANIMAL PROTEIN RAW MATERIAL PRODUCTION, IN METRIC TONNES, 2017 - 2021
- Figure 18:
- GERMANY PLANT PROTEIN RAW MATERIAL PRODUCTION, IN METRIC TONNES, 2017 - 2021
- Figure 19:
- GERMANY PROTEIN MARKET, 2015-2026
- Figure 20:
- GERMANY PROTEIN MARKET, 2015-2026
- Figure 21:
- GERMANY PROTEIN MARKET, VOLUME IN METRIC TONNES, BY SOURCE, 2017 - 2029
- Figure 22:
- GERMANY PROTEIN MARKET, VALUE IN USD, BY SOURCE, 2017 - 2029
- Figure 23:
- GERMANY PROTEIN MARKET, VALUE SHARE (%), BY SOURCE, 2017 VS 2023 VS 2029
- Figure 24:
- GERMANY PROTEIN MARKET, VOLUME SHARE (%), BY SOURCE, 2017 VS 2023 VS 2029
- Figure 25:
- GERMANY PROTEIN MARKET, VOLUME IN METRIC TONNES, BY PROTEIN TYPE, 2017 - 2029
- Figure 26:
- GERMANY PROTEIN MARKET, VALUE IN USD, BY PROTEIN TYPE, 2017 - 2029
- Figure 27:
- GERMANY PROTEIN MARKET, VALUE SHARE (%), BY PROTEIN TYPE, 2017 VS 2023 VS 2029
- Figure 28:
- GERMANY PROTEIN MARKET, VOLUME SHARE (%), BY PROTEIN TYPE, 2017 VS 2023 VS 2029
- Figure 29:
- GERMANY PROTEIN MARKET, VOLUME IN METRIC TONNES, CASEIN AND CASEINATES, 2017 - 2029
- Figure 30:
- GERMANY PROTEIN MARKET, VALUE IN USD, CASEIN AND CASEINATES, 2017 - 2029
- Figure 31:
- GERMANY PROTEIN MARKET, CASEIN AND CASEINATES, VALUE SHARE (%), BY END USER, 2022 VS 2029
- Figure 32:
- GERMANY PROTEIN MARKET, VOLUME IN METRIC TONNES, COLLAGEN, 2017 - 2029
- Figure 33:
- GERMANY PROTEIN MARKET, VALUE IN USD, COLLAGEN, 2017 - 2029
- Figure 34:
- GERMANY PROTEIN MARKET, COLLAGEN, VALUE SHARE (%), BY END USER, 2022 VS 2029
- Figure 35:
- GERMANY PROTEIN MARKET, VOLUME IN METRIC TONNES, EGG PROTEIN, 2017 - 2029
- Figure 36:
- GERMANY PROTEIN MARKET, VALUE IN USD, EGG PROTEIN, 2017 - 2029
- Figure 37:
- GERMANY PROTEIN MARKET, EGG PROTEIN, VALUE SHARE (%), BY END USER, 2022 VS 2029
- Figure 38:
- GERMANY PROTEIN MARKET, VOLUME IN METRIC TONNES, GELATIN, 2017 - 2029
- Figure 39:
- GERMANY PROTEIN MARKET, VALUE IN USD, GELATIN, 2017 - 2029
- Figure 40:
- GERMANY PROTEIN MARKET, GELATIN, VALUE SHARE (%), BY END USER, 2022 VS 2029
- Figure 41:
- GERMANY PROTEIN MARKET, VOLUME IN METRIC TONNES, INSECT PROTEIN, 2017 - 2029
- Figure 42:
- GERMANY PROTEIN MARKET, VALUE IN USD, INSECT PROTEIN, 2017 - 2029
- Figure 43:
- GERMANY PROTEIN MARKET, INSECT PROTEIN, VALUE SHARE (%), BY END USER, 2022 VS 2029
- Figure 44:
- GERMANY PROTEIN MARKET, VOLUME IN METRIC TONNES, MILK PROTEIN, 2017 - 2029
- Figure 45:
- GERMANY PROTEIN MARKET, VALUE IN USD, MILK PROTEIN, 2017 - 2029
- Figure 46:
- GERMANY PROTEIN MARKET, MILK PROTEIN, VALUE SHARE (%), BY END USER, 2022 VS 2029
- Figure 47:
- GERMANY PROTEIN MARKET, VOLUME IN METRIC TONNES, WHEY PROTEIN, 2017 - 2029
- Figure 48:
- GERMANY PROTEIN MARKET, VALUE IN USD, WHEY PROTEIN, 2017 - 2029
- Figure 49:
- GERMANY PROTEIN MARKET, WHEY PROTEIN, VALUE SHARE (%), BY END USER, 2022 VS 2029
- Figure 50:
- GERMANY PROTEIN MARKET, VOLUME IN METRIC TONNES, OTHER ANIMAL PROTEIN, 2017 - 2029
- Figure 51:
- GERMANY PROTEIN MARKET, VALUE IN USD, OTHER ANIMAL PROTEIN, 2017 - 2029
- Figure 52:
- GERMANY PROTEIN MARKET, OTHER ANIMAL PROTEIN, VALUE SHARE (%), BY END USER, 2022 VS 2029
- Figure 53:
- GERMANY PROTEIN MARKET, VOLUME IN METRIC TONNES, BY PROTEIN TYPE, 2017 - 2029
- Figure 54:
- GERMANY PROTEIN MARKET, VALUE IN USD, BY PROTEIN TYPE, 2017 - 2029
- Figure 55:
- GERMANY PROTEIN MARKET, VALUE SHARE (%), BY PROTEIN TYPE, 2017 VS 2023 VS 2029
- Figure 56:
- GERMANY PROTEIN MARKET, VOLUME SHARE (%), BY PROTEIN TYPE, 2017 VS 2023 VS 2029
- Figure 57:
- GERMANY PROTEIN MARKET, VOLUME IN METRIC TONNES, ALGAE PROTEIN, 2017 - 2029
- Figure 58:
- GERMANY PROTEIN MARKET, VALUE IN USD, ALGAE PROTEIN, 2017 - 2029
- Figure 59:
- GERMANY PROTEIN MARKET, ALGAE PROTEIN, VALUE SHARE (%), BY END USER, 2022 VS 2029
- Figure 60:
- GERMANY PROTEIN MARKET, VOLUME IN METRIC TONNES, MYCOPROTEIN, 2017 - 2029
- Figure 61:
- GERMANY PROTEIN MARKET, VALUE IN USD, MYCOPROTEIN, 2017 - 2029
- Figure 62:
- GERMANY PROTEIN MARKET, MYCOPROTEIN, VALUE SHARE (%), BY END USER, 2022 VS 2029
- Figure 63:
- GERMANY PROTEIN MARKET, VOLUME IN METRIC TONNES, BY PROTEIN TYPE, 2017 - 2029
- Figure 64:
- GERMANY PROTEIN MARKET, VALUE IN USD, BY PROTEIN TYPE, 2017 - 2029
- Figure 65:
- GERMANY PROTEIN MARKET, VALUE SHARE (%), BY PROTEIN TYPE, 2017 VS 2023 VS 2029
- Figure 66:
- GERMANY PROTEIN MARKET, VOLUME SHARE (%), BY PROTEIN TYPE, 2017 VS 2023 VS 2029
- Figure 67:
- GERMANY PROTEIN MARKET, VOLUME IN METRIC TONNES, HEMP PROTEIN, 2017 - 2029
- Figure 68:
- GERMANY PROTEIN MARKET, VALUE IN USD, HEMP PROTEIN, 2017 - 2029
- Figure 69:
- GERMANY PROTEIN MARKET, HEMP PROTEIN, VALUE SHARE (%), BY END USER, 2022 VS 2029
- Figure 70:
- GERMANY PROTEIN MARKET, VOLUME IN METRIC TONNES, PEA PROTEIN, 2017 - 2029
- Figure 71:
- GERMANY PROTEIN MARKET, VALUE IN USD, PEA PROTEIN, 2017 - 2029
- Figure 72:
- GERMANY PROTEIN MARKET, PEA PROTEIN, VALUE SHARE (%), BY END USER, 2022 VS 2029
- Figure 73:
- GERMANY PROTEIN MARKET, VOLUME IN METRIC TONNES, POTATO PROTEIN, 2017 - 2029
- Figure 74:
- GERMANY PROTEIN MARKET, VALUE IN USD, POTATO PROTEIN, 2017 - 2029
- Figure 75:
- GERMANY PROTEIN MARKET, POTATO PROTEIN, VALUE SHARE (%), BY END USER, 2022 VS 2029
- Figure 76:
- GERMANY PROTEIN MARKET, VOLUME IN METRIC TONNES, RICE PROTEIN, 2017 - 2029
- Figure 77:
- GERMANY PROTEIN MARKET, VALUE IN USD, RICE PROTEIN, 2017 - 2029
- Figure 78:
- GERMANY PROTEIN MARKET, RICE PROTEIN, VALUE SHARE (%), BY END USER, 2022 VS 2029
- Figure 79:
- GERMANY PROTEIN MARKET, VOLUME IN METRIC TONNES, SOY PROTEIN, 2017 - 2029
- Figure 80:
- GERMANY PROTEIN MARKET, VALUE IN USD, SOY PROTEIN, 2017 - 2029
- Figure 81:
- GERMANY PROTEIN MARKET, SOY PROTEIN, VALUE SHARE (%), BY END USER, 2022 VS 2029
- Figure 82:
- GERMANY PROTEIN MARKET, VOLUME IN METRIC TONNES, WHEAT PROTEIN, 2017 - 2029
- Figure 83:
- GERMANY PROTEIN MARKET, VALUE IN USD, WHEAT PROTEIN, 2017 - 2029
- Figure 84:
- GERMANY PROTEIN MARKET, WHEAT PROTEIN, VALUE SHARE (%), BY END USER, 2022 VS 2029
- Figure 85:
- GERMANY PROTEIN MARKET, VOLUME IN METRIC TONNES, OTHER PLANT PROTEIN, 2017 - 2029
- Figure 86:
- GERMANY PROTEIN MARKET, VALUE IN USD, OTHER PLANT PROTEIN, 2017 - 2029
- Figure 87:
- GERMANY PROTEIN MARKET, OTHER PLANT PROTEIN, VALUE SHARE (%), BY END USER, 2022 VS 2029
- Figure 88:
- GERMANY PROTEIN MARKET, VOLUME IN METRIC TONNES, BY END USER, 2017 - 2029
- Figure 89:
- GERMANY PROTEIN MARKET, VALUE IN USD, BY END USER, 2017 - 2029
- Figure 90:
- GERMANY PROTEIN MARKET, VALUE SHARE (%), BY END USER, 2017 VS 2023 VS 2029
- Figure 91:
- GERMANY PROTEIN MARKET, VOLUME SHARE (%), BY END USER, 2017 VS 2023 VS 2029
- Figure 92:
- GERMANY PROTEIN MARKET, VOLUME IN METRIC TONNES, ANIMAL FEED, 2017 - 2029
- Figure 93:
- GERMANY PROTEIN MARKET, VALUE IN USD, ANIMAL FEED, 2017 - 2029
- Figure 94:
- GERMANY PROTEIN MARKET, ANIMAL FEED, VALUE SHARE (%), BY SOURCE, 2022 VS 2029
- Figure 95:
- GERMANY PROTEIN MARKET, VOLUME IN METRIC TONNES, BY SUB END USER, 2017 - 2029
- Figure 96:
- GERMANY PROTEIN MARKET, VALUE IN USD, BY SUB END USER, 2017 - 2029
- Figure 97:
- GERMANY PROTEIN MARKET, VALUE SHARE (%), BY SUB END USER, 2017 VS 2023 VS 2029
- Figure 98:
- GERMANY PROTEIN MARKET, VOLUME SHARE (%), BY SUB END USER, 2017 VS 2023 VS 2029
- Figure 99:
- GERMANY PROTEIN MARKET, VOLUME IN METRIC TONNES, BAKERY, 2017 - 2029
- Figure 100:
- GERMANY PROTEIN MARKET, VALUE IN USD, BAKERY, 2017 - 2029
- Figure 101:
- GERMANY PROTEIN MARKET, BAKERY, VALUE SHARE (%), BY SOURCE, 2022 VS 2029
- Figure 102:
- GERMANY PROTEIN MARKET, VOLUME IN METRIC TONNES, BEVERAGES, 2017 - 2029
- Figure 103:
- GERMANY PROTEIN MARKET, VALUE IN USD, BEVERAGES, 2017 - 2029
- Figure 104:
- GERMANY PROTEIN MARKET, BEVERAGES, VALUE SHARE (%), BY SOURCE, 2022 VS 2029
- Figure 105:
- GERMANY PROTEIN MARKET, VOLUME IN METRIC TONNES, BREAKFAST CEREALS, 2017 - 2029
- Figure 106:
- GERMANY PROTEIN MARKET, VALUE IN USD, BREAKFAST CEREALS, 2017 - 2029
- Figure 107:
- GERMANY PROTEIN MARKET, BREAKFAST CEREALS, VALUE SHARE (%), BY SOURCE, 2022 VS 2029
- Figure 108:
- GERMANY PROTEIN MARKET, VOLUME IN METRIC TONNES, CONDIMENTS/SAUCES, 2017 - 2029
- Figure 109:
- GERMANY PROTEIN MARKET, VALUE IN USD, CONDIMENTS/SAUCES, 2017 - 2029
- Figure 110:
- GERMANY PROTEIN MARKET, CONDIMENTS/SAUCES, VALUE SHARE (%), BY SOURCE, 2022 VS 2029
- Figure 111:
- GERMANY PROTEIN MARKET, VOLUME IN METRIC TONNES, CONFECTIONERY, 2017 - 2029
- Figure 112:
- GERMANY PROTEIN MARKET, VALUE IN USD, CONFECTIONERY, 2017 - 2029
- Figure 113:
- GERMANY PROTEIN MARKET, CONFECTIONERY, VALUE SHARE (%), BY SOURCE, 2022 VS 2029
- Figure 114:
- GERMANY PROTEIN MARKET, VOLUME IN METRIC TONNES, DAIRY AND DAIRY ALTERNATIVE PRODUCTS, 2017 - 2029
- Figure 115:
- GERMANY PROTEIN MARKET, VALUE IN USD, DAIRY AND DAIRY ALTERNATIVE PRODUCTS, 2017 - 2029
- Figure 116:
- GERMANY PROTEIN MARKET, DAIRY AND DAIRY ALTERNATIVE PRODUCTS, VALUE SHARE (%), BY SOURCE, 2022 VS 2029
- Figure 117:
- GERMANY PROTEIN MARKET, VOLUME IN METRIC TONNES, MEAT/POULTRY/SEAFOOD AND MEAT ALTERNATIVE PRODUCTS, 2017 - 2029
- Figure 118:
- GERMANY PROTEIN MARKET, VALUE IN USD, MEAT/POULTRY/SEAFOOD AND MEAT ALTERNATIVE PRODUCTS, 2017 - 2029
- Figure 119:
- GERMANY PROTEIN MARKET, MEAT/POULTRY/SEAFOOD AND MEAT ALTERNATIVE PRODUCTS, VALUE SHARE (%), BY SOURCE, 2022 VS 2029
- Figure 120:
- GERMANY PROTEIN MARKET, VOLUME IN METRIC TONNES, RTE/RTC FOOD PRODUCTS, 2017 - 2029
- Figure 121:
- GERMANY PROTEIN MARKET, VALUE IN USD, RTE/RTC FOOD PRODUCTS, 2017 - 2029
- Figure 122:
- GERMANY PROTEIN MARKET, RTE/RTC FOOD PRODUCTS, VALUE SHARE (%), BY SOURCE, 2022 VS 2029
- Figure 123:
- GERMANY PROTEIN MARKET, VOLUME IN METRIC TONNES, SNACKS, 2017 - 2029
- Figure 124:
- GERMANY PROTEIN MARKET, VALUE IN USD, SNACKS, 2017 - 2029
- Figure 125:
- GERMANY PROTEIN MARKET, SNACKS, VALUE SHARE (%), BY SOURCE, 2022 VS 2029
- Figure 126:
- GERMANY PROTEIN MARKET, VOLUME IN METRIC TONNES, PERSONAL CARE AND COSMETICS, 2017 - 2029
- Figure 127:
- GERMANY PROTEIN MARKET, VALUE IN USD, PERSONAL CARE AND COSMETICS, 2017 - 2029
- Figure 128:
- GERMANY PROTEIN MARKET, PERSONAL CARE AND COSMETICS, VALUE SHARE (%), BY SOURCE, 2022 VS 2029
- Figure 129:
- GERMANY PROTEIN MARKET, VOLUME IN METRIC TONNES, BY SUB END USER, 2017 - 2029
- Figure 130:
- GERMANY PROTEIN MARKET, VALUE IN USD, BY SUB END USER, 2017 - 2029
- Figure 131:
- GERMANY PROTEIN MARKET, VALUE SHARE (%), BY SUB END USER, 2017 VS 2023 VS 2029
- Figure 132:
- GERMANY PROTEIN MARKET, VOLUME SHARE (%), BY SUB END USER, 2017 VS 2023 VS 2029
- Figure 133:
- GERMANY PROTEIN MARKET, VOLUME IN METRIC TONNES, BABY FOOD AND INFANT FORMULA, 2017 - 2029
- Figure 134:
- GERMANY PROTEIN MARKET, VALUE IN USD, BABY FOOD AND INFANT FORMULA, 2017 - 2029
- Figure 135:
- GERMANY PROTEIN MARKET, BABY FOOD AND INFANT FORMULA, VALUE SHARE (%), BY SOURCE, 2022 VS 2029
- Figure 136:
- GERMANY PROTEIN MARKET, VOLUME IN METRIC TONNES, ELDERLY NUTRITION AND MEDICAL NUTRITION, 2017 - 2029
- Figure 137:
- GERMANY PROTEIN MARKET, VALUE IN USD, ELDERLY NUTRITION AND MEDICAL NUTRITION, 2017 - 2029
- Figure 138:
- GERMANY PROTEIN MARKET, ELDERLY NUTRITION AND MEDICAL NUTRITION, VALUE SHARE (%), BY SOURCE, 2022 VS 2029
- Figure 139:
- GERMANY PROTEIN MARKET, VOLUME IN METRIC TONNES, SPORT/PERFORMANCE NUTRITION, 2017 - 2029
- Figure 140:
- GERMANY PROTEIN MARKET, VALUE IN USD, SPORT/PERFORMANCE NUTRITION, 2017 - 2029
- Figure 141:
- GERMANY PROTEIN MARKET, SPORT/PERFORMANCE NUTRITION, VALUE SHARE (%), BY SOURCE, 2022 VS 2029
- Figure 142:
- GERMANY PROTEIN MARKET, MOST ACTIVE COMPANIES, BY NUMBER OF STRATEGIC MOVES, 2017 - 2022
- Figure 143:
- GERMANY PROTEIN MARKET, TOTAL NUMBER OF STRATEGIC MOVES, 2017 - 2022
- Figure 144:
- GERMANY PROTEIN MARKET SHARE(%), BY KEY PLAYERS, 2021
Germany Protein Industry Segmentation
Animal, Microbial, Plant are covered as segments by Source. Animal Feed, Food and Beverages, Personal Care and Cosmetics, Supplements are covered as segments by End User.| Source | ||||||||||||
| ||||||||||||
| ||||||||||||
|
| End User | |||||||||||||
| Animal Feed | |||||||||||||
| |||||||||||||
| Personal Care and Cosmetics | |||||||||||||
|
Market Definition
- End User - The Protein Ingredients Market operates on a B2B basis. Food, Beverages, Supplements, Animal Feed, and Personal Care & Cosmetic manufacturers are considered to be end-consumers in the market studied. The scope excludes manufacturers buying liquid/dry whey to be used for application as a binding agent or thickener or other non-protein applications.
- Penetration Rate - Penetration Rate is defined as the percentage of Protein-Fortified End User Market Volume in the Overall End User Market Volume.
- Average Protein Content - It is the average protein content present in per 100 g of product manufactured by all end-user companies considered under the scope of this report.
Research Methodology
Mordor Intelligence follows a four-step methodology in all our reports.
- Step-1: Identify Key Variables: The quantifiable key variables (industry and extraneous) pertaining to the specific product segment and country are selected from a group of relevant variables & factors based on desk research & literature review; along with primary expert inputs. These variables are further confirmed through regression modeling (wherever required).
- Step-2: Build a Market Model: In order to build a robust forecasting methodology, the variables and factors identified in Step-1 are tested against available historical market numbers. Through an iterative process, the variables required for market forecast are set and the model is built on the basis of these variables.
- Step-3: Validate and Finalize: In this important step, all market numbers, variables and analyst calls are validated through an extensive network of primary research experts from the market studied. The respondents are selected across levels and functions to generate a holistic picture of the market studied.
- Step-4: Research Outputs: Syndicated Reports, Custom Consulting Assignments, Databases & Subscription Platforms


