Construction Adhesives & Sealants Market Size

| Icons | Lable | Value |
|---|---|---|
|
|
Study Period | 2017 - 2028 |
|
|
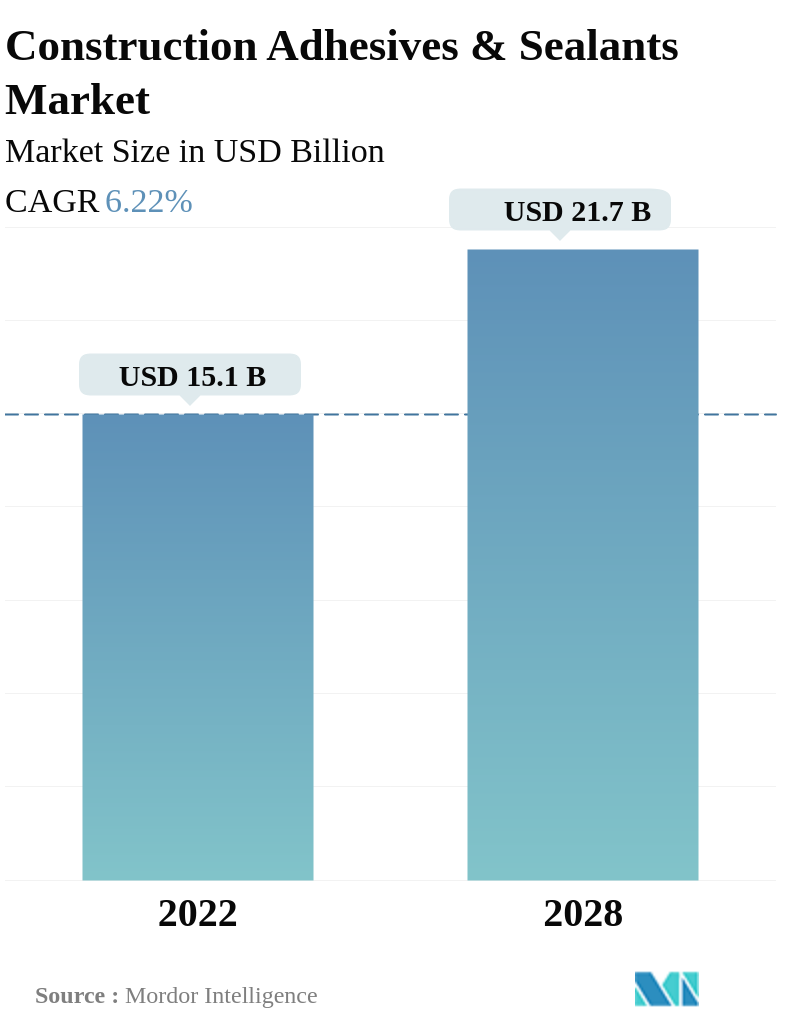
Market Size (2028) | USD 21.7 Billion |
|
|
Market Size (2022) | USD 15.1 Billion |
|
|
Largest Share by Resin | Polyurethane |
|
|
CAGR (2022 - 2028) | 6.22 % |
|
|
Largest Share by Region | Asia-Pacific |
Major Players |
||
|
|
||
|
*Disclaimer: Major Players sorted in no particular order |
Construction Adhesives & Sealants Market Analysis
The Construction Adhesives & Sealants Market is projected to register a CAGR of 6.22%
- Sealants is the Largest Technology. Globally, sealants registered the highest market share due to their wide applications in the building and construction industry, including joint sealing, insulation, curtain wall, façade, and glazing.
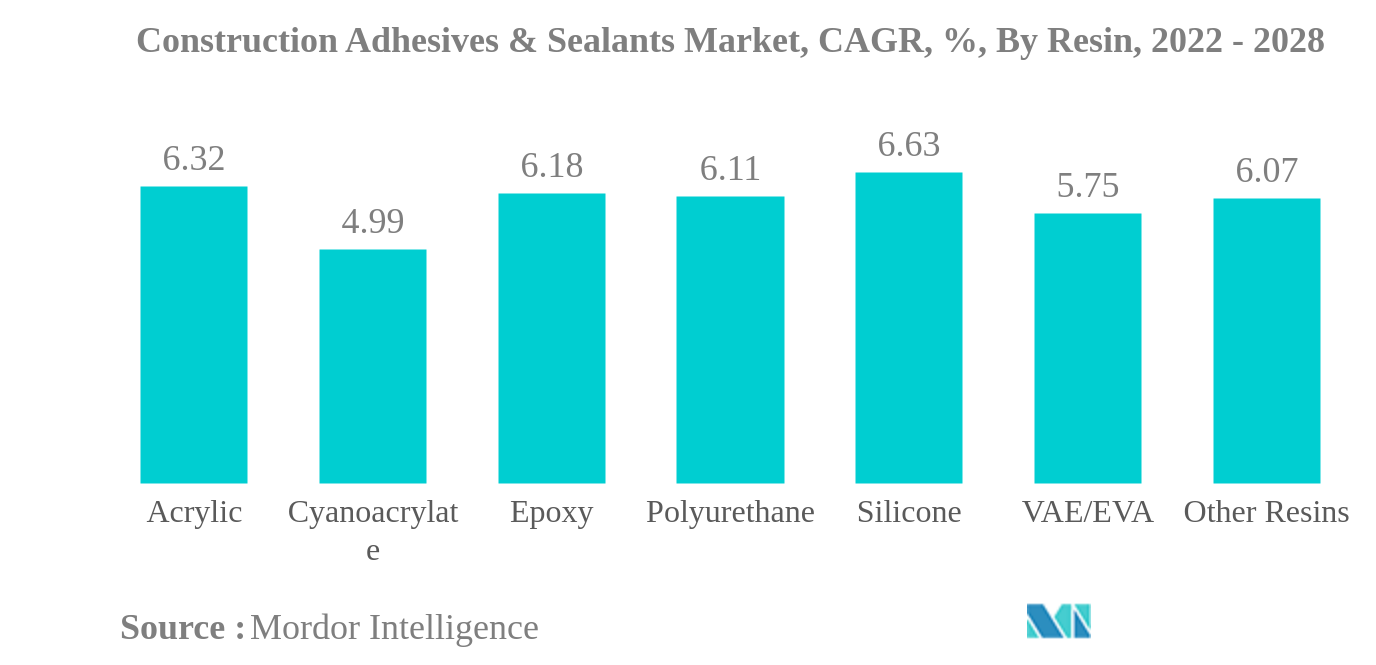
- Polyurethane is the Largest Resin. Polyurethane resins hold the largest market share owing to their wide applications as adhesives and sealants in the building and construction industry, specifically for both interior and exterior applications.
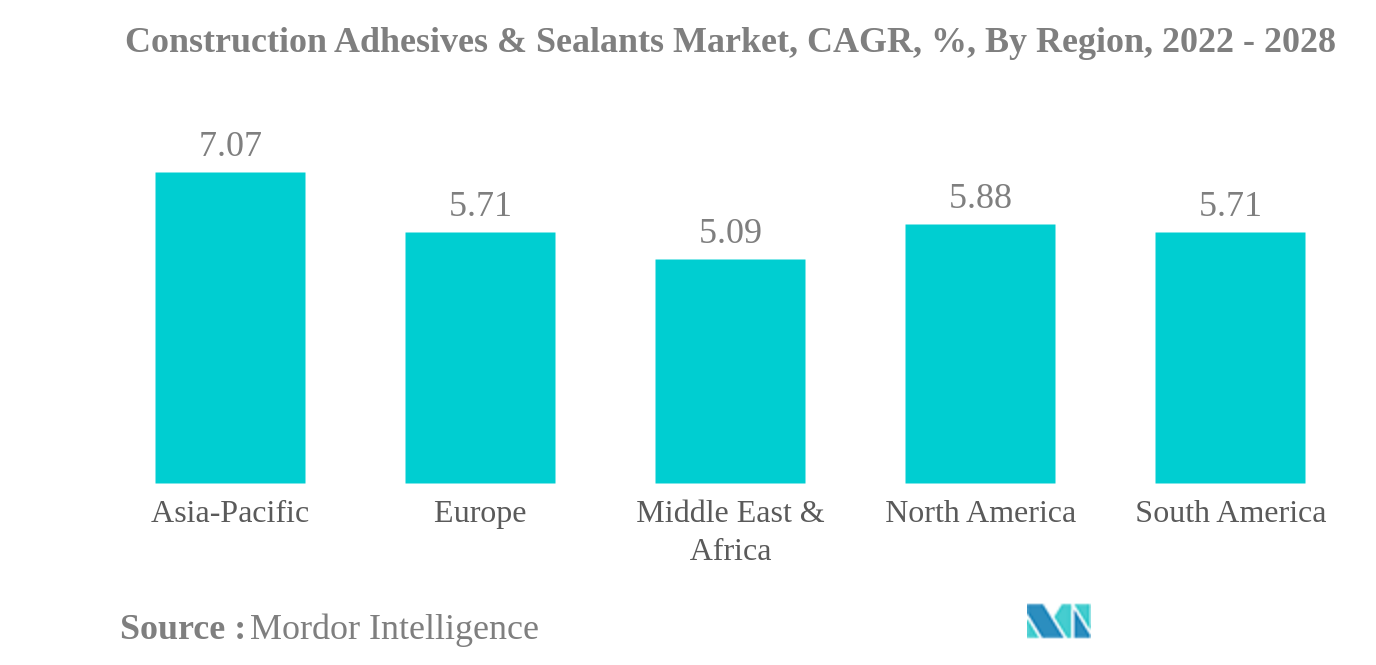
- Asia-Pacific is the Largest Region. The Asia-Pacific region is the largest regional segment, driven mainly by the demand for residential and commercial construction in countries including India, China, South Korea, Thailand, and Japan.
- Asia-Pacific is the Fastest-growing Region. Due to the increasing population and rapid urbanization in countries such as China, India, Indonesia, and Malaysia, the Asia-Pacific region is projected to be the fastest-growing region in the market during the forecast period.
Construction Adhesives & Sealants Market Trends
This section covers the major market trends shaping the Construction Adhesives & Sealants Market according to our research experts:
Polyurethane is the largest Resin
- Globally, the most prominent are adhesives and sealants based on polyurethane, acrylic, silicone, and polysulphide resins. Global demand for these products witnessed slow growth during 2017-2019 due to a decline in construction activities in the Asia-Pacific and European regions. The demand from these two regions recorded CAGRs of -1.82% and 0.73%, respectively, in this period. The demand for construction adhesives and sealants declined in 2020 from all regions due to a shortage of raw materials, workers, and other factors due to the COVID-19 pandemic. Among all resins, the demand for adhesives based on cyanoacrylate resins took the worst hit and declined by 6.19% compared to 2019.
- In 2021, as restrictions eased, the demand for construction adhesives and sealants quickly rebounded to the pre-pandemic levels. Support schemes like the Homebuilder program in Australia played a crucial role in the demand growth. This growth trend is expected to continue throughout the forecast period, and the demand for construction adhesives and sealants is expected to record a CAGR of 4.13% during the forecast period 2022-2028.
- Construction adhesives and sealants based on acrylic resin occupied the largest share of the demand among all resins because of their strong bonds. The demand share for acrylic resins is expected to remain the highest during the forecast period. The demand growth for silicone resin-based construction adhesives and sealants is expected to outpace the demand growth for acrylic resin-based construction adhesives and sealants over the forecast period.
Asia-Pacific is the largest Region
- Asia-Pacific accounted for the largest share of the demand for construction adhesives and sealants throughout the study period because of the large number of construction activities in China, Japan, South Korea, India, Australia, and other countries in the region. China has the largest construction market globally and generates up to 71% of the demand from Asia-Pacific due to the country's large population and increasing urbanization.
- In 2017-2019, the demand for construction adhesives and sealants was sluggish due to a decline in construction activities in a few countries in Europe and South America because of the increased volatility of financial markets and increased interest rates by central banks of countries like Argentina.
- In 2020, the demand for construction adhesives and sealants declined by up to 27% in a few countries, but the global impact was not severe as construction activities were deemed essential in a few countries like South Africa and Brazil, among others. In a few countries, like Russia, construction sites were the first to reopen after the pandemic. These factors cushioned the COVID-19 pandemic's impact on the global market, restricting the decline to 7.6%.
- In 2021, due to relief packages and support schemes in countries like the United States, Australia, and EU countries, construction activities quickly reached their pre-pandemic levels, thus boosting the demand for construction adhesives and sealants. Infrastructure construction adhesives and sealants are expected to witness the largest growth among other construction adhesives and sealants types during the forecast period because of increased investments and budget allotments in European, South American, and Asia-Pacific countries.
Construction Adhesives & Sealants Industry Overview
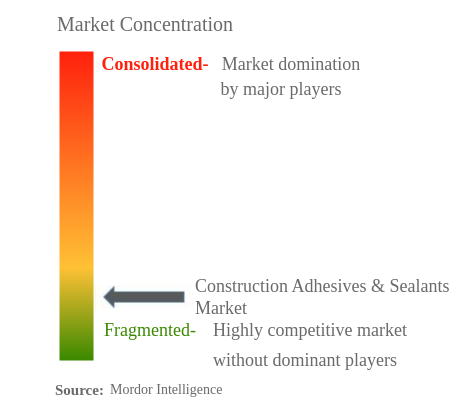
The Construction Adhesives & Sealants Market is fragmented, with the top five companies occupying 32.69%. The major players in this market are Arkema Group, Henkel AG & Co. KGaA, MAPEI S.p.A., Sika AG and Soudal Holding N.V. (sorted alphabetically).
Construction Adhesives & Sealants Market Leaders
Arkema Group
Henkel AG & Co. KGaA
MAPEI S.p.A.
Sika AG
Soudal Holding N.V.
*Disclaimer: Major Players sorted in no particular order
Construction Adhesives & Sealants Market News
- July 2022: Mapei started the construction of its third manufacturing facility in Kosi, Mathura, to cater to the demand generated from Northern India.
- July 2022: Arkema closed the acquisition of Permoseal, a pioneer in adhesive solutions for DIY, packaging, and construction, and enhanced its presence in South Africa.
- April 2022: ITW Performance Polymers launched Plexus MA8105 as its newest adhesive with fast room-temperature curing, excellent mechanical properties, and a broad range of adhesion.
Construction Adhesives & Sealants Market Report - Table of Contents
1. INTRODUCTION
1.1. Study Assumptions & Market Definition
1.2. Scope of the Study
1.3. Research Methodology
2. KEY INDUSTRY TRENDS
2.1. End User Trends
2.2. Regulatory Framework
2.3. Value Chain & Distribution Channel Analysis
3. MARKET SEGMENTATION
3.1. Resin
3.1.1. Acrylic
3.1.2. Cyanoacrylate
3.1.3. Epoxy
3.1.4. Polyurethane
3.1.5. Silicone
3.1.6. VAE/EVA
3.1.7. Other Resins
3.2. Technology
3.2.1. Hot Melt
3.2.2. Reactive
3.2.3. Sealants
3.2.4. Solvent-borne
3.2.5. Water-borne
3.3. Region
3.3.1. Asia-Pacific
3.3.1.1. Australia
3.3.1.2. China
3.3.1.3. India
3.3.1.4. Indonesia
3.3.1.5. Japan
3.3.1.6. Malaysia
3.3.1.7. Singapore
3.3.1.8. South Korea
3.3.1.9. Thailand
3.3.1.10. Rest of Asia-Pacific
3.3.2. Europe
3.3.2.1. France
3.3.2.2. Germany
3.3.2.3. Italy
3.3.2.4. Russia
3.3.2.5. Spain
3.3.2.6. United Kingdom
3.3.2.7. Rest of Europe
3.3.3. Middle East & Africa
3.3.3.1. Saudi Arabia
3.3.3.2. South Africa
3.3.3.3. Rest of Middle East & Africa
3.3.4. North America
3.3.4.1. Canada
3.3.4.2. Mexico
3.3.4.3. United States
3.3.4.4. Rest of North America
3.3.5. South America
3.3.5.1. Argentina
3.3.5.2. Brazil
3.3.5.3. Rest of South America
4. COMPETITIVE LANDSCAPE
4.1. Key Strategic Moves
4.2. Market Share Analysis
4.3. Company Landscape
4.4. Company Profiles
4.4.1. 3M
4.4.2. Aica Kogyo Co..Ltd.
4.4.3. Arkema Group
4.4.4. Dow
4.4.5. H.B. Fuller Company
4.4.6. Henkel AG & Co. KGaA
4.4.7. Huntsman International LLC
4.4.8. Illinois Tool Works Inc.
4.4.9. MAPEI S.p.A.
4.4.10. Momentive
4.4.11. RPM International Inc.
4.4.12. Shin-Etsu Chemical Co., Ltd.
4.4.13. Sika AG
4.4.14. Soudal Holding N.V.
4.4.15. Wacker Chemie AG
5. KEY STRATEGIC QUESTIONS FOR ADHESIVES AND SEALANTS CEOS
6. APPENDIX
6.1. Global Adhesives and Sealants Industry Overview
6.1.1. Overview
6.1.2. Porter’s Five Forces Framework
6.1.3. Global Value Chain Analysis
6.1.4. Drivers, Restraints, and Opportunities
6.2. Sources & References
6.3. List of Tables & Figures
6.4. Primary Insights
6.5. Data Pack
6.6. Glossary of Terms
List of Tables & Figures
- Figure 1:
- GLOBAL NEW FLOOR AREA, VOLUME IN SQUARE FEET, 2017-2028
- Figure 2:
- GLOBAL CONSTRUCTION ADHESIVES & SEALANTS MARKET, VOLUME, TONS, 2017 - 2028
- Figure 3:
- GLOBAL CONSTRUCTION ADHESIVES & SEALANTS MARKET, VALUE, USD, 2017 - 2028
- Figure 4:
- GLOBAL CONSTRUCTION ADHESIVES & SEALANTS MARKET, BY RESIN, VOLUME, TONS, 2017 - 2028
- Figure 5:
- GLOBAL CONSTRUCTION ADHESIVES & SEALANTS MARKET, BY RESIN, VALUE, USD, 2017 - 2028
- Figure 6:
- GLOBAL CONSTRUCTION ADHESIVES & SEALANTS MARKET, BY RESIN, VOLUME SHARE (%), 2022 VS 2028
- Figure 7:
- GLOBAL CONSTRUCTION ADHESIVES & SEALANTS MARKET, BY RESIN, VALUE SHARE (%), 2022 VS 2028
- Figure 8:
- GLOBAL CONSTRUCTION ADHESIVES & SEALANTS MARKET, ACRYLIC, VOLUME, TONS, 2017 - 2028
- Figure 9:
- GLOBAL CONSTRUCTION ADHESIVES & SEALANTS MARKET, ACRYLIC, VALUE, USD, 2017 - 2028
- Figure 10:
- GLOBAL CONSTRUCTION ADHESIVES & SEALANTS MARKET, ACRYLIC, BY TECHNOLOGY, VALUE SHARE (%), 2021 VS 2028
- Figure 11:
- GLOBAL CONSTRUCTION ADHESIVES & SEALANTS MARKET, CYANOACRYLATE, VOLUME, TONS, 2017 - 2028
- Figure 12:
- GLOBAL CONSTRUCTION ADHESIVES & SEALANTS MARKET, CYANOACRYLATE, VALUE, USD, 2017 - 2028
- Figure 13:
- GLOBAL CONSTRUCTION ADHESIVES & SEALANTS MARKET, CYANOACRYLATE, BY TECHNOLOGY, VALUE SHARE (%), 2021 VS 2028
- Figure 14:
- GLOBAL CONSTRUCTION ADHESIVES & SEALANTS MARKET, EPOXY, VOLUME, TONS, 2017 - 2028
- Figure 15:
- GLOBAL CONSTRUCTION ADHESIVES & SEALANTS MARKET, EPOXY, VALUE, USD, 2017 - 2028
- Figure 16:
- GLOBAL CONSTRUCTION ADHESIVES & SEALANTS MARKET, EPOXY, BY TECHNOLOGY, VALUE SHARE (%), 2021 VS 2028
- Figure 17:
- GLOBAL CONSTRUCTION ADHESIVES & SEALANTS MARKET, POLYURETHANE, VOLUME, TONS, 2017 - 2028
- Figure 18:
- GLOBAL CONSTRUCTION ADHESIVES & SEALANTS MARKET, POLYURETHANE, VALUE, USD, 2017 - 2028
- Figure 19:
- GLOBAL CONSTRUCTION ADHESIVES & SEALANTS MARKET, POLYURETHANE, BY TECHNOLOGY, VALUE SHARE (%), 2021 VS 2028
- Figure 20:
- GLOBAL CONSTRUCTION ADHESIVES & SEALANTS MARKET, SILICONE, VOLUME, TONS, 2017 - 2028
- Figure 21:
- GLOBAL CONSTRUCTION ADHESIVES & SEALANTS MARKET, SILICONE, VALUE, USD, 2017 - 2028
- Figure 22:
- GLOBAL CONSTRUCTION ADHESIVES & SEALANTS MARKET, SILICONE, BY TECHNOLOGY, VALUE SHARE (%), 2021 VS 2028
- Figure 23:
- GLOBAL CONSTRUCTION ADHESIVES & SEALANTS MARKET, VAE/EVA, VOLUME, TONS, 2017 - 2028
- Figure 24:
- GLOBAL CONSTRUCTION ADHESIVES & SEALANTS MARKET, VAE/EVA, VALUE, USD, 2017 - 2028
- Figure 25:
- GLOBAL CONSTRUCTION ADHESIVES & SEALANTS MARKET, VAE/EVA, BY TECHNOLOGY, VALUE SHARE (%), 2021 VS 2028
- Figure 26:
- GLOBAL CONSTRUCTION ADHESIVES & SEALANTS MARKET, OTHER RESINS, VOLUME, TONS, 2017 - 2028
- Figure 27:
- GLOBAL CONSTRUCTION ADHESIVES & SEALANTS MARKET, OTHER RESINS, VALUE, USD, 2017 - 2028
- Figure 28:
- GLOBAL CONSTRUCTION ADHESIVES & SEALANTS MARKET, OTHER RESINS, BY TECHNOLOGY, VALUE SHARE (%), 2021 VS 2028
- Figure 29:
- GLOBAL CONSTRUCTION ADHESIVES & SEALANTS MARKET, BY TECHNOLOGY, VOLUME, TONS, 2017 - 2028
- Figure 30:
- GLOBAL CONSTRUCTION ADHESIVES & SEALANTS MARKET, BY TECHNOLOGY, VALUE, USD, 2017 - 2028
- Figure 31:
- GLOBAL CONSTRUCTION ADHESIVES & SEALANTS MARKET, BY TECHNOLOGY, VOLUME SHARE (%), 2022 VS 2028
- Figure 32:
- GLOBAL CONSTRUCTION ADHESIVES & SEALANTS MARKET, BY TECHNOLOGY, VALUE SHARE (%), 2022 VS 2028
- Figure 33:
- GLOBAL CONSTRUCTION ADHESIVES & SEALANTS MARKET, HOT MELT, VOLUME, TONS, 2017 - 2028
- Figure 34:
- GLOBAL CONSTRUCTION ADHESIVES & SEALANTS MARKET, HOT MELT, VALUE, USD, 2017 - 2028
- Figure 35:
- GLOBAL CONSTRUCTION ADHESIVES & SEALANTS MARKET, HOT MELT, BY RESIN, VALUE SHARE (%), 2021 VS 2028
- Figure 36:
- GLOBAL CONSTRUCTION ADHESIVES & SEALANTS MARKET, REACTIVE, VOLUME, TONS, 2017 - 2028
- Figure 37:
- GLOBAL CONSTRUCTION ADHESIVES & SEALANTS MARKET, REACTIVE, VALUE, USD, 2017 - 2028
- Figure 38:
- GLOBAL CONSTRUCTION ADHESIVES & SEALANTS MARKET, REACTIVE, BY RESIN, VALUE SHARE (%), 2021 VS 2028
- Figure 39:
- GLOBAL CONSTRUCTION ADHESIVES & SEALANTS MARKET, SEALANTS, VOLUME, TONS, 2017 - 2028
- Figure 40:
- GLOBAL CONSTRUCTION ADHESIVES & SEALANTS MARKET, SEALANTS, VALUE, USD, 2017 - 2028
- Figure 41:
- GLOBAL CONSTRUCTION ADHESIVES & SEALANTS MARKET, SEALANTS, BY RESIN, VALUE SHARE (%), 2021 VS 2028
- Figure 42:
- GLOBAL CONSTRUCTION ADHESIVES & SEALANTS MARKET, SOLVENT-BORNE, VOLUME, TONS, 2017 - 2028
- Figure 43:
- GLOBAL CONSTRUCTION ADHESIVES & SEALANTS MARKET, SOLVENT-BORNE, VALUE, USD, 2017 - 2028
- Figure 44:
- GLOBAL CONSTRUCTION ADHESIVES & SEALANTS MARKET, SOLVENT-BORNE, BY RESIN, VALUE SHARE (%), 2021 VS 2028
- Figure 45:
- GLOBAL CONSTRUCTION ADHESIVES & SEALANTS MARKET, WATER-BORNE, VOLUME, TONS, 2017 - 2028
- Figure 46:
- GLOBAL CONSTRUCTION ADHESIVES & SEALANTS MARKET, WATER-BORNE, VALUE, USD, 2017 - 2028
- Figure 47:
- GLOBAL CONSTRUCTION ADHESIVES & SEALANTS MARKET, WATER-BORNE, BY RESIN, VALUE SHARE (%), 2021 VS 2028
- Figure 48:
- GLOBAL CONSTRUCTION ADHESIVES & SEALANTS MARKET, BY REGION, VOLUME, TONS, 2017 - 2028
- Figure 49:
- GLOBAL CONSTRUCTION ADHESIVES & SEALANTS MARKET, BY REGION, VALUE, USD, 2017 - 2028
- Figure 50:
- GLOBAL CONSTRUCTION ADHESIVES & SEALANTS MARKET, BY REGION, VOLUME SHARE (%), 2022 VS 2028
- Figure 51:
- GLOBAL CONSTRUCTION ADHESIVES & SEALANTS MARKET, BY REGION, VALUE SHARE (%), 2022 VS 2028
- Figure 52:
- GLOBAL CONSTRUCTION ADHESIVES & SEALANTS MARKET, BY COUNTRY, ASIA-PACIFIC, VOLUME, TONS, 2017 - 2028
- Figure 53:
- GLOBAL CONSTRUCTION ADHESIVES & SEALANTS MARKET, BY COUNTRY, ASIA-PACIFIC, VALUE, USD, 2017 - 2028
- Figure 54:
- GLOBAL CONSTRUCTION ADHESIVES & SEALANTS MARKET, BY COUNTRY, ASIA-PACIFIC, VOLUME SHARE(%), 2022 VS 2028
- Figure 55:
- GLOBAL CONSTRUCTION ADHESIVES & SEALANTS MARKET, BY COUNTRY, ASIA-PACIFIC, VALUE SHARE(%), 2022 VS 2028
- Figure 56:
- GLOBAL CONSTRUCTION ADHESIVES & SEALANTS MARKET, AUSTRALIA, VOLUME, TONS, 2017 - 2028
- Figure 57:
- GLOBAL CONSTRUCTION ADHESIVES & SEALANTS MARKET, AUSTRALIA, VALUE, USD, 2017 - 2028
- Figure 58:
- GLOBAL CONSTRUCTION ADHESIVES & SEALANTS MARKET, AUSTRALIA, BY TECHNOLOGY, VALUE SHARE (%), 2021 VS 2028
- Figure 59:
- GLOBAL CONSTRUCTION ADHESIVES & SEALANTS MARKET, CHINA, VOLUME, TONS, 2017 - 2028
- Figure 60:
- GLOBAL CONSTRUCTION ADHESIVES & SEALANTS MARKET, CHINA, VALUE, USD, 2017 - 2028
- Figure 61:
- GLOBAL CONSTRUCTION ADHESIVES & SEALANTS MARKET, CHINA, BY TECHNOLOGY, VALUE SHARE (%), 2021 VS 2028
- Figure 62:
- GLOBAL CONSTRUCTION ADHESIVES & SEALANTS MARKET, INDIA, VOLUME, TONS, 2017 - 2028
- Figure 63:
- GLOBAL CONSTRUCTION ADHESIVES & SEALANTS MARKET, INDIA, VALUE, USD, 2017 - 2028
- Figure 64:
- GLOBAL CONSTRUCTION ADHESIVES & SEALANTS MARKET, INDIA, BY TECHNOLOGY, VALUE SHARE (%), 2021 VS 2028
- Figure 65:
- GLOBAL CONSTRUCTION ADHESIVES & SEALANTS MARKET, INDONESIA, VOLUME, TONS, 2017 - 2028
- Figure 66:
- GLOBAL CONSTRUCTION ADHESIVES & SEALANTS MARKET, INDONESIA, VALUE, USD, 2017 - 2028
- Figure 67:
- GLOBAL CONSTRUCTION ADHESIVES & SEALANTS MARKET, INDONESIA, BY TECHNOLOGY, VALUE SHARE (%), 2021 VS 2028
- Figure 68:
- GLOBAL CONSTRUCTION ADHESIVES & SEALANTS MARKET, JAPAN, VOLUME, TONS, 2017 - 2028
- Figure 69:
- GLOBAL CONSTRUCTION ADHESIVES & SEALANTS MARKET, JAPAN, VALUE, USD, 2017 - 2028
- Figure 70:
- GLOBAL CONSTRUCTION ADHESIVES & SEALANTS MARKET, JAPAN, BY TECHNOLOGY, VALUE SHARE (%), 2021 VS 2028
- Figure 71:
- GLOBAL CONSTRUCTION ADHESIVES & SEALANTS MARKET, MALAYSIA, VOLUME, TONS, 2017 - 2028
- Figure 72:
- GLOBAL CONSTRUCTION ADHESIVES & SEALANTS MARKET, MALAYSIA, VALUE, USD, 2017 - 2028
- Figure 73:
- GLOBAL CONSTRUCTION ADHESIVES & SEALANTS MARKET, MALAYSIA, BY TECHNOLOGY, VALUE SHARE (%), 2021 VS 2028
- Figure 74:
- GLOBAL CONSTRUCTION ADHESIVES & SEALANTS MARKET, SINGAPORE, VOLUME, TONS, 2017 - 2028
- Figure 75:
- GLOBAL CONSTRUCTION ADHESIVES & SEALANTS MARKET, SINGAPORE, VALUE, USD, 2017 - 2028
- Figure 76:
- GLOBAL CONSTRUCTION ADHESIVES & SEALANTS MARKET, SINGAPORE, BY TECHNOLOGY, VALUE SHARE (%), 2021 VS 2028
- Figure 77:
- GLOBAL CONSTRUCTION ADHESIVES & SEALANTS MARKET, SOUTH KOREA, VOLUME, TONS, 2017 - 2028
- Figure 78:
- GLOBAL CONSTRUCTION ADHESIVES & SEALANTS MARKET, SOUTH KOREA, VALUE, USD, 2017 - 2028
- Figure 79:
- GLOBAL CONSTRUCTION ADHESIVES & SEALANTS MARKET, SOUTH KOREA, BY TECHNOLOGY, VALUE SHARE (%), 2021 VS 2028
- Figure 80:
- GLOBAL CONSTRUCTION ADHESIVES & SEALANTS MARKET, THAILAND, VOLUME, TONS, 2017 - 2028
- Figure 81:
- GLOBAL CONSTRUCTION ADHESIVES & SEALANTS MARKET, THAILAND, VALUE, USD, 2017 - 2028
- Figure 82:
- GLOBAL CONSTRUCTION ADHESIVES & SEALANTS MARKET, THAILAND, BY TECHNOLOGY, VALUE SHARE (%), 2021 VS 2028
- Figure 83:
- GLOBAL CONSTRUCTION ADHESIVES & SEALANTS MARKET, REST OF ASIA-PACIFIC, VOLUME, TONS, 2017 - 2028
- Figure 84:
- GLOBAL CONSTRUCTION ADHESIVES & SEALANTS MARKET, REST OF ASIA-PACIFIC, VALUE, USD, 2017 - 2028
- Figure 85:
- GLOBAL CONSTRUCTION ADHESIVES & SEALANTS MARKET, REST OF ASIA-PACIFIC, BY TECHNOLOGY, VALUE SHARE (%), 2021 VS 2028
- Figure 86:
- GLOBAL CONSTRUCTION ADHESIVES & SEALANTS MARKET, BY COUNTRY, EUROPE, VOLUME, TONS, 2017 - 2028
- Figure 87:
- GLOBAL CONSTRUCTION ADHESIVES & SEALANTS MARKET, BY COUNTRY, EUROPE, VALUE, USD, 2017 - 2028
- Figure 88:
- GLOBAL CONSTRUCTION ADHESIVES & SEALANTS MARKET, BY COUNTRY, EUROPE, VOLUME SHARE(%), 2022 VS 2028
- Figure 89:
- GLOBAL CONSTRUCTION ADHESIVES & SEALANTS MARKET, BY COUNTRY, EUROPE, VALUE SHARE(%), 2022 VS 2028
- Figure 90:
- GLOBAL CONSTRUCTION ADHESIVES & SEALANTS MARKET, FRANCE, VOLUME, TONS, 2017 - 2028
- Figure 91:
- GLOBAL CONSTRUCTION ADHESIVES & SEALANTS MARKET, FRANCE, VALUE, USD, 2017 - 2028
- Figure 92:
- GLOBAL CONSTRUCTION ADHESIVES & SEALANTS MARKET, FRANCE, BY TECHNOLOGY, VALUE SHARE (%), 2021 VS 2028
- Figure 93:
- GLOBAL CONSTRUCTION ADHESIVES & SEALANTS MARKET, GERMANY, VOLUME, TONS, 2017 - 2028
- Figure 94:
- GLOBAL CONSTRUCTION ADHESIVES & SEALANTS MARKET, GERMANY, VALUE, USD, 2017 - 2028
- Figure 95:
- GLOBAL CONSTRUCTION ADHESIVES & SEALANTS MARKET, GERMANY, BY TECHNOLOGY, VALUE SHARE (%), 2021 VS 2028
- Figure 96:
- GLOBAL CONSTRUCTION ADHESIVES & SEALANTS MARKET, ITALY, VOLUME, TONS, 2017 - 2028
- Figure 97:
- GLOBAL CONSTRUCTION ADHESIVES & SEALANTS MARKET, ITALY, VALUE, USD, 2017 - 2028
- Figure 98:
- GLOBAL CONSTRUCTION ADHESIVES & SEALANTS MARKET, ITALY, BY TECHNOLOGY, VALUE SHARE (%), 2021 VS 2028
- Figure 99:
- GLOBAL CONSTRUCTION ADHESIVES & SEALANTS MARKET, RUSSIA, VOLUME, TONS, 2017 - 2028
- Figure 100:
- GLOBAL CONSTRUCTION ADHESIVES & SEALANTS MARKET, RUSSIA, VALUE, USD, 2017 - 2028
- Figure 101:
- GLOBAL CONSTRUCTION ADHESIVES & SEALANTS MARKET, RUSSIA, BY TECHNOLOGY, VALUE SHARE (%), 2021 VS 2028
- Figure 102:
- GLOBAL CONSTRUCTION ADHESIVES & SEALANTS MARKET, SPAIN, VOLUME, TONS, 2017 - 2028
- Figure 103:
- GLOBAL CONSTRUCTION ADHESIVES & SEALANTS MARKET, SPAIN, VALUE, USD, 2017 - 2028
- Figure 104:
- GLOBAL CONSTRUCTION ADHESIVES & SEALANTS MARKET, SPAIN, BY TECHNOLOGY, VALUE SHARE (%), 2021 VS 2028
- Figure 105:
- GLOBAL CONSTRUCTION ADHESIVES & SEALANTS MARKET, UNITED KINGDOM, VOLUME, TONS, 2017 - 2028
- Figure 106:
- GLOBAL CONSTRUCTION ADHESIVES & SEALANTS MARKET, UNITED KINGDOM, VALUE, USD, 2017 - 2028
- Figure 107:
- GLOBAL CONSTRUCTION ADHESIVES & SEALANTS MARKET, UNITED KINGDOM, BY TECHNOLOGY, VALUE SHARE (%), 2021 VS 2028
- Figure 108:
- GLOBAL CONSTRUCTION ADHESIVES & SEALANTS MARKET, REST OF EUROPE, VOLUME, TONS, 2017 - 2028
- Figure 109:
- GLOBAL CONSTRUCTION ADHESIVES & SEALANTS MARKET, REST OF EUROPE, VALUE, USD, 2017 - 2028
- Figure 110:
- GLOBAL CONSTRUCTION ADHESIVES & SEALANTS MARKET, REST OF EUROPE, BY TECHNOLOGY, VALUE SHARE (%), 2021 VS 2028
- Figure 111:
- GLOBAL CONSTRUCTION ADHESIVES & SEALANTS MARKET, BY COUNTRY, MIDDLE EAST & AFRICA, VOLUME, TONS, 2017 - 2028
- Figure 112:
- GLOBAL CONSTRUCTION ADHESIVES & SEALANTS MARKET, BY COUNTRY, MIDDLE EAST & AFRICA, VALUE, USD, 2017 - 2028
- Figure 113:
- GLOBAL CONSTRUCTION ADHESIVES & SEALANTS MARKET, BY COUNTRY, MIDDLE EAST & AFRICA, VOLUME SHARE(%), 2022 VS 2028
- Figure 114:
- GLOBAL CONSTRUCTION ADHESIVES & SEALANTS MARKET, BY COUNTRY, MIDDLE EAST & AFRICA, VALUE SHARE(%), 2022 VS 2028
- Figure 115:
- GLOBAL CONSTRUCTION ADHESIVES & SEALANTS MARKET, SAUDI ARABIA, VOLUME, TONS, 2017 - 2028
- Figure 116:
- GLOBAL CONSTRUCTION ADHESIVES & SEALANTS MARKET, SAUDI ARABIA, VALUE, USD, 2017 - 2028
- Figure 117:
- GLOBAL CONSTRUCTION ADHESIVES & SEALANTS MARKET, SAUDI ARABIA, BY TECHNOLOGY, VALUE SHARE (%), 2021 VS 2028
- Figure 118:
- GLOBAL CONSTRUCTION ADHESIVES & SEALANTS MARKET, SOUTH AFRICA, VOLUME, TONS, 2017 - 2028
- Figure 119:
- GLOBAL CONSTRUCTION ADHESIVES & SEALANTS MARKET, SOUTH AFRICA, VALUE, USD, 2017 - 2028
- Figure 120:
- GLOBAL CONSTRUCTION ADHESIVES & SEALANTS MARKET, SOUTH AFRICA, BY TECHNOLOGY, VALUE SHARE (%), 2021 VS 2028
- Figure 121:
- GLOBAL CONSTRUCTION ADHESIVES & SEALANTS MARKET, REST OF MIDDLE EAST & AFRICA, VOLUME, TONS, 2017 - 2028
- Figure 122:
- GLOBAL CONSTRUCTION ADHESIVES & SEALANTS MARKET, REST OF MIDDLE EAST & AFRICA, VALUE, USD, 2017 - 2028
- Figure 123:
- GLOBAL CONSTRUCTION ADHESIVES & SEALANTS MARKET, REST OF MIDDLE EAST & AFRICA, BY TECHNOLOGY, VALUE SHARE (%), 2021 VS 2028
- Figure 124:
- GLOBAL CONSTRUCTION ADHESIVES & SEALANTS MARKET, BY COUNTRY, NORTH AMERICA, VOLUME, TONS, 2017 - 2028
- Figure 125:
- GLOBAL CONSTRUCTION ADHESIVES & SEALANTS MARKET, BY COUNTRY, NORTH AMERICA, VALUE, USD, 2017 - 2028
- Figure 126:
- GLOBAL CONSTRUCTION ADHESIVES & SEALANTS MARKET, BY COUNTRY, NORTH AMERICA, VOLUME SHARE(%), 2022 VS 2028
- Figure 127:
- GLOBAL CONSTRUCTION ADHESIVES & SEALANTS MARKET, BY COUNTRY, NORTH AMERICA, VALUE SHARE(%), 2022 VS 2028
- Figure 128:
- GLOBAL CONSTRUCTION ADHESIVES & SEALANTS MARKET, CANADA, VOLUME, TONS, 2017 - 2028
- Figure 129:
- GLOBAL CONSTRUCTION ADHESIVES & SEALANTS MARKET, CANADA, VALUE, USD, 2017 - 2028
- Figure 130:
- GLOBAL CONSTRUCTION ADHESIVES & SEALANTS MARKET, CANADA, BY TECHNOLOGY, VALUE SHARE (%), 2021 VS 2028
- Figure 131:
- GLOBAL CONSTRUCTION ADHESIVES & SEALANTS MARKET, MEXICO, VOLUME, TONS, 2017 - 2028
- Figure 132:
- GLOBAL CONSTRUCTION ADHESIVES & SEALANTS MARKET, MEXICO, VALUE, USD, 2017 - 2028
- Figure 133:
- GLOBAL CONSTRUCTION ADHESIVES & SEALANTS MARKET, MEXICO, BY TECHNOLOGY, VALUE SHARE (%), 2021 VS 2028
- Figure 134:
- GLOBAL CONSTRUCTION ADHESIVES & SEALANTS MARKET, UNITED STATES, VOLUME, TONS, 2017 - 2028
- Figure 135:
- GLOBAL CONSTRUCTION ADHESIVES & SEALANTS MARKET, UNITED STATES, VALUE, USD, 2017 - 2028
- Figure 136:
- GLOBAL CONSTRUCTION ADHESIVES & SEALANTS MARKET, UNITED STATES, BY TECHNOLOGY, VALUE SHARE (%), 2021 VS 2028
- Figure 137:
- GLOBAL CONSTRUCTION ADHESIVES & SEALANTS MARKET, REST OF NORTH AMERICA, VOLUME, TONS, 2017 - 2028
- Figure 138:
- GLOBAL CONSTRUCTION ADHESIVES & SEALANTS MARKET, REST OF NORTH AMERICA, VALUE, USD, 2017 - 2028
- Figure 139:
- GLOBAL CONSTRUCTION ADHESIVES & SEALANTS MARKET, REST OF NORTH AMERICA, BY TECHNOLOGY, VALUE SHARE (%), 2021 VS 2028
- Figure 140:
- GLOBAL CONSTRUCTION ADHESIVES & SEALANTS MARKET, BY COUNTRY, SOUTH AMERICA, VOLUME, TONS, 2017 - 2028
- Figure 141:
- GLOBAL CONSTRUCTION ADHESIVES & SEALANTS MARKET, BY COUNTRY, SOUTH AMERICA, VALUE, USD, 2017 - 2028
- Figure 142:
- GLOBAL CONSTRUCTION ADHESIVES & SEALANTS MARKET, BY COUNTRY, SOUTH AMERICA, VOLUME SHARE(%), 2022 VS 2028
- Figure 143:
- GLOBAL CONSTRUCTION ADHESIVES & SEALANTS MARKET, BY COUNTRY, SOUTH AMERICA, VALUE SHARE(%), 2022 VS 2028
- Figure 144:
- GLOBAL CONSTRUCTION ADHESIVES & SEALANTS MARKET, ARGENTINA, VOLUME, TONS, 2017 - 2028
- Figure 145:
- GLOBAL CONSTRUCTION ADHESIVES & SEALANTS MARKET, ARGENTINA, VALUE, USD, 2017 - 2028
- Figure 146:
- GLOBAL CONSTRUCTION ADHESIVES & SEALANTS MARKET, ARGENTINA, BY TECHNOLOGY, VALUE SHARE (%), 2021 VS 2028
- Figure 147:
- GLOBAL CONSTRUCTION ADHESIVES & SEALANTS MARKET, BRAZIL, VOLUME, TONS, 2017 - 2028
- Figure 148:
- GLOBAL CONSTRUCTION ADHESIVES & SEALANTS MARKET, BRAZIL, VALUE, USD, 2017 - 2028
- Figure 149:
- GLOBAL CONSTRUCTION ADHESIVES & SEALANTS MARKET, BRAZIL, BY TECHNOLOGY, VALUE SHARE (%), 2021 VS 2028
- Figure 150:
- GLOBAL CONSTRUCTION ADHESIVES & SEALANTS MARKET, REST OF SOUTH AMERICA, VOLUME, TONS, 2017 - 2028
- Figure 151:
- GLOBAL CONSTRUCTION ADHESIVES & SEALANTS MARKET, REST OF SOUTH AMERICA, VALUE, USD, 2017 - 2028
- Figure 152:
- GLOBAL CONSTRUCTION ADHESIVES & SEALANTS MARKET, REST OF SOUTH AMERICA, BY TECHNOLOGY, VALUE SHARE (%), 2021 VS 2028
- Figure 153:
- GLOBAL CONSTRUCTION ADHESIVES & SEALANTS MARKET, MOST ACTIVE COMPANIES, BY NUMBER OF STRATEGIC MOVES, 2019 - 2021
- Figure 154:
- GLOBAL CONSTRUCTION ADHESIVES & SEALANTS MARKET, MOST ADOPTED STRATEGIES, 2019 - 2021
- Figure 155:
- GLOBAL CONSTRUCTION ADHESIVES & SEALANTS MARKET SHARE(%), BY MAJOR PLAYERS REVENUE, 2021
Construction Adhesives & Sealants Industry Segmentation
Acrylic, Cyanoacrylate, Epoxy, Polyurethane, Silicone, VAE/EVA are covered as segments by Resin. Hot Melt, Reactive, Sealants, Solvent-borne, Water-borne are covered as segments by Technology. Asia-Pacific, Europe, Middle East & Africa, North America, South America are covered as segments by Region.| Resin | |
| Acrylic | |
| Cyanoacrylate | |
| Epoxy | |
| Polyurethane | |
| Silicone | |
| VAE/EVA | |
| Other Resins |
| Technology | |
| Hot Melt | |
| Reactive | |
| Sealants | |
| Solvent-borne | |
| Water-borne |
| Region | ||||||||||||
| ||||||||||||
| ||||||||||||
| ||||||||||||
| ||||||||||||
|
Market Definition
- End-user Industry - Residential construction, commercial construction, public buildings, industrial buildings and infrastructure projects are considered under the construction industry.
- Product - All adhesive and sealant products used in construction industry are considered in the market studied
- Resin - Under the scope of the study, resins like Polyurethane, Epoxy, Acrylic, Cyanoacrylate, VAE/EVA, and Silicone are considered
- Technology - For the purpose of this study, Water-borne, Solvent-borne, Reactive, Hot Melt, and Sealants technologies are taken into consideration.
Research Methodology
Mordor Intelligence follows a four-step methodology in all our reports.
- Step-1: Identify Key Variables: The quantifiable key variables (industry and extraneous) pertaining to the specific product segment and country are selected from a group of relevant variables & factors based on desk research & literature review; along with primary expert inputs. These variables are further confirmed through regression modeling (wherever required).
- Step-2: Build a Market Model: In order to build a robust forecasting methodology, the variables and factors identified in Step-1 are tested against available historical market numbers. Through an iterative process, the variables required for market forecast are set and the model is built on the basis of these variables.
- Step-3: Validate and Finalize: In this important step, all market numbers, variables and analyst calls are validated through an extensive network of primary research experts from the market studied. The respondents are selected across levels and functions to generate a holistic picture of the market studied.
- Step-4: Research Outputs: Syndicated Reports, Custom Consulting Assignments, Databases & Subscription Platforms


