Feed Mycotoxin Detoxifiers Market Size

| Icons | Lable | Value |
|---|---|---|
|
|
Study Period | 2017 - 2029 |
|
|
Base Year For Estimation | 2022 |
|
|
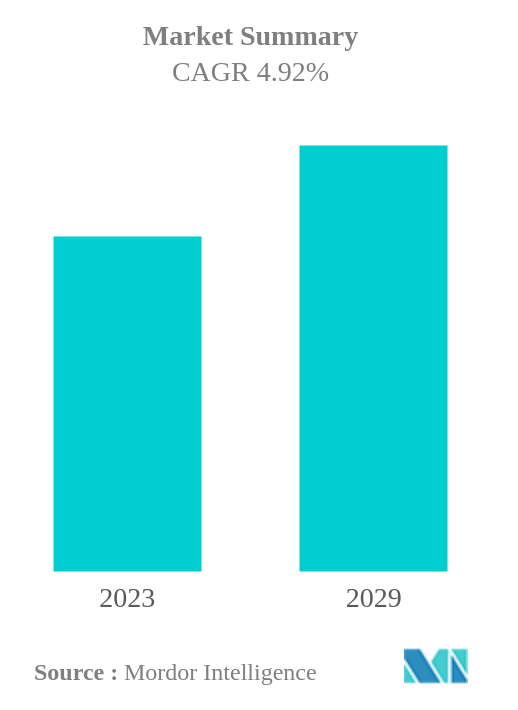
CAGR | 4.92 % |
|
|
Largest Share by Sub Additive | Binders |
|
|
Largest Share by Region | Asia-Pacific |
|
|
Market Concentration | High |
Major Players |
||
|
|
||
|
*Disclaimer: Major Players sorted in no particular order |
Feed Mycotoxin Detoxifiers Market Analysis
The Feed Mycotoxin Detoxifiers Market is projected to register a CAGR of 4.92%
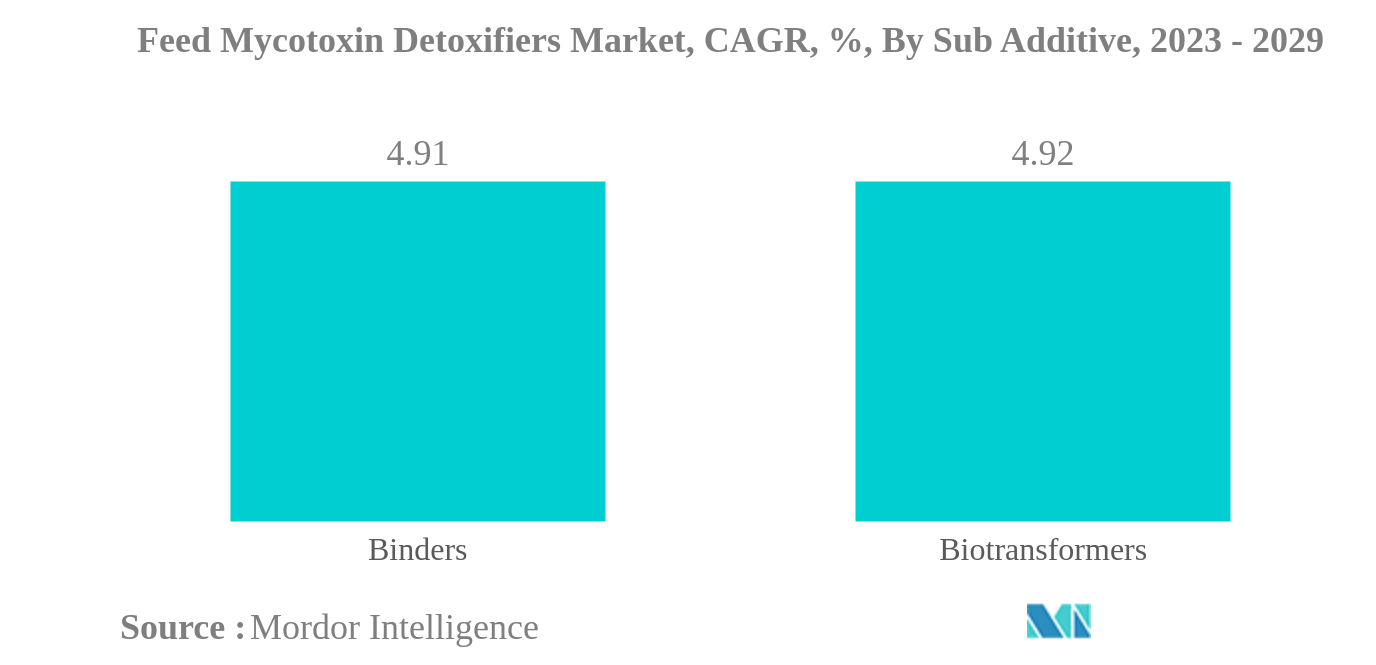
- Binders is the Largest Sub Additive: Binders have the largest share as they bind the harmful mycotoxins and provide resistance against animal diseases by resisting toxins from entering the bloodstream.
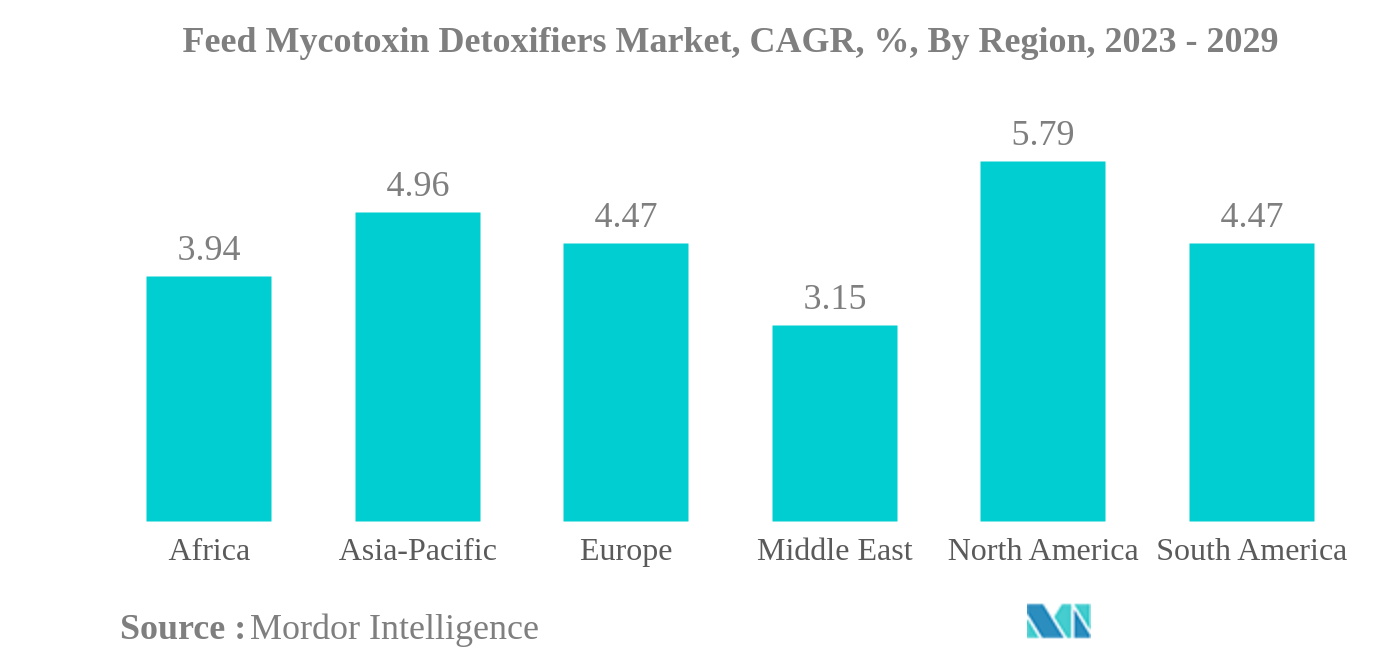
- Asia-Pacific is the Largest Region: Asia-Pacific is the largest region in the market due to increasing demand for livestock products, and growing concern for animal safety led to increased consumption.
- Biotransformers is the Fastest-growing Sub Additive: Biotransformers are the fastest-growing segment in the market due to increased awareness of preventing mycotoxin absorption and preserving nutritional properties.
- North America is the Fastest-growing Region: Globally, North America has the fastest growing rate due to higher demand for cereal and grains in animal feed, increased demand for beef meat and higher productivity.
Feed Mycotoxin Detoxifiers Market Trends
This section covers the major market trends shaping the Feed Mycotoxin Detoxifiers Market according to our research experts:
Binders is the largest Sub Additive
- In 2022, feed mycotoxin detoxifiers accounted for 6.2% of the global feed additives market in terms of value, as mycotoxins are a type of toxic fungus that can negatively impact animal health and growth when present in animal feed. Therefore, mycotoxin detoxifiers are used to reduce the impact of mycotoxins.
- The most significant feed mycotoxin detoxifiers are binders, which accounted for a market value of USD 1.4 billion in 2022. Binders are used to prevent toxic materials from entering the bloodstream and causing neurological disorders in animals and are favored for their low cost compared to other types of detoxifiers.
- As concerns around animal health are growing and animal farmers prefer high-quality feed, both mycotoxin binders and transformers are expected to register a CAGR of 4.9% during the forecast period. Asia-Pacific was the largest market for mycotoxin detoxifiers in 2022, accounting for 31.1% of the market share, followed by North America at 26.1% and Europe at 23.1% due to the higher feed production of 0.5 million metric tons and the larger animal population in the Asia-Pacific region.
- North America is expected to be the fastest-growing region in the mycotoxin detoxifiers market during the forecast period, with a projected CAGR of 5.8% due to the rising commercial cultivation of animals and concerns around animal health. Due to the usage of detoxifiers in animal feed containing cereals and grains, which are mostly consumed by animals, the global feed mycotoxin detoxifiers market is expected to record a CAGR of 4.9% during 2023-2029.
- Therefore, the global mycotoxin detoxifier market is expected to grow during the forecast period due to the rising concerns about animal health and the need for safer animal feed.
Asia-Pacific is the largest Region
- The global market for feed mycotoxin detoxifiers is largely dominated by the Asia-Pacific region, which accounted for USD 636.7 million in 2022, increasing by more than 45.3% during 2019-2022. The primary reason for this growth is the increasing demand for livestock products and the growing concern for animal safety, which led to increased consumption of these detoxifiers.
- The Asia-Pacific market is expected to continue to be the fastest-growing market globally, with a projected CAGR of 5.0% during the forecast period. This growth is due to factors such as increased livestock farming and feed production in the region. In 2022, the region had 17.11 billion animals, accounting for 42.6% of the global share, and feed production stood at 502.7 million metric tons, holding 40.2% of the global share.
- China, India, Australia, and Japan are the key drivers of the market in the Asia-Pacific region. North America and Europe are also major regions, accounting for 26.3% and 23.0% of the global market share, respectively. In these regions, animal feed production has increased significantly, particularly in North America, by 30.2% from 215.5 million metric tons in 2017.
- The United States and China are the two countries with the largest market share, accounting for 18.3% and 13.8%, respectively, in 2022. These countries have high global feed production volumes and trade activities.
- The expanding feed industry and the rising consumption of animal-based products such as dairy, eggs, and meat are driving the feed mycotoxin detoxifiers market. With the growing awareness of the benefits of these detoxifiers among farmers, the market is expected to continue to register a CAGR of 4.9% during the forecast period.
Feed Mycotoxin Detoxifiers Industry Overview
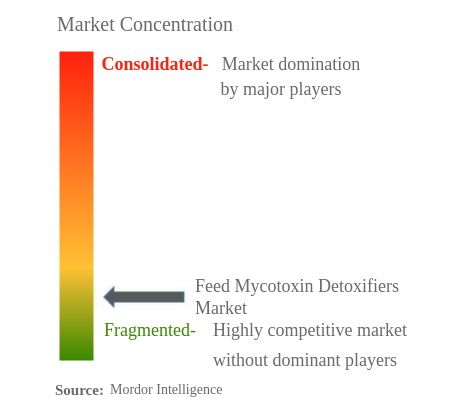
The Feed Mycotoxin Detoxifiers Market is fragmented, with the top five companies occupying 26.48%. The major players in this market are Adisseo, Alltech, Inc., BASF SE, Brenntag SE and Cargill Inc. (sorted alphabetically).
Feed Mycotoxin Detoxifiers Market Leaders
Adisseo
Alltech, Inc.
BASF SE
Brenntag SE
Cargill Inc.
*Disclaimer: Major Players sorted in no particular order
Feed Mycotoxin Detoxifiers Market News
- November 2022: Kemin Industries introduced Toxfin Care, a solution that protects feed from mycotoxins. It strengthens the immune system, protects organs, and prevents loss of performance and productivity.
- July 2022: Impextraco expanded its Mexico facility to improve product storage spaces and business opportunities and promoted the Impextraco brand's presence in the country.
- July 2022: Cargill has extended its partnership with Innovafeed to provide aquafarmers with innovative and nutritious ingredients, including additives.
Feed Mycotoxin Detoxifiers Market Report - Table of Contents
1. INTRODUCTION
1.1. Study Assumptions & Market Definition
1.2. Scope of the Study
1.3. Research Methodology
2. KEY INDUSTRY TRENDS
2.1. Animal Headcount
2.2. Feed Production
2.3. Regulatory Framework
2.4. Value Chain & Distribution Channel Analysis
3. MARKET SEGMENTATION
3.1. Sub Additive
3.1.1. Binders
3.1.2. Biotransformers
3.2. Animal
3.2.1. Aquaculture
3.2.1.1. By Sub Animal
3.2.1.1.1. Fish
3.2.1.1.2. Shrimp
3.2.1.1.3. Other Aquaculture Species
3.2.2. Poultry
3.2.2.1. By Sub Animal
3.2.2.1.1. Broiler
3.2.2.1.2. Layer
3.2.2.1.3. Other Poultry Birds
3.2.3. Ruminants
3.2.3.1. By Sub Animal
3.2.3.1.1. Beef Cattle
3.2.3.1.2. Dairy Cattle
3.2.3.1.3. Other Ruminants
3.2.4. Swine
3.2.5. Other Animals
3.3. Region
3.3.1. Africa
3.3.1.1. By Country
3.3.1.1.1. Egypt
3.3.1.1.2. Kenya
3.3.1.1.3. South Africa
3.3.1.1.4. Rest of Africa
3.3.2. Asia-Pacific
3.3.2.1. By Country
3.3.2.1.1. Australia
3.3.2.1.2. China
3.3.2.1.3. India
3.3.2.1.4. Indonesia
3.3.2.1.5. Japan
3.3.2.1.6. Philippines
3.3.2.1.7. South Korea
3.3.2.1.8. Thailand
3.3.2.1.9. Vietnam
3.3.2.1.10. Rest of Asia-Pacific
3.3.3. Europe
3.3.3.1. By Country
3.3.3.1.1. France
3.3.3.1.2. Germany
3.3.3.1.3. Italy
3.3.3.1.4. Netherlands
3.3.3.1.5. Russia
3.3.3.1.6. Spain
3.3.3.1.7. Turkey
3.3.3.1.8. United Kingdom
3.3.3.1.9. Rest of Europe
3.3.4. Middle East
3.3.4.1. By Country
3.3.4.1.1. Iran
3.3.4.1.2. Saudi Arabia
3.3.4.1.3. Rest of Middle East
3.3.5. North America
3.3.5.1. By Country
3.3.5.1.1. Canada
3.3.5.1.2. Mexico
3.3.5.1.3. United States
3.3.5.1.4. Rest of North America
3.3.6. South America
3.3.6.1. By Country
3.3.6.1.1. Argentina
3.3.6.1.2. Brazil
3.3.6.1.3. Chile
3.3.6.1.4. Rest of South America
4. COMPETITIVE LANDSCAPE
4.1. Key Strategic Moves
4.2. Market Share Analysis
4.3. Company Landscape
4.4. Company Profiles
4.4.1. Adisseo
4.4.2. Alltech, Inc.
4.4.3. BASF SE
4.4.4. Brenntag SE
4.4.5. Cargill Inc.
4.4.6. EW Nutrition
4.4.7. Impextraco NV
4.4.8. Kemin Industries
4.4.9. SHV (Nutreco NV)
4.4.10. Special Nutrients
5. KEY STRATEGIC QUESTIONS FOR FEED ADDITIVE CEOS
6. APPENDIX
6.1. Global Overview
6.1.1. Overview
6.1.2. Porter’s Five Forces Framework
6.1.3. Global Value Chain Analysis
6.1.4. Global Market Size and DROs
6.2. Sources & References
6.3. List of Tables & Figures
6.4. Primary Insights
6.5. Data Pack
6.6. Glossary of Terms
List of Tables & Figures
- Figure 1:
- GLOBAL FEED MYCOTOXIN DETOXIFIERS MARKET, ANIMAL HEAD COUNT, NUMBER, BY POULTRY, 2017-2022
- Figure 2:
- GLOBAL FEED MYCOTOXIN DETOXIFIERS MARKET, ANIMAL HEAD COUNT, NUMBER, BY RUMINANTS, 2017-2022
- Figure 3:
- GLOBAL FEED MYCOTOXIN DETOXIFIERS MARKET, ANIMAL HEAD COUNT, NUMBER, BY SWINE, 2017-2022
- Figure 4:
- GLOBAL FEED MYCOTOXIN DETOXIFIERS MARKET, FEED PRODUCTION, METRIC TON, BY AQUACULTURE, 2017-2022
- Figure 5:
- GLOBAL FEED MYCOTOXIN DETOXIFIERS MARKET, FEED PRODUCTION, METRIC TON, BY POULTRY, 2017-2022
- Figure 6:
- GLOBAL FEED MYCOTOXIN DETOXIFIERS MARKET, FEED PRODUCTION, METRIC TON, BY RUMINANTS, 2017-2022
- Figure 7:
- GLOBAL FEED MYCOTOXIN DETOXIFIERS MARKET, FEED PRODUCTION, METRIC TON, BY SWINE, 2017-2022
- Figure 8:
- GLOBAL FEED MYCOTOXIN DETOXIFIERS MARKET, VOLUME, METRIC TON, 2017 - 2029
- Figure 9:
- GLOBAL FEED MYCOTOXIN DETOXIFIERS MARKET, VALUE, USD, 2017 - 2029
- Figure 10:
- GLOBAL FEED MYCOTOXIN DETOXIFIERS MARKET, BY SUB ADDITIVE, VOLUME, METRIC TON, 2017 - 2029
- Figure 11:
- GLOBAL FEED MYCOTOXIN DETOXIFIERS MARKET, BY SUB ADDITIVE, VALUE, USD, 2017 - 2029
- Figure 12:
- GLOBAL FEED MYCOTOXIN DETOXIFIERS MARKET, VOLUME SHARE(%), BY SUB ADDITIVE, 2017 - 2029
- Figure 13:
- GLOBAL FEED MYCOTOXIN DETOXIFIERS MARKET, VALUE SHARE(%), BY SUB ADDITIVE, 2017 - 2029
- Figure 14:
- GLOBAL FEED MYCOTOXIN DETOXIFIERS MARKET, BY SUB ADDITIVE, VOLUME, METRIC TON, 2017 - 2029
- Figure 15:
- GLOBAL FEED MYCOTOXIN DETOXIFIERS MARKET, BY SUB ADDITIVE, VALUE, USD, 2017 - 2029
- Figure 16:
- GLOBAL FEED MYCOTOXIN DETOXIFIERS MARKET, VALUE SHARE(%), BY ANIMAL, 2022 - 2029
- Figure 17:
- GLOBAL FEED MYCOTOXIN DETOXIFIERS MARKET, BY SUB ADDITIVE, VOLUME, METRIC TON, 2017 - 2029
- Figure 18:
- GLOBAL FEED MYCOTOXIN DETOXIFIERS MARKET, BY SUB ADDITIVE, VALUE, USD, 2017 - 2029
- Figure 19:
- GLOBAL FEED MYCOTOXIN DETOXIFIERS MARKET, VALUE SHARE(%), BY ANIMAL, 2022 - 2029
- Figure 20:
- GLOBAL FEED MYCOTOXIN DETOXIFIERS MARKET, BY ANIMAL, VOLUME, METRIC TON, 2017 - 2029
- Figure 21:
- GLOBAL FEED MYCOTOXIN DETOXIFIERS MARKET, BY ANIMAL, VALUE, USD, 2017 - 2029
- Figure 22:
- GLOBAL FEED MYCOTOXIN DETOXIFIERS MARKET, VOLUME SHARE(%), BY ANIMAL, 2017 - 2029
- Figure 23:
- GLOBAL FEED MYCOTOXIN DETOXIFIERS MARKET, VALUE SHARE(%), BY ANIMAL, 2017 - 2029
- Figure 24:
- GLOBAL FEED MYCOTOXIN DETOXIFIERS MARKET, BY SUB ANIMAL, VOLUME, METRIC TON, 2017 - 2029
- Figure 25:
- GLOBAL FEED MYCOTOXIN DETOXIFIERS MARKET, BY SUB ANIMAL, VALUE, USD, 2017 - 2029
- Figure 26:
- GLOBAL FEED MYCOTOXIN DETOXIFIERS MARKET, VOLUME SHARE(%), BY SUB ANIMAL, 2017 - 2029
- Figure 27:
- GLOBAL FEED MYCOTOXIN DETOXIFIERS MARKET, VALUE SHARE(%), BY SUB ANIMAL, 2017 - 2029
- Figure 28:
- GLOBAL FEED MYCOTOXIN DETOXIFIERS MARKET, BY SUB ANIMAL, VOLUME, METRIC TON, 2017 - 2029
- Figure 29:
- GLOBAL FEED MYCOTOXIN DETOXIFIERS MARKET, BY SUB ANIMAL, VALUE, USD, 2017 - 2029
- Figure 30:
- GLOBAL FEED MYCOTOXIN DETOXIFIERS MARKET, VALUE SHARE(%), BY SUB ADDITIVE, 2022 - 2029
- Figure 31:
- GLOBAL FEED MYCOTOXIN DETOXIFIERS MARKET, BY SUB ANIMAL, VOLUME, METRIC TON, 2017 - 2029
- Figure 32:
- GLOBAL FEED MYCOTOXIN DETOXIFIERS MARKET, BY SUB ANIMAL, VALUE, USD, 2017 - 2029
- Figure 33:
- GLOBAL FEED MYCOTOXIN DETOXIFIERS MARKET, VALUE SHARE(%), BY SUB ADDITIVE, 2022 - 2029
- Figure 34:
- GLOBAL FEED MYCOTOXIN DETOXIFIERS MARKET, BY SUB ANIMAL, VOLUME, METRIC TON, 2017 - 2029
- Figure 35:
- GLOBAL FEED MYCOTOXIN DETOXIFIERS MARKET, BY SUB ANIMAL, VALUE, USD, 2017 - 2029
- Figure 36:
- GLOBAL FEED MYCOTOXIN DETOXIFIERS MARKET, VALUE SHARE(%), BY SUB ADDITIVE, 2022 - 2029
- Figure 37:
- GLOBAL FEED MYCOTOXIN DETOXIFIERS MARKET, BY SUB ANIMAL, VOLUME, METRIC TON, 2017 - 2029
- Figure 38:
- GLOBAL FEED MYCOTOXIN DETOXIFIERS MARKET, BY SUB ANIMAL, VALUE, USD, 2017 - 2029
- Figure 39:
- GLOBAL FEED MYCOTOXIN DETOXIFIERS MARKET, VOLUME SHARE(%), BY SUB ANIMAL, 2017 - 2029
- Figure 40:
- GLOBAL FEED MYCOTOXIN DETOXIFIERS MARKET, VALUE SHARE(%), BY SUB ANIMAL, 2017 - 2029
- Figure 41:
- GLOBAL FEED MYCOTOXIN DETOXIFIERS MARKET, BY SUB ANIMAL, VOLUME, METRIC TON, 2017 - 2029
- Figure 42:
- GLOBAL FEED MYCOTOXIN DETOXIFIERS MARKET, BY SUB ANIMAL, VALUE, USD, 2017 - 2029
- Figure 43:
- GLOBAL FEED MYCOTOXIN DETOXIFIERS MARKET, VALUE SHARE(%), BY SUB ADDITIVE, 2022 - 2029
- Figure 44:
- GLOBAL FEED MYCOTOXIN DETOXIFIERS MARKET, BY SUB ANIMAL, VOLUME, METRIC TON, 2017 - 2029
- Figure 45:
- GLOBAL FEED MYCOTOXIN DETOXIFIERS MARKET, BY SUB ANIMAL, VALUE, USD, 2017 - 2029
- Figure 46:
- GLOBAL FEED MYCOTOXIN DETOXIFIERS MARKET, VALUE SHARE(%), BY SUB ADDITIVE, 2022 - 2029
- Figure 47:
- GLOBAL FEED MYCOTOXIN DETOXIFIERS MARKET, BY SUB ANIMAL, VOLUME, METRIC TON, 2017 - 2029
- Figure 48:
- GLOBAL FEED MYCOTOXIN DETOXIFIERS MARKET, BY SUB ANIMAL, VALUE, USD, 2017 - 2029
- Figure 49:
- GLOBAL FEED MYCOTOXIN DETOXIFIERS MARKET, VALUE SHARE(%), BY SUB ADDITIVE, 2022 - 2029
- Figure 50:
- GLOBAL FEED MYCOTOXIN DETOXIFIERS MARKET, BY SUB ANIMAL, VOLUME, METRIC TON, 2017 - 2029
- Figure 51:
- GLOBAL FEED MYCOTOXIN DETOXIFIERS MARKET, BY SUB ANIMAL, VALUE, USD, 2017 - 2029
- Figure 52:
- GLOBAL FEED MYCOTOXIN DETOXIFIERS MARKET, VOLUME SHARE(%), BY SUB ANIMAL, 2017 - 2029
- Figure 53:
- GLOBAL FEED MYCOTOXIN DETOXIFIERS MARKET, VALUE SHARE(%), BY SUB ANIMAL, 2017 - 2029
- Figure 54:
- GLOBAL FEED MYCOTOXIN DETOXIFIERS MARKET, BY SUB ANIMAL, VOLUME, METRIC TON, 2017 - 2029
- Figure 55:
- GLOBAL FEED MYCOTOXIN DETOXIFIERS MARKET, BY SUB ANIMAL, VALUE, USD, 2017 - 2029
- Figure 56:
- GLOBAL FEED MYCOTOXIN DETOXIFIERS MARKET, VALUE SHARE(%), BY SUB ADDITIVE, 2022 - 2029
- Figure 57:
- GLOBAL FEED MYCOTOXIN DETOXIFIERS MARKET, BY SUB ANIMAL, VOLUME, METRIC TON, 2017 - 2029
- Figure 58:
- GLOBAL FEED MYCOTOXIN DETOXIFIERS MARKET, BY SUB ANIMAL, VALUE, USD, 2017 - 2029
- Figure 59:
- GLOBAL FEED MYCOTOXIN DETOXIFIERS MARKET, VALUE SHARE(%), BY SUB ADDITIVE, 2022 - 2029
- Figure 60:
- GLOBAL FEED MYCOTOXIN DETOXIFIERS MARKET, BY SUB ANIMAL, VOLUME, METRIC TON, 2017 - 2029
- Figure 61:
- GLOBAL FEED MYCOTOXIN DETOXIFIERS MARKET, BY SUB ANIMAL, VALUE, USD, 2017 - 2029
- Figure 62:
- GLOBAL FEED MYCOTOXIN DETOXIFIERS MARKET, VALUE SHARE(%), BY SUB ADDITIVE, 2022 - 2029
- Figure 63:
- GLOBAL FEED MYCOTOXIN DETOXIFIERS MARKET, BY ANIMAL, VOLUME, METRIC TON, 2017 - 2029
- Figure 64:
- GLOBAL FEED MYCOTOXIN DETOXIFIERS MARKET, BY ANIMAL, VALUE, USD, 2017 - 2029
- Figure 65:
- GLOBAL FEED MYCOTOXIN DETOXIFIERS MARKET, VALUE SHARE(%), BY SUB ADDITIVE, 2022 - 2029
- Figure 66:
- GLOBAL FEED MYCOTOXIN DETOXIFIERS MARKET, BY ANIMAL, VOLUME, METRIC TON, 2017 - 2029
- Figure 67:
- GLOBAL FEED MYCOTOXIN DETOXIFIERS MARKET, BY ANIMAL, VALUE, USD, 2017 - 2029
- Figure 68:
- GLOBAL FEED MYCOTOXIN DETOXIFIERS MARKET, VALUE SHARE(%), BY SUB ADDITIVE, 2022 - 2029
- Figure 69:
- GLOBAL FEED MYCOTOXIN DETOXIFIERS MARKET, BY REGION, VOLUME, METRIC TON, 2017 - 2029
- Figure 70:
- GLOBAL FEED MYCOTOXIN DETOXIFIERS MARKET, BY REGION, VALUE, USD, 2017 - 2029
- Figure 71:
- GLOBAL FEED MYCOTOXIN DETOXIFIERS MARKET, VOLUME SHARE(%), BY REGION, 2017 - 2029
- Figure 72:
- GLOBAL FEED MYCOTOXIN DETOXIFIERS MARKET, VALUE SHARE(%), BY REGION, 2017 - 2029
- Figure 73:
- GLOBAL FEED MYCOTOXIN DETOXIFIERS MARKET, BY COUNTRY, VOLUME, METRIC TON, 2017 - 2029
- Figure 74:
- GLOBAL FEED MYCOTOXIN DETOXIFIERS MARKET, BY COUNTRY, VALUE, USD, 2017 - 2029
- Figure 75:
- GLOBAL FEED MYCOTOXIN DETOXIFIERS MARKET, VOLUME SHARE(%), BY COUNTRY, 2017 - 2029
- Figure 76:
- GLOBAL FEED MYCOTOXIN DETOXIFIERS MARKET, VALUE SHARE(%), BY COUNTRY, 2017 - 2029
- Figure 77:
- GLOBAL FEED MYCOTOXIN DETOXIFIERS MARKET, BY COUNTRY, VOLUME, METRIC TON, 2017 - 2029
- Figure 78:
- GLOBAL FEED MYCOTOXIN DETOXIFIERS MARKET, BY COUNTRY, VALUE, USD, 2017 - 2029
- Figure 79:
- GLOBAL FEED MYCOTOXIN DETOXIFIERS MARKET, VALUE SHARE(%), BY SUB ADDITIVE, 2022 - 2029
- Figure 80:
- GLOBAL FEED MYCOTOXIN DETOXIFIERS MARKET, BY COUNTRY, VOLUME, METRIC TON, 2017 - 2029
- Figure 81:
- GLOBAL FEED MYCOTOXIN DETOXIFIERS MARKET, BY COUNTRY, VALUE, USD, 2017 - 2029
- Figure 82:
- GLOBAL FEED MYCOTOXIN DETOXIFIERS MARKET, VALUE SHARE(%), BY SUB ADDITIVE, 2022 - 2029
- Figure 83:
- GLOBAL FEED MYCOTOXIN DETOXIFIERS MARKET, BY COUNTRY, VOLUME, METRIC TON, 2017 - 2029
- Figure 84:
- GLOBAL FEED MYCOTOXIN DETOXIFIERS MARKET, BY COUNTRY, VALUE, USD, 2017 - 2029
- Figure 85:
- GLOBAL FEED MYCOTOXIN DETOXIFIERS MARKET, VALUE SHARE(%), BY SUB ADDITIVE, 2022 - 2029
- Figure 86:
- GLOBAL FEED MYCOTOXIN DETOXIFIERS MARKET, BY COUNTRY, VOLUME, METRIC TON, 2017 - 2029
- Figure 87:
- GLOBAL FEED MYCOTOXIN DETOXIFIERS MARKET, BY COUNTRY, VALUE, USD, 2017 - 2029
- Figure 88:
- GLOBAL FEED MYCOTOXIN DETOXIFIERS MARKET, VALUE SHARE(%), BY SUB ADDITIVE, 2022 - 2029
- Figure 89:
- GLOBAL FEED MYCOTOXIN DETOXIFIERS MARKET, BY COUNTRY, VOLUME, METRIC TON, 2017 - 2029
- Figure 90:
- GLOBAL FEED MYCOTOXIN DETOXIFIERS MARKET, BY COUNTRY, VALUE, USD, 2017 - 2029
- Figure 91:
- GLOBAL FEED MYCOTOXIN DETOXIFIERS MARKET, VOLUME SHARE(%), BY COUNTRY, 2017 - 2029
- Figure 92:
- GLOBAL FEED MYCOTOXIN DETOXIFIERS MARKET, VALUE SHARE(%), BY COUNTRY, 2017 - 2029
- Figure 93:
- GLOBAL FEED MYCOTOXIN DETOXIFIERS MARKET, BY COUNTRY, VOLUME, METRIC TON, 2017 - 2029
- Figure 94:
- GLOBAL FEED MYCOTOXIN DETOXIFIERS MARKET, BY COUNTRY, VALUE, USD, 2017 - 2029
- Figure 95:
- GLOBAL FEED MYCOTOXIN DETOXIFIERS MARKET, VALUE SHARE(%), BY SUB ADDITIVE, 2022 - 2029
- Figure 96:
- GLOBAL FEED MYCOTOXIN DETOXIFIERS MARKET, BY COUNTRY, VOLUME, METRIC TON, 2017 - 2029
- Figure 97:
- GLOBAL FEED MYCOTOXIN DETOXIFIERS MARKET, BY COUNTRY, VALUE, USD, 2017 - 2029
- Figure 98:
- GLOBAL FEED MYCOTOXIN DETOXIFIERS MARKET, VALUE SHARE(%), BY SUB ADDITIVE, 2022 - 2029
- Figure 99:
- GLOBAL FEED MYCOTOXIN DETOXIFIERS MARKET, BY COUNTRY, VOLUME, METRIC TON, 2017 - 2029
- Figure 100:
- GLOBAL FEED MYCOTOXIN DETOXIFIERS MARKET, BY COUNTRY, VALUE, USD, 2017 - 2029
- Figure 101:
- GLOBAL FEED MYCOTOXIN DETOXIFIERS MARKET, VALUE SHARE(%), BY SUB ADDITIVE, 2022 - 2029
- Figure 102:
- GLOBAL FEED MYCOTOXIN DETOXIFIERS MARKET, BY COUNTRY, VOLUME, METRIC TON, 2017 - 2029
- Figure 103:
- GLOBAL FEED MYCOTOXIN DETOXIFIERS MARKET, BY COUNTRY, VALUE, USD, 2017 - 2029
- Figure 104:
- GLOBAL FEED MYCOTOXIN DETOXIFIERS MARKET, VALUE SHARE(%), BY SUB ADDITIVE, 2022 - 2029
- Figure 105:
- GLOBAL FEED MYCOTOXIN DETOXIFIERS MARKET, BY COUNTRY, VOLUME, METRIC TON, 2017 - 2029
- Figure 106:
- GLOBAL FEED MYCOTOXIN DETOXIFIERS MARKET, BY COUNTRY, VALUE, USD, 2017 - 2029
- Figure 107:
- GLOBAL FEED MYCOTOXIN DETOXIFIERS MARKET, VALUE SHARE(%), BY SUB ADDITIVE, 2022 - 2029
- Figure 108:
- GLOBAL FEED MYCOTOXIN DETOXIFIERS MARKET, BY COUNTRY, VOLUME, METRIC TON, 2017 - 2029
- Figure 109:
- GLOBAL FEED MYCOTOXIN DETOXIFIERS MARKET, BY COUNTRY, VALUE, USD, 2017 - 2029
- Figure 110:
- GLOBAL FEED MYCOTOXIN DETOXIFIERS MARKET, VALUE SHARE(%), BY SUB ADDITIVE, 2022 - 2029
- Figure 111:
- GLOBAL FEED MYCOTOXIN DETOXIFIERS MARKET, BY COUNTRY, VOLUME, METRIC TON, 2017 - 2029
- Figure 112:
- GLOBAL FEED MYCOTOXIN DETOXIFIERS MARKET, BY COUNTRY, VALUE, USD, 2017 - 2029
- Figure 113:
- GLOBAL FEED MYCOTOXIN DETOXIFIERS MARKET, VALUE SHARE(%), BY SUB ADDITIVE, 2022 - 2029
- Figure 114:
- GLOBAL FEED MYCOTOXIN DETOXIFIERS MARKET, BY COUNTRY, VOLUME, METRIC TON, 2017 - 2029
- Figure 115:
- GLOBAL FEED MYCOTOXIN DETOXIFIERS MARKET, BY COUNTRY, VALUE, USD, 2017 - 2029
- Figure 116:
- GLOBAL FEED MYCOTOXIN DETOXIFIERS MARKET, VALUE SHARE(%), BY SUB ADDITIVE, 2022 - 2029
- Figure 117:
- GLOBAL FEED MYCOTOXIN DETOXIFIERS MARKET, BY COUNTRY, VOLUME, METRIC TON, 2017 - 2029
- Figure 118:
- GLOBAL FEED MYCOTOXIN DETOXIFIERS MARKET, BY COUNTRY, VALUE, USD, 2017 - 2029
- Figure 119:
- GLOBAL FEED MYCOTOXIN DETOXIFIERS MARKET, VALUE SHARE(%), BY SUB ADDITIVE, 2022 - 2029
- Figure 120:
- GLOBAL FEED MYCOTOXIN DETOXIFIERS MARKET, BY COUNTRY, VOLUME, METRIC TON, 2017 - 2029
- Figure 121:
- GLOBAL FEED MYCOTOXIN DETOXIFIERS MARKET, BY COUNTRY, VALUE, USD, 2017 - 2029
- Figure 122:
- GLOBAL FEED MYCOTOXIN DETOXIFIERS MARKET, VALUE SHARE(%), BY SUB ADDITIVE, 2022 - 2029
- Figure 123:
- GLOBAL FEED MYCOTOXIN DETOXIFIERS MARKET, BY COUNTRY, VOLUME, METRIC TON, 2017 - 2029
- Figure 124:
- GLOBAL FEED MYCOTOXIN DETOXIFIERS MARKET, BY COUNTRY, VALUE, USD, 2017 - 2029
- Figure 125:
- GLOBAL FEED MYCOTOXIN DETOXIFIERS MARKET, VOLUME SHARE(%), BY COUNTRY, 2017 - 2029
- Figure 126:
- GLOBAL FEED MYCOTOXIN DETOXIFIERS MARKET, VALUE SHARE(%), BY COUNTRY, 2017 - 2029
- Figure 127:
- GLOBAL FEED MYCOTOXIN DETOXIFIERS MARKET, BY COUNTRY, VOLUME, METRIC TON, 2017 - 2029
- Figure 128:
- GLOBAL FEED MYCOTOXIN DETOXIFIERS MARKET, BY COUNTRY, VALUE, USD, 2017 - 2029
- Figure 129:
- GLOBAL FEED MYCOTOXIN DETOXIFIERS MARKET, VALUE SHARE(%), BY SUB ADDITIVE, 2022 - 2029
- Figure 130:
- GLOBAL FEED MYCOTOXIN DETOXIFIERS MARKET, BY COUNTRY, VOLUME, METRIC TON, 2017 - 2029
- Figure 131:
- GLOBAL FEED MYCOTOXIN DETOXIFIERS MARKET, BY COUNTRY, VALUE, USD, 2017 - 2029
- Figure 132:
- GLOBAL FEED MYCOTOXIN DETOXIFIERS MARKET, VALUE SHARE(%), BY SUB ADDITIVE, 2022 - 2029
- Figure 133:
- GLOBAL FEED MYCOTOXIN DETOXIFIERS MARKET, BY COUNTRY, VOLUME, METRIC TON, 2017 - 2029
- Figure 134:
- GLOBAL FEED MYCOTOXIN DETOXIFIERS MARKET, BY COUNTRY, VALUE, USD, 2017 - 2029
- Figure 135:
- GLOBAL FEED MYCOTOXIN DETOXIFIERS MARKET, VALUE SHARE(%), BY SUB ADDITIVE, 2022 - 2029
- Figure 136:
- GLOBAL FEED MYCOTOXIN DETOXIFIERS MARKET, BY COUNTRY, VOLUME, METRIC TON, 2017 - 2029
- Figure 137:
- GLOBAL FEED MYCOTOXIN DETOXIFIERS MARKET, BY COUNTRY, VALUE, USD, 2017 - 2029
- Figure 138:
- GLOBAL FEED MYCOTOXIN DETOXIFIERS MARKET, VALUE SHARE(%), BY SUB ADDITIVE, 2022 - 2029
- Figure 139:
- GLOBAL FEED MYCOTOXIN DETOXIFIERS MARKET, BY COUNTRY, VOLUME, METRIC TON, 2017 - 2029
- Figure 140:
- GLOBAL FEED MYCOTOXIN DETOXIFIERS MARKET, BY COUNTRY, VALUE, USD, 2017 - 2029
- Figure 141:
- GLOBAL FEED MYCOTOXIN DETOXIFIERS MARKET, VALUE SHARE(%), BY SUB ADDITIVE, 2022 - 2029
- Figure 142:
- GLOBAL FEED MYCOTOXIN DETOXIFIERS MARKET, BY COUNTRY, VOLUME, METRIC TON, 2017 - 2029
- Figure 143:
- GLOBAL FEED MYCOTOXIN DETOXIFIERS MARKET, BY COUNTRY, VALUE, USD, 2017 - 2029
- Figure 144:
- GLOBAL FEED MYCOTOXIN DETOXIFIERS MARKET, VALUE SHARE(%), BY SUB ADDITIVE, 2022 - 2029
- Figure 145:
- GLOBAL FEED MYCOTOXIN DETOXIFIERS MARKET, BY COUNTRY, VOLUME, METRIC TON, 2017 - 2029
- Figure 146:
- GLOBAL FEED MYCOTOXIN DETOXIFIERS MARKET, BY COUNTRY, VALUE, USD, 2017 - 2029
- Figure 147:
- GLOBAL FEED MYCOTOXIN DETOXIFIERS MARKET, VALUE SHARE(%), BY SUB ADDITIVE, 2022 - 2029
- Figure 148:
- GLOBAL FEED MYCOTOXIN DETOXIFIERS MARKET, BY COUNTRY, VOLUME, METRIC TON, 2017 - 2029
- Figure 149:
- GLOBAL FEED MYCOTOXIN DETOXIFIERS MARKET, BY COUNTRY, VALUE, USD, 2017 - 2029
- Figure 150:
- GLOBAL FEED MYCOTOXIN DETOXIFIERS MARKET, VALUE SHARE(%), BY SUB ADDITIVE, 2022 - 2029
- Figure 151:
- GLOBAL FEED MYCOTOXIN DETOXIFIERS MARKET, BY COUNTRY, VOLUME, METRIC TON, 2017 - 2029
- Figure 152:
- GLOBAL FEED MYCOTOXIN DETOXIFIERS MARKET, BY COUNTRY, VALUE, USD, 2017 - 2029
- Figure 153:
- GLOBAL FEED MYCOTOXIN DETOXIFIERS MARKET, VALUE SHARE(%), BY SUB ADDITIVE, 2022 - 2029
- Figure 154:
- GLOBAL FEED MYCOTOXIN DETOXIFIERS MARKET, BY COUNTRY, VOLUME, METRIC TON, 2017 - 2029
- Figure 155:
- GLOBAL FEED MYCOTOXIN DETOXIFIERS MARKET, BY COUNTRY, VALUE, USD, 2017 - 2029
- Figure 156:
- GLOBAL FEED MYCOTOXIN DETOXIFIERS MARKET, VOLUME SHARE(%), BY COUNTRY, 2017 - 2029
- Figure 157:
- GLOBAL FEED MYCOTOXIN DETOXIFIERS MARKET, VALUE SHARE(%), BY COUNTRY, 2017 - 2029
- Figure 158:
- GLOBAL FEED MYCOTOXIN DETOXIFIERS MARKET, BY COUNTRY, VOLUME, METRIC TON, 2017 - 2029
- Figure 159:
- GLOBAL FEED MYCOTOXIN DETOXIFIERS MARKET, BY COUNTRY, VALUE, USD, 2017 - 2029
- Figure 160:
- GLOBAL FEED MYCOTOXIN DETOXIFIERS MARKET, VALUE SHARE(%), BY SUB ADDITIVE, 2022 - 2029
- Figure 161:
- GLOBAL FEED MYCOTOXIN DETOXIFIERS MARKET, BY COUNTRY, VOLUME, METRIC TON, 2017 - 2029
- Figure 162:
- GLOBAL FEED MYCOTOXIN DETOXIFIERS MARKET, BY COUNTRY, VALUE, USD, 2017 - 2029
- Figure 163:
- GLOBAL FEED MYCOTOXIN DETOXIFIERS MARKET, VALUE SHARE(%), BY SUB ADDITIVE, 2022 - 2029
- Figure 164:
- GLOBAL FEED MYCOTOXIN DETOXIFIERS MARKET, BY COUNTRY, VOLUME, METRIC TON, 2017 - 2029
- Figure 165:
- GLOBAL FEED MYCOTOXIN DETOXIFIERS MARKET, BY COUNTRY, VALUE, USD, 2017 - 2029
- Figure 166:
- GLOBAL FEED MYCOTOXIN DETOXIFIERS MARKET, VALUE SHARE(%), BY SUB ADDITIVE, 2022 - 2029
- Figure 167:
- GLOBAL FEED MYCOTOXIN DETOXIFIERS MARKET, BY COUNTRY, VOLUME, METRIC TON, 2017 - 2029
- Figure 168:
- GLOBAL FEED MYCOTOXIN DETOXIFIERS MARKET, BY COUNTRY, VALUE, USD, 2017 - 2029
- Figure 169:
- GLOBAL FEED MYCOTOXIN DETOXIFIERS MARKET, VOLUME SHARE(%), BY COUNTRY, 2017 - 2029
- Figure 170:
- GLOBAL FEED MYCOTOXIN DETOXIFIERS MARKET, VALUE SHARE(%), BY COUNTRY, 2017 - 2029
- Figure 171:
- GLOBAL FEED MYCOTOXIN DETOXIFIERS MARKET, BY COUNTRY, VOLUME, METRIC TON, 2017 - 2029
- Figure 172:
- GLOBAL FEED MYCOTOXIN DETOXIFIERS MARKET, BY COUNTRY, VALUE, USD, 2017 - 2029
- Figure 173:
- GLOBAL FEED MYCOTOXIN DETOXIFIERS MARKET, VALUE SHARE(%), BY SUB ADDITIVE, 2022 - 2029
- Figure 174:
- GLOBAL FEED MYCOTOXIN DETOXIFIERS MARKET, BY COUNTRY, VOLUME, METRIC TON, 2017 - 2029
- Figure 175:
- GLOBAL FEED MYCOTOXIN DETOXIFIERS MARKET, BY COUNTRY, VALUE, USD, 2017 - 2029
- Figure 176:
- GLOBAL FEED MYCOTOXIN DETOXIFIERS MARKET, VALUE SHARE(%), BY SUB ADDITIVE, 2022 - 2029
- Figure 177:
- GLOBAL FEED MYCOTOXIN DETOXIFIERS MARKET, BY COUNTRY, VOLUME, METRIC TON, 2017 - 2029
- Figure 178:
- GLOBAL FEED MYCOTOXIN DETOXIFIERS MARKET, BY COUNTRY, VALUE, USD, 2017 - 2029
- Figure 179:
- GLOBAL FEED MYCOTOXIN DETOXIFIERS MARKET, VALUE SHARE(%), BY SUB ADDITIVE, 2022 - 2029
- Figure 180:
- GLOBAL FEED MYCOTOXIN DETOXIFIERS MARKET, BY COUNTRY, VOLUME, METRIC TON, 2017 - 2029
- Figure 181:
- GLOBAL FEED MYCOTOXIN DETOXIFIERS MARKET, BY COUNTRY, VALUE, USD, 2017 - 2029
- Figure 182:
- GLOBAL FEED MYCOTOXIN DETOXIFIERS MARKET, VALUE SHARE(%), BY SUB ADDITIVE, 2022 - 2029
- Figure 183:
- GLOBAL FEED MYCOTOXIN DETOXIFIERS MARKET, BY COUNTRY, VOLUME, METRIC TON, 2017 - 2029
- Figure 184:
- GLOBAL FEED MYCOTOXIN DETOXIFIERS MARKET, BY COUNTRY, VALUE, USD, 2017 - 2029
- Figure 185:
- GLOBAL FEED MYCOTOXIN DETOXIFIERS MARKET, VOLUME SHARE(%), BY COUNTRY, 2017 - 2029
- Figure 186:
- GLOBAL FEED MYCOTOXIN DETOXIFIERS MARKET, VALUE SHARE(%), BY COUNTRY, 2017 - 2029
- Figure 187:
- GLOBAL FEED MYCOTOXIN DETOXIFIERS MARKET, BY COUNTRY, VOLUME, METRIC TON, 2017 - 2029
- Figure 188:
- GLOBAL FEED MYCOTOXIN DETOXIFIERS MARKET, BY COUNTRY, VALUE, USD, 2017 - 2029
- Figure 189:
- GLOBAL FEED MYCOTOXIN DETOXIFIERS MARKET, VALUE SHARE(%), BY SUB ADDITIVE, 2022 - 2029
- Figure 190:
- GLOBAL FEED MYCOTOXIN DETOXIFIERS MARKET, BY COUNTRY, VOLUME, METRIC TON, 2017 - 2029
- Figure 191:
- GLOBAL FEED MYCOTOXIN DETOXIFIERS MARKET, BY COUNTRY, VALUE, USD, 2017 - 2029
- Figure 192:
- GLOBAL FEED MYCOTOXIN DETOXIFIERS MARKET, VALUE SHARE(%), BY SUB ADDITIVE, 2022 - 2029
- Figure 193:
- GLOBAL FEED MYCOTOXIN DETOXIFIERS MARKET, BY COUNTRY, VOLUME, METRIC TON, 2017 - 2029
- Figure 194:
- GLOBAL FEED MYCOTOXIN DETOXIFIERS MARKET, BY COUNTRY, VALUE, USD, 2017 - 2029
- Figure 195:
- GLOBAL FEED MYCOTOXIN DETOXIFIERS MARKET, VALUE SHARE(%), BY SUB ADDITIVE, 2022 - 2029
- Figure 196:
- GLOBAL FEED MYCOTOXIN DETOXIFIERS MARKET, BY COUNTRY, VOLUME, METRIC TON, 2017 - 2029
- Figure 197:
- GLOBAL FEED MYCOTOXIN DETOXIFIERS MARKET, BY COUNTRY, VALUE, USD, 2017 - 2029
- Figure 198:
- GLOBAL FEED MYCOTOXIN DETOXIFIERS MARKET, VALUE SHARE(%), BY SUB ADDITIVE, 2022 - 2029
- Figure 199:
- GLOBAL FEED MYCOTOXIN DETOXIFIERS MARKET, MOST ACTIVE COMPANIES, BY NUMBER OF STRATEGIC MOVES, 2016 - 2022
- Figure 200:
- GLOBAL FEED MYCOTOXIN DETOXIFIERS MARKET, MOST ADOPTED STRATEGIES, 2016 - 2022
- Figure 201:
- GLOBAL FEED MYCOTOXIN DETOXIFIERS MARKET SHARE(%), BY MAJOR PLAYERS, 2022
Feed Mycotoxin Detoxifiers Industry Segmentation
Binders, Biotransformers are covered as segments by Sub Additive. Aquaculture, Poultry, Ruminants, Swine are covered as segments by Animal. Africa, Asia-Pacific, Europe, Middle East, North America, South America are covered as segments by Region.| Sub Additive | |
| Binders | |
| Biotransformers |
| Animal | |||||||
| |||||||
| |||||||
| |||||||
| Swine | |||||||
| Other Animals |
| Region | ||||||||||||||
| ||||||||||||||
| ||||||||||||||
| ||||||||||||||
| ||||||||||||||
| ||||||||||||||
|
Market Definition
- FUNCTIONS - For the purpose of the study, feed additives are considered to be commercially-manufactured products that are used to enhance the characteristics such as weight gain, feed conversion ratio, and feed intake when fed in appropriate proportions.
- RESELLERS - Companies engaged in reselling of feed additives without value addition have been excluded from the market scope, in order to avoid double counting.
- END CONSUMERS - Compound feed manufacturers are considered to be end-consumers in the market studied. The scope excludes farmers buying feed additives to be used directly as supplements or premixes.
- INTERNAL COMPANY CONSUMPTION - Companies engaged in the production of compound feed as well as the manufacturing of feed additives are part of the study. However, while estimating the market sizes, the internal consumption of feed additives by such companies has been excluded.
Research Methodology
Mordor Intelligence follows a four-step methodology in all our reports.
- Step-1: Identify Key Variables: The quantifiable key variables (industry and extraneous) pertaining to the specific product segment and country are selected from a group of relevant variables & factors based on desk research & literature review; along with primary expert inputs. These variables are further confirmed through regression modeling (wherever required).
- Step-2: Build a Market Model: In order to build a robust forecasting methodology, the variables and factors identified in Step-1 are tested against available historical market numbers. Through an iterative process, the variables required for market forecast are set and the model is built on the basis of these variables.
- Step-3: Validate and Finalize: In this important step, all market numbers, variables and analyst calls are validated through an extensive network of primary research experts from the market studied. The respondents are selected across levels and functions to generate a holistic picture of the market studied.
- Step-4: Research Outputs: Syndicated Reports, Custom Consulting Assignments, Databases & Subscription Platforms


