Feed Yeast Market Size

| Icons | Lable | Value |
|---|---|---|
|
|
Study Period | 2017 - 2029 |
|
|
Base Year For Estimation | 2022 |
|
|
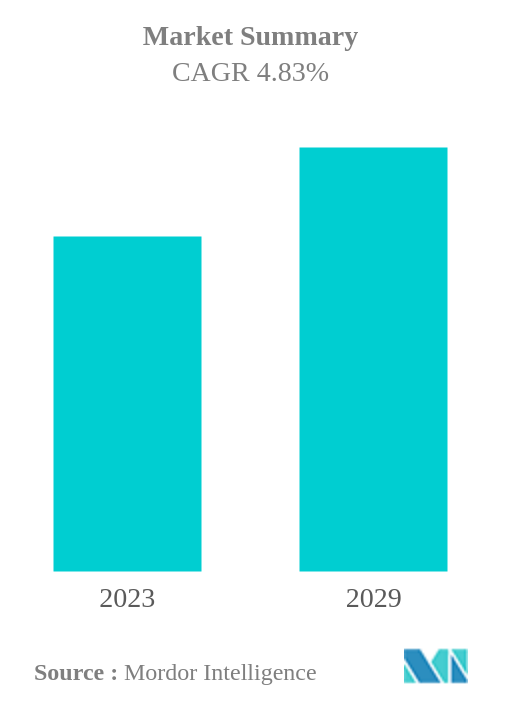
CAGR | 4.83 % |
|
|
Largest Share by Sub Additive | Yeast Derivatives |
|
|
Largest Share by Region | Asia-Pacific |
|
|
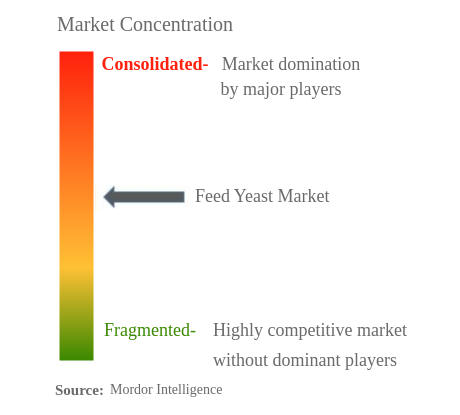
Market Concentration | High |
Major Players |
||
|
|
||
|
*Disclaimer: Major Players sorted in no particular order |
Feed Yeast Market Analysis
The Feed Yeast Market is projected to register a CAGR of 4.83%
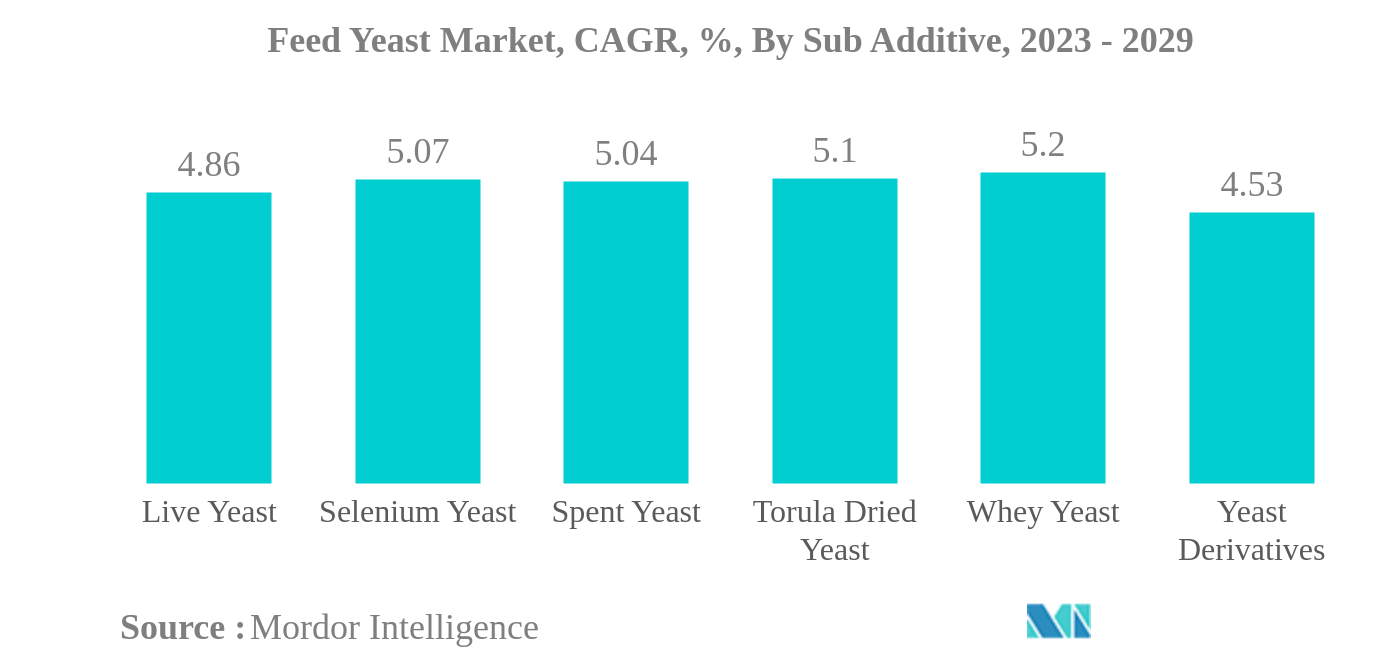
- Yeast Derivatives is the Largest Sub Additive: Yeast Derivatives are the largest sub-additive segment in the market because they improve body weight gain and feed efficiency and help maintain health and immunity.
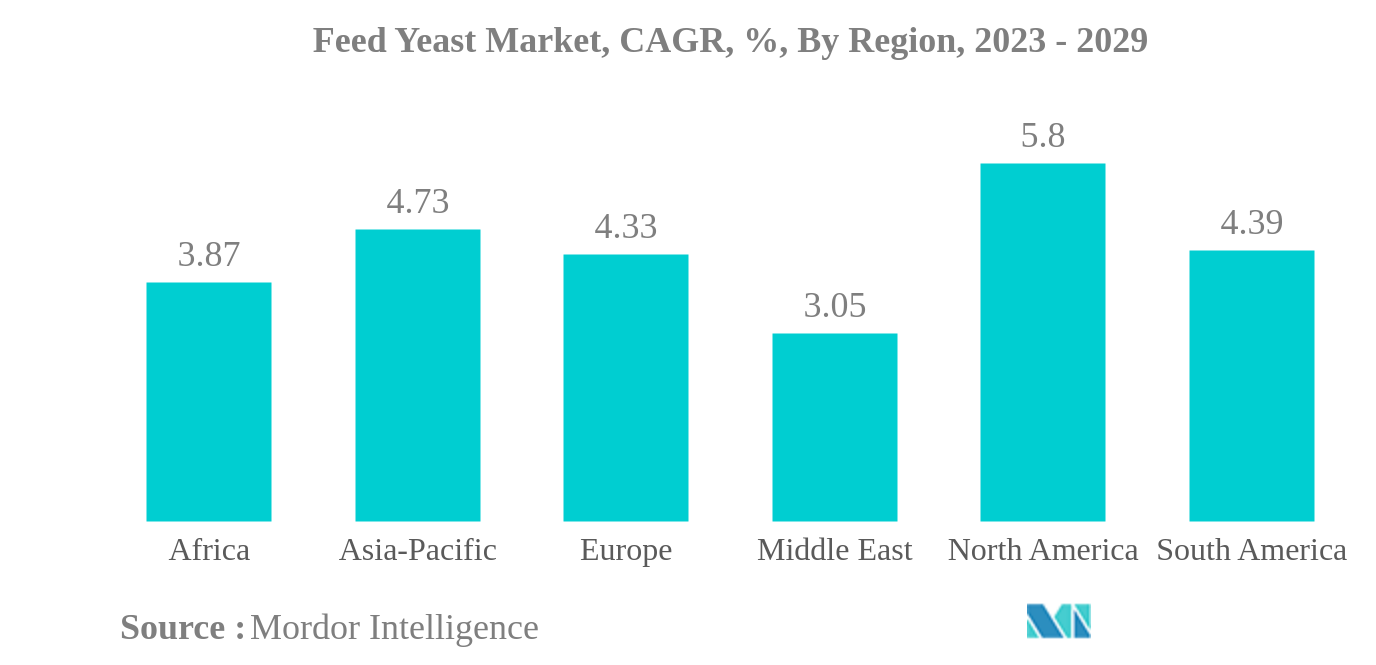
- Asia-Pacific is the Largest Region: Asia-Pacific is the largest regional segment as it has the higher poultry population, and yeast is used as an alternative for antibiotics as antibiotics are banned.
- Whey Yeast is the Fastest-growing Sub Additive: Whey Yeast is the fastest-growing segment in the market as they alter rumen fermentation to improve nutrient digestion and reduce the risk of rumen acidosis.
- North America is the Fastest-growing Region: North America is witnessing the fastest growth due to the increasing use of yeast as a nutritional supplement for livestock and a ban on antibiotics as growth promoters.
Feed Yeast Market Trends
This section covers the major market trends shaping the Feed Yeast Market according to our research experts:
Yeast Derivatives is the largest Sub Additive
- The global feed yeast market has seen significant growth in recent years due to the positive impact of feed yeast cultures on animal health and productivity. Feed yeast accounted for 3.1% of the global feed additives market in 2022. One of the key benefits of feed yeast is that it enhances the growth of helpful bacteria in the stomach that break down cellulose and improve digestion.
- The Asia-Pacific region was the largest market for feed yeast in the world, accounting for 31.4% of the market share in 2022. This was followed by North America and Europe, which accounted for 25.4% and 23.5% of the market, respectively. The higher share of Asia-Pacific was due to the higher penetration rates of additives and a larger animal population.
- Yeast derivatives were the most commonly consumed feed yeast by animals, accounting for USD 0.49 billion in 2022. Spent yeast held the second-largest share in the market. Yeast improves body weight and feed efficiency and helps in the maintenance of health and immunity.
- Poultry birds were the largest animal type that consumed feed yeast, accounting for 45.1% of the global feed yeast market in 2022, as yeast plays a crucial role in the growth and productivity of poultry birds.
- During the forecast period, whey yeast is expected to be the fastest-growing feed yeast, with a CAGR of 5.2%. Whey yeast is used to alter rumen fermentation, which improves nutrient digestion, reduces the risk of rumen acidosis, and improves animal performance.
- The global feed yeast market is expected to continue growing, registering a CAGR of 4.8% during the forecast period. This growth is driven by growth in the animal feed industry. The benefits of feed yeast for animal health and productivity are expected to continue driving its demand in the future.
Asia-Pacific is the largest Region
- The feed yeast segment is an important segment in the global feed additive market, as it plays a vital role in enhancing the antimicrobial activity of the gut and promoting animal growth by improving intestinal microbiota. In 2022, the feed yeast segment accounted for 4.1% of the global feed additive market.
- Asia-Pacific was the largest market for feed yeast in 2022, with a market value of USD 0.4 billion, driven by its higher penetration rate and feed production, which stood at 0.5 billion metric tons in 2022. The United States emerged as the largest country, accounting for 18.9% of the market in 2022, with a value of USD 0.25 billion due to extensive commercial animal cultivation and the country's adoption of new production practices in its animal farms. China and Brazil accounted for 14.5% and 6.6%, respectively, of the global feed yeast market in 2022, owing to their higher compound feed production.
- The United States is the fastest-growing country in the global feed yeast market. It is expected to record a CAGR of 6.3% during the forecast period due to the increasing demand for yeast as an antibiotic substitute and its ability to increase feed efficiency.
- Poultry birds and swine were the largest animal types in the global feed yeast market, accounting for 45.2% and 25%, respectively, in 2022 due to the antimicrobial performance of yeast on toxins in the gut, which enhances intestinal health and increases feed efficiency.
- The global feed yeast market is expected to record a CAGR of 4.8% during the forecast period due to the ability of yeast to serve as a substitute for antibiotics and its ability to increase feed efficiency, thereby reducing costs and improving animal growth rates.
Feed Yeast Industry Overview
The Feed Yeast Market is moderately consolidated, with the top five companies occupying 44.35%. The major players in this market are Archer Daniel Midland Co., Cargill Inc., DSM Nutritional Products AG, Lallemand Inc. and Phibro Animal Health Corporation (sorted alphabetically).
Feed Yeast Market Leaders
Archer Daniel Midland Co.
Cargill Inc.
DSM Nutritional Products AG
Lallemand Inc.
Phibro Animal Health Corporation
*Disclaimer: Major Players sorted in no particular order
Feed Yeast Market News
- January 2023: Novus International acquired the Biotech company Agrivida to develop new feed additives.
- September 2022: Lallemand opened a new branch in Poland and standardized its presence in the country to sell its microbial-based animal nutrition and well-being solutions directly.
- September 2022: DSM has acquired Prodap, a leading Brazilian animal nutrition and technology company. With this strategy, the company combines technology offerings, consulting services, and specialized nutritional solutions to improve animal farming efficiency and sustainability.
Feed Yeast Market Report - Table of Contents
1. INTRODUCTION
1.1. Study Assumptions & Market Definition
1.2. Scope of the Study
1.3. Research Methodology
2. KEY INDUSTRY TRENDS
2.1. Animal Headcount
2.2. Feed Production
2.3. Regulatory Framework
2.4. Value Chain & Distribution Channel Analysis
3. MARKET SEGMENTATION
3.1. Sub Additive
3.1.1. Live Yeast
3.1.2. Selenium Yeast
3.1.3. Spent Yeast
3.1.4. Torula Dried Yeast
3.1.5. Whey Yeast
3.1.6. Yeast Derivatives
3.2. Animal
3.2.1. Aquaculture
3.2.1.1. By Sub Animal
3.2.1.1.1. Fish
3.2.1.1.2. Shrimp
3.2.1.1.3. Other Aquaculture Species
3.2.2. Poultry
3.2.2.1. By Sub Animal
3.2.2.1.1. Broiler
3.2.2.1.2. Layer
3.2.2.1.3. Other Poultry Birds
3.2.3. Ruminants
3.2.3.1. By Sub Animal
3.2.3.1.1. Beef Cattle
3.2.3.1.2. Dairy Cattle
3.2.3.1.3. Other Ruminants
3.2.4. Swine
3.2.5. Other Animals
3.3. Region
3.3.1. Africa
3.3.1.1. By Country
3.3.1.1.1. Egypt
3.3.1.1.2. Kenya
3.3.1.1.3. South Africa
3.3.1.1.4. Rest of Africa
3.3.2. Asia-Pacific
3.3.2.1. By Country
3.3.2.1.1. Australia
3.3.2.1.2. China
3.3.2.1.3. India
3.3.2.1.4. Indonesia
3.3.2.1.5. Japan
3.3.2.1.6. Philippines
3.3.2.1.7. South Korea
3.3.2.1.8. Thailand
3.3.2.1.9. Vietnam
3.3.2.1.10. Rest of Asia-Pacific
3.3.3. Europe
3.3.3.1. By Country
3.3.3.1.1. France
3.3.3.1.2. Germany
3.3.3.1.3. Italy
3.3.3.1.4. Netherlands
3.3.3.1.5. Russia
3.3.3.1.6. Spain
3.3.3.1.7. Turkey
3.3.3.1.8. United Kingdom
3.3.3.1.9. Rest of Europe
3.3.4. Middle East
3.3.4.1. By Country
3.3.4.1.1. Iran
3.3.4.1.2. Saudi Arabia
3.3.4.1.3. Rest of Middle East
3.3.5. North America
3.3.5.1. By Country
3.3.5.1.1. Canada
3.3.5.1.2. Mexico
3.3.5.1.3. United States
3.3.5.1.4. Rest of North America
3.3.6. South America
3.3.6.1. By Country
3.3.6.1.1. Argentina
3.3.6.1.2. Brazil
3.3.6.1.3. Chile
3.3.6.1.4. Rest of South America
4. COMPETITIVE LANDSCAPE
4.1. Key Strategic Moves
4.2. Market Share Analysis
4.3. Company Landscape
4.4. Company Profiles
4.4.1. Alltech, Inc.
4.4.2. Archer Daniel Midland Co.
4.4.3. Associated British Foods plc
4.4.4. Cargill Inc.
4.4.5. DSM Nutritional Products AG
4.4.6. Innov Ad NV/SA
4.4.7. Kemin Industries
4.4.8. Lallemand Inc.
4.4.9. Novus International, Inc.
4.4.10. Phibro Animal Health Corporation
5. KEY STRATEGIC QUESTIONS FOR FEED ADDITIVE CEOS
6. APPENDIX
6.1. Global Overview
6.1.1. Overview
6.1.2. Porter’s Five Forces Framework
6.1.3. Global Value Chain Analysis
6.1.4. Global Market Size and DROs
6.2. Sources & References
6.3. List of Tables & Figures
6.4. Primary Insights
6.5. Data Pack
6.6. Glossary of Terms
List of Tables & Figures
- Figure 1:
- GLOBAL FEED YEAST MARKET, ANIMAL HEAD COUNT, NUMBER, BY POULTRY, 2017-2022
- Figure 2:
- GLOBAL FEED YEAST MARKET, ANIMAL HEAD COUNT, NUMBER, BY RUMINANTS, 2017-2022
- Figure 3:
- GLOBAL FEED YEAST MARKET, ANIMAL HEAD COUNT, NUMBER, BY SWINE, 2017-2022
- Figure 4:
- GLOBAL FEED YEAST MARKET, FEED PRODUCTION, METRIC TON, BY AQUACULTURE, 2017-2022
- Figure 5:
- GLOBAL FEED YEAST MARKET, FEED PRODUCTION, METRIC TON, BY POULTRY, 2017-2022
- Figure 6:
- GLOBAL FEED YEAST MARKET, FEED PRODUCTION, METRIC TON, BY RUMINANTS, 2017-2022
- Figure 7:
- GLOBAL FEED YEAST MARKET, FEED PRODUCTION, METRIC TON, BY SWINE, 2017-2022
- Figure 8:
- GLOBAL FEED YEAST MARKET, VOLUME, METRIC TON, 2017 - 2029
- Figure 9:
- GLOBAL FEED YEAST MARKET, VALUE, USD, 2017 - 2029
- Figure 10:
- GLOBAL FEED YEAST MARKET, BY SUB ADDITIVE, VOLUME, METRIC TON, 2017 - 2029
- Figure 11:
- GLOBAL FEED YEAST MARKET, BY SUB ADDITIVE, VALUE, USD, 2017 - 2029
- Figure 12:
- GLOBAL FEED YEAST MARKET, VOLUME SHARE(%), BY SUB ADDITIVE, 2017 - 2029
- Figure 13:
- GLOBAL FEED YEAST MARKET, VALUE SHARE(%), BY SUB ADDITIVE, 2017 - 2029
- Figure 14:
- GLOBAL FEED YEAST MARKET, BY SUB ADDITIVE, VOLUME, METRIC TON, 2017 - 2029
- Figure 15:
- GLOBAL FEED YEAST MARKET, BY SUB ADDITIVE, VALUE, USD, 2017 - 2029
- Figure 16:
- GLOBAL FEED YEAST MARKET, VALUE SHARE(%), BY ANIMAL, 2022 - 2029
- Figure 17:
- GLOBAL FEED YEAST MARKET, BY SUB ADDITIVE, VOLUME, METRIC TON, 2017 - 2029
- Figure 18:
- GLOBAL FEED YEAST MARKET, BY SUB ADDITIVE, VALUE, USD, 2017 - 2029
- Figure 19:
- GLOBAL FEED YEAST MARKET, VALUE SHARE(%), BY ANIMAL, 2022 - 2029
- Figure 20:
- GLOBAL FEED YEAST MARKET, BY SUB ADDITIVE, VOLUME, METRIC TON, 2017 - 2029
- Figure 21:
- GLOBAL FEED YEAST MARKET, BY SUB ADDITIVE, VALUE, USD, 2017 - 2029
- Figure 22:
- GLOBAL FEED YEAST MARKET, VALUE SHARE(%), BY ANIMAL, 2022 - 2029
- Figure 23:
- GLOBAL FEED YEAST MARKET, BY SUB ADDITIVE, VOLUME, METRIC TON, 2017 - 2029
- Figure 24:
- GLOBAL FEED YEAST MARKET, BY SUB ADDITIVE, VALUE, USD, 2017 - 2029
- Figure 25:
- GLOBAL FEED YEAST MARKET, VALUE SHARE(%), BY ANIMAL, 2022 - 2029
- Figure 26:
- GLOBAL FEED YEAST MARKET, BY SUB ADDITIVE, VOLUME, METRIC TON, 2017 - 2029
- Figure 27:
- GLOBAL FEED YEAST MARKET, BY SUB ADDITIVE, VALUE, USD, 2017 - 2029
- Figure 28:
- GLOBAL FEED YEAST MARKET, VALUE SHARE(%), BY ANIMAL, 2022 - 2029
- Figure 29:
- GLOBAL FEED YEAST MARKET, BY SUB ADDITIVE, VOLUME, METRIC TON, 2017 - 2029
- Figure 30:
- GLOBAL FEED YEAST MARKET, BY SUB ADDITIVE, VALUE, USD, 2017 - 2029
- Figure 31:
- GLOBAL FEED YEAST MARKET, VALUE SHARE(%), BY ANIMAL, 2022 - 2029
- Figure 32:
- GLOBAL FEED YEAST MARKET, BY ANIMAL, VOLUME, METRIC TON, 2017 - 2029
- Figure 33:
- GLOBAL FEED YEAST MARKET, BY ANIMAL, VALUE, USD, 2017 - 2029
- Figure 34:
- GLOBAL FEED YEAST MARKET, VOLUME SHARE(%), BY ANIMAL, 2017 - 2029
- Figure 35:
- GLOBAL FEED YEAST MARKET, VALUE SHARE(%), BY ANIMAL, 2017 - 2029
- Figure 36:
- GLOBAL FEED YEAST MARKET, BY SUB ANIMAL, VOLUME, METRIC TON, 2017 - 2029
- Figure 37:
- GLOBAL FEED YEAST MARKET, BY SUB ANIMAL, VALUE, USD, 2017 - 2029
- Figure 38:
- GLOBAL FEED YEAST MARKET, VOLUME SHARE(%), BY SUB ANIMAL, 2017 - 2029
- Figure 39:
- GLOBAL FEED YEAST MARKET, VALUE SHARE(%), BY SUB ANIMAL, 2017 - 2029
- Figure 40:
- GLOBAL FEED YEAST MARKET, BY SUB ANIMAL, VOLUME, METRIC TON, 2017 - 2029
- Figure 41:
- GLOBAL FEED YEAST MARKET, BY SUB ANIMAL, VALUE, USD, 2017 - 2029
- Figure 42:
- GLOBAL FEED YEAST MARKET, VALUE SHARE(%), BY SUB ADDITIVE, 2022 - 2029
- Figure 43:
- GLOBAL FEED YEAST MARKET, BY SUB ANIMAL, VOLUME, METRIC TON, 2017 - 2029
- Figure 44:
- GLOBAL FEED YEAST MARKET, BY SUB ANIMAL, VALUE, USD, 2017 - 2029
- Figure 45:
- GLOBAL FEED YEAST MARKET, VALUE SHARE(%), BY SUB ADDITIVE, 2022 - 2029
- Figure 46:
- GLOBAL FEED YEAST MARKET, BY SUB ANIMAL, VOLUME, METRIC TON, 2017 - 2029
- Figure 47:
- GLOBAL FEED YEAST MARKET, BY SUB ANIMAL, VALUE, USD, 2017 - 2029
- Figure 48:
- GLOBAL FEED YEAST MARKET, VALUE SHARE(%), BY SUB ADDITIVE, 2022 - 2029
- Figure 49:
- GLOBAL FEED YEAST MARKET, BY SUB ANIMAL, VOLUME, METRIC TON, 2017 - 2029
- Figure 50:
- GLOBAL FEED YEAST MARKET, BY SUB ANIMAL, VALUE, USD, 2017 - 2029
- Figure 51:
- GLOBAL FEED YEAST MARKET, VOLUME SHARE(%), BY SUB ANIMAL, 2017 - 2029
- Figure 52:
- GLOBAL FEED YEAST MARKET, VALUE SHARE(%), BY SUB ANIMAL, 2017 - 2029
- Figure 53:
- GLOBAL FEED YEAST MARKET, BY SUB ANIMAL, VOLUME, METRIC TON, 2017 - 2029
- Figure 54:
- GLOBAL FEED YEAST MARKET, BY SUB ANIMAL, VALUE, USD, 2017 - 2029
- Figure 55:
- GLOBAL FEED YEAST MARKET, VALUE SHARE(%), BY SUB ADDITIVE, 2022 - 2029
- Figure 56:
- GLOBAL FEED YEAST MARKET, BY SUB ANIMAL, VOLUME, METRIC TON, 2017 - 2029
- Figure 57:
- GLOBAL FEED YEAST MARKET, BY SUB ANIMAL, VALUE, USD, 2017 - 2029
- Figure 58:
- GLOBAL FEED YEAST MARKET, VALUE SHARE(%), BY SUB ADDITIVE, 2022 - 2029
- Figure 59:
- GLOBAL FEED YEAST MARKET, BY SUB ANIMAL, VOLUME, METRIC TON, 2017 - 2029
- Figure 60:
- GLOBAL FEED YEAST MARKET, BY SUB ANIMAL, VALUE, USD, 2017 - 2029
- Figure 61:
- GLOBAL FEED YEAST MARKET, VALUE SHARE(%), BY SUB ADDITIVE, 2022 - 2029
- Figure 62:
- GLOBAL FEED YEAST MARKET, BY SUB ANIMAL, VOLUME, METRIC TON, 2017 - 2029
- Figure 63:
- GLOBAL FEED YEAST MARKET, BY SUB ANIMAL, VALUE, USD, 2017 - 2029
- Figure 64:
- GLOBAL FEED YEAST MARKET, VOLUME SHARE(%), BY SUB ANIMAL, 2017 - 2029
- Figure 65:
- GLOBAL FEED YEAST MARKET, VALUE SHARE(%), BY SUB ANIMAL, 2017 - 2029
- Figure 66:
- GLOBAL FEED YEAST MARKET, BY SUB ANIMAL, VOLUME, METRIC TON, 2017 - 2029
- Figure 67:
- GLOBAL FEED YEAST MARKET, BY SUB ANIMAL, VALUE, USD, 2017 - 2029
- Figure 68:
- GLOBAL FEED YEAST MARKET, VALUE SHARE(%), BY SUB ADDITIVE, 2022 - 2029
- Figure 69:
- GLOBAL FEED YEAST MARKET, BY SUB ANIMAL, VOLUME, METRIC TON, 2017 - 2029
- Figure 70:
- GLOBAL FEED YEAST MARKET, BY SUB ANIMAL, VALUE, USD, 2017 - 2029
- Figure 71:
- GLOBAL FEED YEAST MARKET, VALUE SHARE(%), BY SUB ADDITIVE, 2022 - 2029
- Figure 72:
- GLOBAL FEED YEAST MARKET, BY SUB ANIMAL, VOLUME, METRIC TON, 2017 - 2029
- Figure 73:
- GLOBAL FEED YEAST MARKET, BY SUB ANIMAL, VALUE, USD, 2017 - 2029
- Figure 74:
- GLOBAL FEED YEAST MARKET, VALUE SHARE(%), BY SUB ADDITIVE, 2022 - 2029
- Figure 75:
- GLOBAL FEED YEAST MARKET, BY ANIMAL, VOLUME, METRIC TON, 2017 - 2029
- Figure 76:
- GLOBAL FEED YEAST MARKET, BY ANIMAL, VALUE, USD, 2017 - 2029
- Figure 77:
- GLOBAL FEED YEAST MARKET, VALUE SHARE(%), BY SUB ADDITIVE, 2022 - 2029
- Figure 78:
- GLOBAL FEED YEAST MARKET, BY ANIMAL, VOLUME, METRIC TON, 2017 - 2029
- Figure 79:
- GLOBAL FEED YEAST MARKET, BY ANIMAL, VALUE, USD, 2017 - 2029
- Figure 80:
- GLOBAL FEED YEAST MARKET, VALUE SHARE(%), BY SUB ADDITIVE, 2022 - 2029
- Figure 81:
- GLOBAL FEED YEAST MARKET, BY REGION, VOLUME, METRIC TON, 2017 - 2029
- Figure 82:
- GLOBAL FEED YEAST MARKET, BY REGION, VALUE, USD, 2017 - 2029
- Figure 83:
- GLOBAL FEED YEAST MARKET, VOLUME SHARE(%), BY REGION, 2017 - 2029
- Figure 84:
- GLOBAL FEED YEAST MARKET, VALUE SHARE(%), BY REGION, 2017 - 2029
- Figure 85:
- GLOBAL FEED YEAST MARKET, BY COUNTRY, VOLUME, METRIC TON, 2017 - 2029
- Figure 86:
- GLOBAL FEED YEAST MARKET, BY COUNTRY, VALUE, USD, 2017 - 2029
- Figure 87:
- GLOBAL FEED YEAST MARKET, VOLUME SHARE(%), BY COUNTRY, 2017 - 2029
- Figure 88:
- GLOBAL FEED YEAST MARKET, VALUE SHARE(%), BY COUNTRY, 2017 - 2029
- Figure 89:
- GLOBAL FEED YEAST MARKET, BY COUNTRY, VOLUME, METRIC TON, 2017 - 2029
- Figure 90:
- GLOBAL FEED YEAST MARKET, BY COUNTRY, VALUE, USD, 2017 - 2029
- Figure 91:
- GLOBAL FEED YEAST MARKET, VALUE SHARE(%), BY SUB ADDITIVE, 2022 - 2029
- Figure 92:
- GLOBAL FEED YEAST MARKET, BY COUNTRY, VOLUME, METRIC TON, 2017 - 2029
- Figure 93:
- GLOBAL FEED YEAST MARKET, BY COUNTRY, VALUE, USD, 2017 - 2029
- Figure 94:
- GLOBAL FEED YEAST MARKET, VALUE SHARE(%), BY SUB ADDITIVE, 2022 - 2029
- Figure 95:
- GLOBAL FEED YEAST MARKET, BY COUNTRY, VOLUME, METRIC TON, 2017 - 2029
- Figure 96:
- GLOBAL FEED YEAST MARKET, BY COUNTRY, VALUE, USD, 2017 - 2029
- Figure 97:
- GLOBAL FEED YEAST MARKET, VALUE SHARE(%), BY SUB ADDITIVE, 2022 - 2029
- Figure 98:
- GLOBAL FEED YEAST MARKET, BY COUNTRY, VOLUME, METRIC TON, 2017 - 2029
- Figure 99:
- GLOBAL FEED YEAST MARKET, BY COUNTRY, VALUE, USD, 2017 - 2029
- Figure 100:
- GLOBAL FEED YEAST MARKET, VALUE SHARE(%), BY SUB ADDITIVE, 2022 - 2029
- Figure 101:
- GLOBAL FEED YEAST MARKET, BY COUNTRY, VOLUME, METRIC TON, 2017 - 2029
- Figure 102:
- GLOBAL FEED YEAST MARKET, BY COUNTRY, VALUE, USD, 2017 - 2029
- Figure 103:
- GLOBAL FEED YEAST MARKET, VOLUME SHARE(%), BY COUNTRY, 2017 - 2029
- Figure 104:
- GLOBAL FEED YEAST MARKET, VALUE SHARE(%), BY COUNTRY, 2017 - 2029
- Figure 105:
- GLOBAL FEED YEAST MARKET, BY COUNTRY, VOLUME, METRIC TON, 2017 - 2029
- Figure 106:
- GLOBAL FEED YEAST MARKET, BY COUNTRY, VALUE, USD, 2017 - 2029
- Figure 107:
- GLOBAL FEED YEAST MARKET, VALUE SHARE(%), BY SUB ADDITIVE, 2022 - 2029
- Figure 108:
- GLOBAL FEED YEAST MARKET, BY COUNTRY, VOLUME, METRIC TON, 2017 - 2029
- Figure 109:
- GLOBAL FEED YEAST MARKET, BY COUNTRY, VALUE, USD, 2017 - 2029
- Figure 110:
- GLOBAL FEED YEAST MARKET, VALUE SHARE(%), BY SUB ADDITIVE, 2022 - 2029
- Figure 111:
- GLOBAL FEED YEAST MARKET, BY COUNTRY, VOLUME, METRIC TON, 2017 - 2029
- Figure 112:
- GLOBAL FEED YEAST MARKET, BY COUNTRY, VALUE, USD, 2017 - 2029
- Figure 113:
- GLOBAL FEED YEAST MARKET, VALUE SHARE(%), BY SUB ADDITIVE, 2022 - 2029
- Figure 114:
- GLOBAL FEED YEAST MARKET, BY COUNTRY, VOLUME, METRIC TON, 2017 - 2029
- Figure 115:
- GLOBAL FEED YEAST MARKET, BY COUNTRY, VALUE, USD, 2017 - 2029
- Figure 116:
- GLOBAL FEED YEAST MARKET, VALUE SHARE(%), BY SUB ADDITIVE, 2022 - 2029
- Figure 117:
- GLOBAL FEED YEAST MARKET, BY COUNTRY, VOLUME, METRIC TON, 2017 - 2029
- Figure 118:
- GLOBAL FEED YEAST MARKET, BY COUNTRY, VALUE, USD, 2017 - 2029
- Figure 119:
- GLOBAL FEED YEAST MARKET, VALUE SHARE(%), BY SUB ADDITIVE, 2022 - 2029
- Figure 120:
- GLOBAL FEED YEAST MARKET, BY COUNTRY, VOLUME, METRIC TON, 2017 - 2029
- Figure 121:
- GLOBAL FEED YEAST MARKET, BY COUNTRY, VALUE, USD, 2017 - 2029
- Figure 122:
- GLOBAL FEED YEAST MARKET, VALUE SHARE(%), BY SUB ADDITIVE, 2022 - 2029
- Figure 123:
- GLOBAL FEED YEAST MARKET, BY COUNTRY, VOLUME, METRIC TON, 2017 - 2029
- Figure 124:
- GLOBAL FEED YEAST MARKET, BY COUNTRY, VALUE, USD, 2017 - 2029
- Figure 125:
- GLOBAL FEED YEAST MARKET, VALUE SHARE(%), BY SUB ADDITIVE, 2022 - 2029
- Figure 126:
- GLOBAL FEED YEAST MARKET, BY COUNTRY, VOLUME, METRIC TON, 2017 - 2029
- Figure 127:
- GLOBAL FEED YEAST MARKET, BY COUNTRY, VALUE, USD, 2017 - 2029
- Figure 128:
- GLOBAL FEED YEAST MARKET, VALUE SHARE(%), BY SUB ADDITIVE, 2022 - 2029
- Figure 129:
- GLOBAL FEED YEAST MARKET, BY COUNTRY, VOLUME, METRIC TON, 2017 - 2029
- Figure 130:
- GLOBAL FEED YEAST MARKET, BY COUNTRY, VALUE, USD, 2017 - 2029
- Figure 131:
- GLOBAL FEED YEAST MARKET, VALUE SHARE(%), BY SUB ADDITIVE, 2022 - 2029
- Figure 132:
- GLOBAL FEED YEAST MARKET, BY COUNTRY, VOLUME, METRIC TON, 2017 - 2029
- Figure 133:
- GLOBAL FEED YEAST MARKET, BY COUNTRY, VALUE, USD, 2017 - 2029
- Figure 134:
- GLOBAL FEED YEAST MARKET, VALUE SHARE(%), BY SUB ADDITIVE, 2022 - 2029
- Figure 135:
- GLOBAL FEED YEAST MARKET, BY COUNTRY, VOLUME, METRIC TON, 2017 - 2029
- Figure 136:
- GLOBAL FEED YEAST MARKET, BY COUNTRY, VALUE, USD, 2017 - 2029
- Figure 137:
- GLOBAL FEED YEAST MARKET, VOLUME SHARE(%), BY COUNTRY, 2017 - 2029
- Figure 138:
- GLOBAL FEED YEAST MARKET, VALUE SHARE(%), BY COUNTRY, 2017 - 2029
- Figure 139:
- GLOBAL FEED YEAST MARKET, BY COUNTRY, VOLUME, METRIC TON, 2017 - 2029
- Figure 140:
- GLOBAL FEED YEAST MARKET, BY COUNTRY, VALUE, USD, 2017 - 2029
- Figure 141:
- GLOBAL FEED YEAST MARKET, VALUE SHARE(%), BY SUB ADDITIVE, 2022 - 2029
- Figure 142:
- GLOBAL FEED YEAST MARKET, BY COUNTRY, VOLUME, METRIC TON, 2017 - 2029
- Figure 143:
- GLOBAL FEED YEAST MARKET, BY COUNTRY, VALUE, USD, 2017 - 2029
- Figure 144:
- GLOBAL FEED YEAST MARKET, VALUE SHARE(%), BY SUB ADDITIVE, 2022 - 2029
- Figure 145:
- GLOBAL FEED YEAST MARKET, BY COUNTRY, VOLUME, METRIC TON, 2017 - 2029
- Figure 146:
- GLOBAL FEED YEAST MARKET, BY COUNTRY, VALUE, USD, 2017 - 2029
- Figure 147:
- GLOBAL FEED YEAST MARKET, VALUE SHARE(%), BY SUB ADDITIVE, 2022 - 2029
- Figure 148:
- GLOBAL FEED YEAST MARKET, BY COUNTRY, VOLUME, METRIC TON, 2017 - 2029
- Figure 149:
- GLOBAL FEED YEAST MARKET, BY COUNTRY, VALUE, USD, 2017 - 2029
- Figure 150:
- GLOBAL FEED YEAST MARKET, VALUE SHARE(%), BY SUB ADDITIVE, 2022 - 2029
- Figure 151:
- GLOBAL FEED YEAST MARKET, BY COUNTRY, VOLUME, METRIC TON, 2017 - 2029
- Figure 152:
- GLOBAL FEED YEAST MARKET, BY COUNTRY, VALUE, USD, 2017 - 2029
- Figure 153:
- GLOBAL FEED YEAST MARKET, VALUE SHARE(%), BY SUB ADDITIVE, 2022 - 2029
- Figure 154:
- GLOBAL FEED YEAST MARKET, BY COUNTRY, VOLUME, METRIC TON, 2017 - 2029
- Figure 155:
- GLOBAL FEED YEAST MARKET, BY COUNTRY, VALUE, USD, 2017 - 2029
- Figure 156:
- GLOBAL FEED YEAST MARKET, VALUE SHARE(%), BY SUB ADDITIVE, 2022 - 2029
- Figure 157:
- GLOBAL FEED YEAST MARKET, BY COUNTRY, VOLUME, METRIC TON, 2017 - 2029
- Figure 158:
- GLOBAL FEED YEAST MARKET, BY COUNTRY, VALUE, USD, 2017 - 2029
- Figure 159:
- GLOBAL FEED YEAST MARKET, VALUE SHARE(%), BY SUB ADDITIVE, 2022 - 2029
- Figure 160:
- GLOBAL FEED YEAST MARKET, BY COUNTRY, VOLUME, METRIC TON, 2017 - 2029
- Figure 161:
- GLOBAL FEED YEAST MARKET, BY COUNTRY, VALUE, USD, 2017 - 2029
- Figure 162:
- GLOBAL FEED YEAST MARKET, VALUE SHARE(%), BY SUB ADDITIVE, 2022 - 2029
- Figure 163:
- GLOBAL FEED YEAST MARKET, BY COUNTRY, VOLUME, METRIC TON, 2017 - 2029
- Figure 164:
- GLOBAL FEED YEAST MARKET, BY COUNTRY, VALUE, USD, 2017 - 2029
- Figure 165:
- GLOBAL FEED YEAST MARKET, VALUE SHARE(%), BY SUB ADDITIVE, 2022 - 2029
- Figure 166:
- GLOBAL FEED YEAST MARKET, BY COUNTRY, VOLUME, METRIC TON, 2017 - 2029
- Figure 167:
- GLOBAL FEED YEAST MARKET, BY COUNTRY, VALUE, USD, 2017 - 2029
- Figure 168:
- GLOBAL FEED YEAST MARKET, VOLUME SHARE(%), BY COUNTRY, 2017 - 2029
- Figure 169:
- GLOBAL FEED YEAST MARKET, VALUE SHARE(%), BY COUNTRY, 2017 - 2029
- Figure 170:
- GLOBAL FEED YEAST MARKET, BY COUNTRY, VOLUME, METRIC TON, 2017 - 2029
- Figure 171:
- GLOBAL FEED YEAST MARKET, BY COUNTRY, VALUE, USD, 2017 - 2029
- Figure 172:
- GLOBAL FEED YEAST MARKET, VALUE SHARE(%), BY SUB ADDITIVE, 2022 - 2029
- Figure 173:
- GLOBAL FEED YEAST MARKET, BY COUNTRY, VOLUME, METRIC TON, 2017 - 2029
- Figure 174:
- GLOBAL FEED YEAST MARKET, BY COUNTRY, VALUE, USD, 2017 - 2029
- Figure 175:
- GLOBAL FEED YEAST MARKET, VALUE SHARE(%), BY SUB ADDITIVE, 2022 - 2029
- Figure 176:
- GLOBAL FEED YEAST MARKET, BY COUNTRY, VOLUME, METRIC TON, 2017 - 2029
- Figure 177:
- GLOBAL FEED YEAST MARKET, BY COUNTRY, VALUE, USD, 2017 - 2029
- Figure 178:
- GLOBAL FEED YEAST MARKET, VALUE SHARE(%), BY SUB ADDITIVE, 2022 - 2029
- Figure 179:
- GLOBAL FEED YEAST MARKET, BY COUNTRY, VOLUME, METRIC TON, 2017 - 2029
- Figure 180:
- GLOBAL FEED YEAST MARKET, BY COUNTRY, VALUE, USD, 2017 - 2029
- Figure 181:
- GLOBAL FEED YEAST MARKET, VOLUME SHARE(%), BY COUNTRY, 2017 - 2029
- Figure 182:
- GLOBAL FEED YEAST MARKET, VALUE SHARE(%), BY COUNTRY, 2017 - 2029
- Figure 183:
- GLOBAL FEED YEAST MARKET, BY COUNTRY, VOLUME, METRIC TON, 2017 - 2029
- Figure 184:
- GLOBAL FEED YEAST MARKET, BY COUNTRY, VALUE, USD, 2017 - 2029
- Figure 185:
- GLOBAL FEED YEAST MARKET, VALUE SHARE(%), BY SUB ADDITIVE, 2022 - 2029
- Figure 186:
- GLOBAL FEED YEAST MARKET, BY COUNTRY, VOLUME, METRIC TON, 2017 - 2029
- Figure 187:
- GLOBAL FEED YEAST MARKET, BY COUNTRY, VALUE, USD, 2017 - 2029
- Figure 188:
- GLOBAL FEED YEAST MARKET, VALUE SHARE(%), BY SUB ADDITIVE, 2022 - 2029
- Figure 189:
- GLOBAL FEED YEAST MARKET, BY COUNTRY, VOLUME, METRIC TON, 2017 - 2029
- Figure 190:
- GLOBAL FEED YEAST MARKET, BY COUNTRY, VALUE, USD, 2017 - 2029
- Figure 191:
- GLOBAL FEED YEAST MARKET, VALUE SHARE(%), BY SUB ADDITIVE, 2022 - 2029
- Figure 192:
- GLOBAL FEED YEAST MARKET, BY COUNTRY, VOLUME, METRIC TON, 2017 - 2029
- Figure 193:
- GLOBAL FEED YEAST MARKET, BY COUNTRY, VALUE, USD, 2017 - 2029
- Figure 194:
- GLOBAL FEED YEAST MARKET, VALUE SHARE(%), BY SUB ADDITIVE, 2022 - 2029
- Figure 195:
- GLOBAL FEED YEAST MARKET, BY COUNTRY, VOLUME, METRIC TON, 2017 - 2029
- Figure 196:
- GLOBAL FEED YEAST MARKET, BY COUNTRY, VALUE, USD, 2017 - 2029
- Figure 197:
- GLOBAL FEED YEAST MARKET, VOLUME SHARE(%), BY COUNTRY, 2017 - 2029
- Figure 198:
- GLOBAL FEED YEAST MARKET, VALUE SHARE(%), BY COUNTRY, 2017 - 2029
- Figure 199:
- GLOBAL FEED YEAST MARKET, BY COUNTRY, VOLUME, METRIC TON, 2017 - 2029
- Figure 200:
- GLOBAL FEED YEAST MARKET, BY COUNTRY, VALUE, USD, 2017 - 2029
- Figure 201:
- GLOBAL FEED YEAST MARKET, VALUE SHARE(%), BY SUB ADDITIVE, 2022 - 2029
- Figure 202:
- GLOBAL FEED YEAST MARKET, BY COUNTRY, VOLUME, METRIC TON, 2017 - 2029
- Figure 203:
- GLOBAL FEED YEAST MARKET, BY COUNTRY, VALUE, USD, 2017 - 2029
- Figure 204:
- GLOBAL FEED YEAST MARKET, VALUE SHARE(%), BY SUB ADDITIVE, 2022 - 2029
- Figure 205:
- GLOBAL FEED YEAST MARKET, BY COUNTRY, VOLUME, METRIC TON, 2017 - 2029
- Figure 206:
- GLOBAL FEED YEAST MARKET, BY COUNTRY, VALUE, USD, 2017 - 2029
- Figure 207:
- GLOBAL FEED YEAST MARKET, VALUE SHARE(%), BY SUB ADDITIVE, 2022 - 2029
- Figure 208:
- GLOBAL FEED YEAST MARKET, BY COUNTRY, VOLUME, METRIC TON, 2017 - 2029
- Figure 209:
- GLOBAL FEED YEAST MARKET, BY COUNTRY, VALUE, USD, 2017 - 2029
- Figure 210:
- GLOBAL FEED YEAST MARKET, VALUE SHARE(%), BY SUB ADDITIVE, 2022 - 2029
- Figure 211:
- GLOBAL FEED YEAST MARKET, MOST ACTIVE COMPANIES, BY NUMBER OF STRATEGIC MOVES, 2016 - 2022
- Figure 212:
- GLOBAL FEED YEAST MARKET, MOST ADOPTED STRATEGIES, 2016 - 2022
- Figure 213:
- GLOBAL FEED YEAST MARKET SHARE(%), BY MAJOR PLAYERS, 2022
Feed Yeast Industry Segmentation
Live Yeast, Selenium Yeast, Spent Yeast, Torula Dried Yeast, Whey Yeast, Yeast Derivatives are covered as segments by Sub Additive. Aquaculture, Poultry, Ruminants, Swine are covered as segments by Animal. Africa, Asia-Pacific, Europe, Middle East, North America, South America are covered as segments by Region.| Sub Additive | |
| Live Yeast | |
| Selenium Yeast | |
| Spent Yeast | |
| Torula Dried Yeast | |
| Whey Yeast | |
| Yeast Derivatives |
| Animal | |||||||
| |||||||
| |||||||
| |||||||
| Swine | |||||||
| Other Animals |
| Region | ||||||||||||||
| ||||||||||||||
| ||||||||||||||
| ||||||||||||||
| ||||||||||||||
| ||||||||||||||
|
Market Definition
- FUNCTIONS - For the purpose of the study, feed additives are considered to be commercially-manufactured products that are used to enhance the characteristics such as weight gain, feed conversion ratio, and feed intake when fed in appropriate proportions.
- RESELLERS - Companies engaged in reselling of feed additives without value addition have been excluded from the market scope, in order to avoid double counting.
- END CONSUMERS - Compound feed manufacturers are considered to be end-consumers in the market studied. The scope excludes farmers buying feed additives to be used directly as supplements or premixes.
- INTERNAL COMPANY CONSUMPTION - Companies engaged in the production of compound feed as well as the manufacturing of feed additives are part of the study. However, while estimating the market sizes, the internal consumption of feed additives by such companies has been excluded.
Research Methodology
Mordor Intelligence follows a four-step methodology in all our reports.
- Step-1: Identify Key Variables: The quantifiable key variables (industry and extraneous) pertaining to the specific product segment and country are selected from a group of relevant variables & factors based on desk research & literature review; along with primary expert inputs. These variables are further confirmed through regression modeling (wherever required).
- Step-2: Build a Market Model: In order to build a robust forecasting methodology, the variables and factors identified in Step-1 are tested against available historical market numbers. Through an iterative process, the variables required for market forecast are set and the model is built on the basis of these variables.
- Step-3: Validate and Finalize: In this important step, all market numbers, variables and analyst calls are validated through an extensive network of primary research experts from the market studied. The respondents are selected across levels and functions to generate a holistic picture of the market studied.
- Step-4: Research Outputs: Syndicated Reports, Custom Consulting Assignments, Databases & Subscription Platforms


