Onion Seed Market Size

| Icons | Lable | Value |
|---|---|---|
|
|
Study Period | 2016 - 2028 |
|
|
Base Year For Estimation | 2021 |
|
|
CAGR | 5.46 % |
|
|
Largest Share by Breeding Technology | Hybrids |
|
|
Largest Share by Region | Europe |
|
|
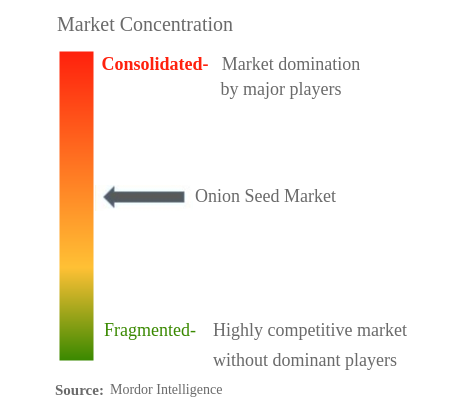
Market Concentration | High |
Major Players |
||
|
|
||
|
*Disclaimer: Major Players sorted in no particular order |
Onion Seed Market Analysis
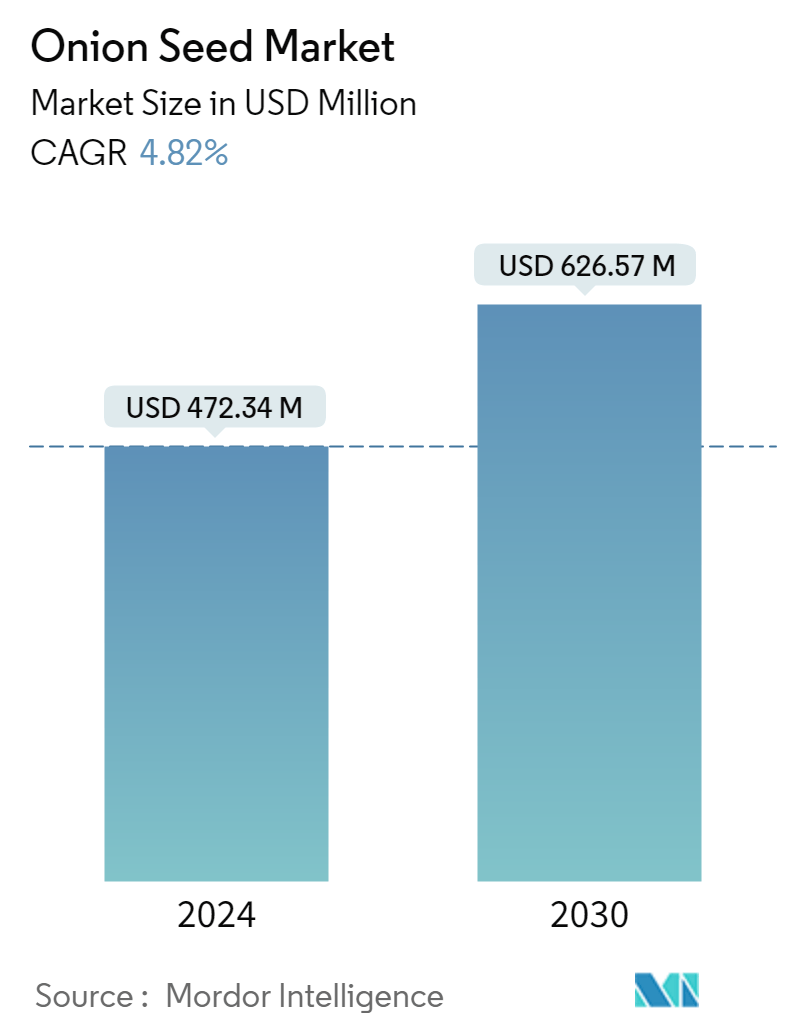
The Onion Seed Market is projected to register a CAGR of 5.46%
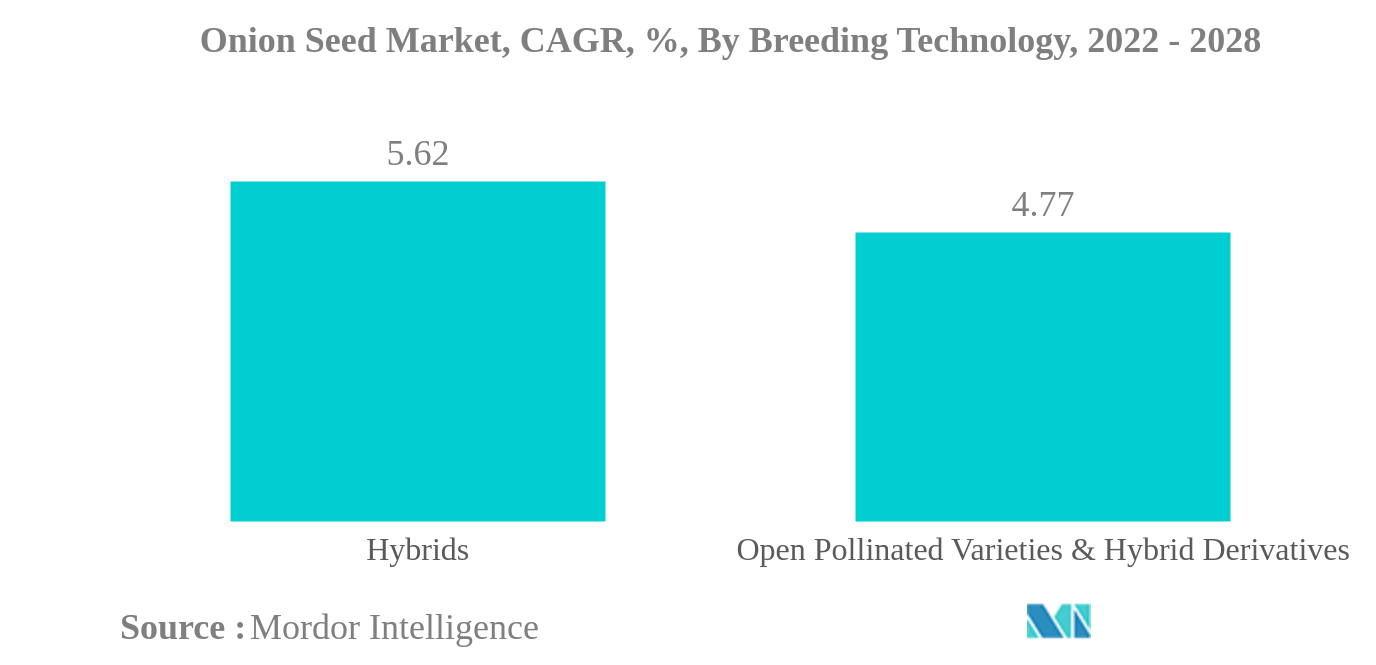
- Hybrids is the Largest Breeding Technology: Higher usage of hybrids is associated with the uniform bulb size, disease resistance, high yielding, and long shelf life and storage life along with the uniform color.
- United States is the Largest Country: The United States is one of the major producers of onions which is supported by favorable climatic conditions, the development of improved hybrids, and high export potential.
- Hybrids is the Fastest-growing Breeding Technology: The high demand for hybrids is due to advantages over open pollinated varieties such as low pungency, increased shelf life, uniform bulb size, and wider adaptability.
- Poland is the Fastest-growing Country: Onion is one of the most common vegetables cultivated in Poland. The increasing area under cultivation and high global demand for onions is enhancing the growth of the market.
Onion Seed Market Trends
This section covers the major market trends shaping the Onion Seed Market according to our research experts:
Hybrids is the largest Breeding Technology
- Globally, the onion seed market is dominated by hybrids, where the value of the market is growing consistently in the forecast period.
- The hybrid onion seed market was more popular than the open-pollinated varieties and hybrid derivatives in all the regions of the world. Europe was the largest region with respect to the onion seed market in 2021, accounting for 30.6% of the global onion seed market.
- In 2021, North America was the second-largest onion seed market in the world. The United States and Canada are the largest countries in the region, where 98.1% and 97.8% of the total market is occupied by hybrid seeds.
- However, Asia-Pacific was the largest region in the world with respect to the OPVs in the cultivation of onion, accounting for 40.8% of the global OPV onion seed market in 2021. It is associated with an increase in the usage of OPVs in developing countries and the preference for their taste and quality over hybrids.
- India was the largest country in the world with respect to the OPVs seed market of onion in 2021, accounting for 21.7% of the global OPVs onion seed market. The high hybrid costs and the preference of consumers are the major drivers for OPVs in the country.
- Pakistan is the fastest-growing country with respect to OPVs, which is growing at a 6.6% rate in the forecast period.
- The increases in the demand for onions in all countries, the increase in climate change effects in the developed countries, the ability to adapt to the stress conditions, increasing market prices, etc., are attracting farmers toward hybrids. Therefore, hybrids are registering a CAGR of 5.6%, globally, faster than the OPVs in the forecast period.
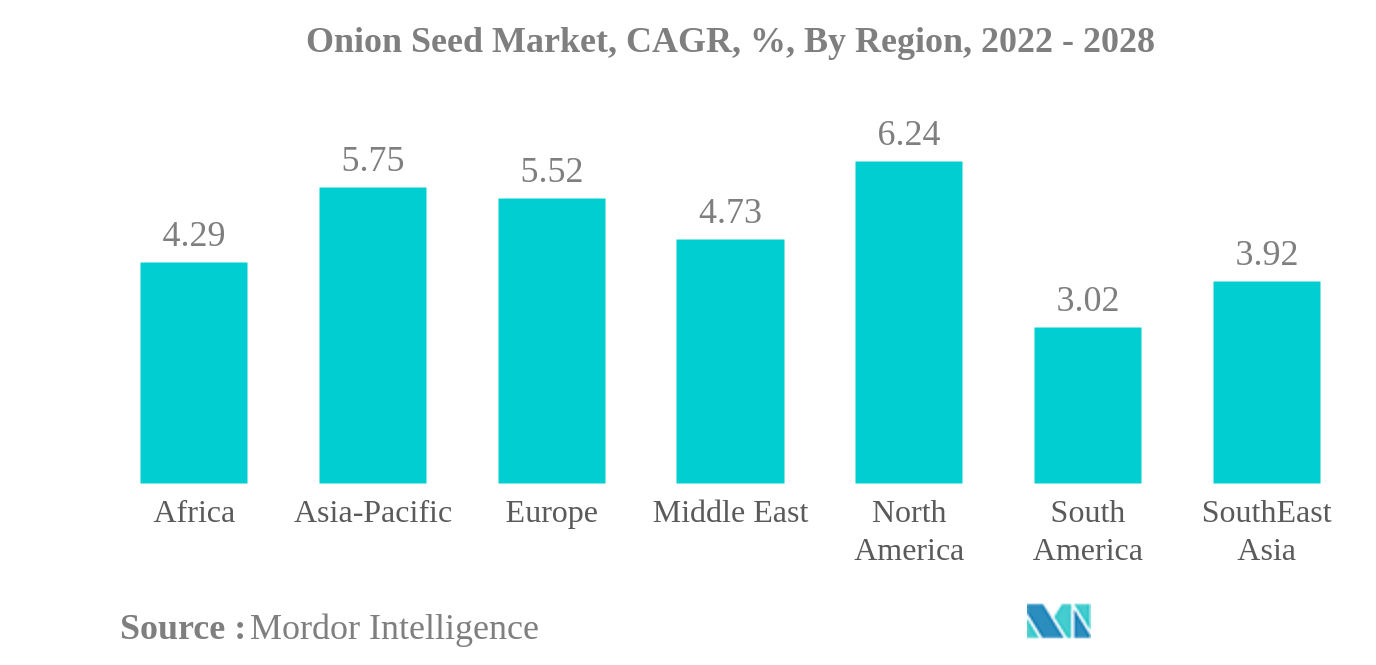
Europe is the largest Region
- In 2021, Africa had a 9.9% share value in the global onion seed market. The market is expected to register a 4.3% CAGR because of the increasing sowing area in major producing countries.
- The Asia-Pacific region accounted for 22.6% of the global onion seed market in terms of value in the country in 2021. It is cultivated throughout the region, especially in the Rabi season.
- In Europe, the Netherlands held the major share owing to the expansion of the harvesting area. For instance, the harvesting area increased to 13,020 ha in 2021 from 12,710 ha in 2016. During this period, the seed value has increased because of an increase in the adoption of commercial seeds.
- In North America, the United States was the largest onion seed market, accounting for 1.6% of the total onion production acreage in the world in 2021. However, Mexico is the fastest-growing country in the region with respect to the onion seed market value, as there is an increase in the production and demand in domestic as well as international markets.
- In the major producing countries of South America, such as Brazil and Argentina, onion is the major root and bulb crop, contributing about 45.3% and 31.0% of the respective root and bulb seed market in 2021. The demand is associated with consumption in both countries.
- The onion seed market accounted for 3.1% of the total vegetable seed market in the Middle East in 2021. The usage of onion in almost every meal is expected to increase the market share in the forecast period. In the Middle East, the Rest of the Middle East countries, such as Kuwait and UAE, are the largest onion seed markets, accounting for 49.5% of the total onion seed market value of the Middle East in 2021.
Onion Seed Industry Overview
The Onion Seed Market is moderately consolidated, with the top five companies occupying 56.47%. The major players in this market are BASF SE, Bayer AG, East-West Seed, Groupe Limagrain and Sakata Seeds Corporation (sorted alphabetically).
Onion Seed Market Leaders
BASF SE
Bayer AG
East-West Seed
Groupe Limagrain
Sakata Seeds Corporation
*Disclaimer: Major Players sorted in no particular order
Onion Seed Market News
- February 2022: BASF’s vegetable seeds business developed a tearless onion varietys. While onions usually become more pungent while being stored, this variety becomes milder and sweeter over time. This variety is now available at supermarkets in France, Germany, Italy, and United Kingdom.
- July 2019: Takii and Go Products, a Dutch onion set producer, have a long history of successful collaboration and have launched a new brand Unio for onions.
Onion Seed Market Report - Table of Contents
EXECUTIVE SUMMARY & KEY FINDINGS
REPORT OFFERS
1. INTRODUCTION
1.1. Study Assumptions & Market Definition
1.2. Scope of the Study
1.3. Research Methodology
2. KEY INDUSTRY TRENDS
2.1. Area Under Cultivation
2.2. Most Popular Traits
2.3. Regulatory Framework
2.4. Value Chain & Distribution Channel Analysis
3. MARKET SEGMENTATION
3.1. Breeding Technology
3.1.1. Hybrids
3.1.2. Open Pollinated Varieties & Hybrid Derivatives
3.2. Region
3.2.1. Africa
3.2.1.1. By Breeding Technology
3.2.1.2. By Country
3.2.1.2.1. Egypt
3.2.1.2.2. Ethiopia
3.2.1.2.3. Ghana
3.2.1.2.4. Kenya
3.2.1.2.5. Nigeria
3.2.1.2.6. South Africa
3.2.1.2.7. Tanzania
3.2.1.2.8. Rest of Africa
3.2.2. Asia-Pacific
3.2.2.1. By Breeding Technology
3.2.2.2. By Country
3.2.2.2.1. Australia
3.2.2.2.2. Bangladesh
3.2.2.2.3. China
3.2.2.2.4. India
3.2.2.2.5. Indonesia
3.2.2.2.6. Japan
3.2.2.2.7. Myanmar
3.2.2.2.8. Pakistan
3.2.2.2.9. Philippines
3.2.2.2.10. Thailand
3.2.2.2.11. Vietnam
3.2.2.2.12. Rest of Asia-Pacific
3.2.3. Europe
3.2.3.1. By Breeding Technology
3.2.3.2. By Country
3.2.3.2.1. France
3.2.3.2.2. Germany
3.2.3.2.3. Italy
3.2.3.2.4. Netherlands
3.2.3.2.5. Poland
3.2.3.2.6. Romania
3.2.3.2.7. Russia
3.2.3.2.8. Spain
3.2.3.2.9. Turkey
3.2.3.2.10. Ukraine
3.2.3.2.11. United Kingdom
3.2.3.2.12. Rest of Europe
3.2.4. Middle East
3.2.4.1. By Breeding Technology
3.2.4.2. By Country
3.2.4.2.1. Iran
3.2.4.2.2. Saudi Arabia
3.2.4.2.3. Rest of Middle East
3.2.5. North America
3.2.5.1. By Breeding Technology
3.2.5.2. By Country
3.2.5.2.1. Canada
3.2.5.2.2. Mexico
3.2.5.2.3. United States
3.2.5.2.4. Rest of North America
3.2.6. South America
3.2.6.1. By Breeding Technology
3.2.6.2. By Country
3.2.6.2.1. Argentina
3.2.6.2.2. Brazil
3.2.6.2.3. Rest of South America
4. COMPETITIVE LANDSCAPE
4.1. Key Strategic Moves
4.2. Market Share Analysis
4.3. Company Landscape
4.4. Company Profiles
4.4.1. BASF SE
4.4.2. Bayer AG
4.4.3. Bejo Zaden B.V.
4.4.4. East-West Seed
4.4.5. Enza Zaden
4.4.6. Groupe Limagrain
4.4.7. Nong Woo Bio
4.4.8. Sakata Seeds Corporation
4.4.9. Takii and Co.,Ltd.
5. KEY STRATEGIC QUESTIONS FOR SEEDS CEOS
6. APPENDIX
6.1. Global Overview
6.1.1. Overview
6.1.2. Porter’s Five Forces Framework
6.1.3. Global Value Chain Analysis
6.1.4. Global Market Size and DROs
6.2. Sources & References
6.3. List of Tables & Figures
6.4. Primary Insights
6.5. Data Pack
6.6. Glossary of Terms
List of Tables & Figures
- Figure 1:
- GLOBAL ONION SEED MARKET AREA UNDER CULTIVATION, HECTARE, 2016 - 2021
- Figure 2:
- GLOBAL ONION SEED MARKET, MAJOR TRAITS VALUE SHARE(%), ONION, 2021
- Figure 3:
- GLOBAL ONION SEED MARKET, VOLUME, METRIC TON, 2016 - 2028
- Figure 4:
- GLOBAL ONION SEED MARKET, VALUE, USD, 2016 - 2028
- Figure 5:
- GLOBAL ONION SEED MARKET, BY BREEDING TECHNOLOGY, VOLUME, METRIC TON, 2016 - 2028
- Figure 6:
- GLOBAL ONION SEED MARKET, BY BREEDING TECHNOLOGY, VALUE, USD, 2016 - 2028
- Figure 7:
- GLOBAL ONION SEED MARKET, SHARE(%), BY BREEDING TECHNOLOGY, VOLUME, METRIC TON, 2016 VS 2022 VS 2028
- Figure 8:
- GLOBAL ONION SEED MARKET, SHARE(%), BY BREEDING TECHNOLOGY, VALUE, USD, 2016 VS 2022 VS 2028
- Figure 9:
- GLOBAL ONION SEED MARKET, BY BREEDING TECHNOLOGY, VOLUME, METRIC TON, 2016 - 2028
- Figure 10:
- GLOBAL ONION SEED MARKET, BY BREEDING TECHNOLOGY, VALUE, USD, 2016 - 2028
- Figure 11:
- GLOBAL ONION SEED MARKET, SHARE(%), BY COUNTRY, 2021 - 2028
- Figure 12:
- GLOBAL ONION SEED MARKET, BY BREEDING TECHNOLOGY, VOLUME, METRIC TON, 2016 - 2028
- Figure 13:
- GLOBAL ONION SEED MARKET, BY BREEDING TECHNOLOGY, VALUE, USD, 2016 - 2028
- Figure 14:
- GLOBAL ONION SEED MARKET, SHARE(%), BY COUNTRY, 2021 - 2028
- Figure 15:
- GLOBAL ONION SEED MARKET, BY REGION, VOLUME, METRIC TON, 2016 - 2028
- Figure 16:
- GLOBAL ONION SEED MARKET, BY REGION, VALUE, USD, 2016 - 2028
- Figure 17:
- GLOBAL ONION SEED MARKET, SHARE(%), BY REGION, VOLUME, METRIC TON, 2016 VS 2022 VS 2028
- Figure 18:
- GLOBAL ONION SEED MARKET, SHARE(%), BY REGION, VALUE, USD, 2016 VS 2022 VS 2028
- Figure 19:
- GLOBAL ONION SEED MARKET, BY BREEDING TECHNOLOGY, VOLUME, METRIC TON, AFRICA, 2016 - 2028
- Figure 20:
- GLOBAL ONION SEED MARKET, BY BREEDING TECHNOLOGY, VALUE, USD, AFRICA, 2016 - 2028
- Figure 21:
- GLOBAL ONION SEED MARKET, SHARE(%), BY BREEDING TECHNOLOGY, VOLUME, METRIC TON, AFRICA, 2016 VS 2022 VS 2028
- Figure 22:
- GLOBAL ONION SEED MARKET, SHARE(%), BY BREEDING TECHNOLOGY, VALUE, USD, AFRICA, 2016 VS 2022 VS 2028
- Figure 23:
- GLOBAL ONION SEED MARKET, BY COUNTRY, VOLUME, METRIC TON, AFRICA, 2016 - 2028
- Figure 24:
- GLOBAL ONION SEED MARKET, BY COUNTRY, VALUE, USD, AFRICA, 2016 - 2028
- Figure 25:
- GLOBAL ONION SEED MARKET, SHARE(%), BY COUNTRY, VOLUME, METRIC TON, AFRICA, 2016 VS 2022 VS 2028
- Figure 26:
- GLOBAL ONION SEED MARKET, SHARE(%), BY COUNTRY, VALUE, USD, AFRICA, 2016 VS 2022 VS 2028
- Figure 27:
- GLOBAL ONION SEED MARKET, BY COUNTRY, VOLUME, METRIC TON, 2016 - 2028
- Figure 28:
- GLOBAL ONION SEED MARKET, BY COUNTRY, VALUE, USD, 2016 - 2028
- Figure 29:
- GLOBAL ONION SEED MARKET, SHARE(%), BY BREEDING TECHNOLOGY, 2021 - 2028
- Figure 30:
- GLOBAL ONION SEED MARKET, BY COUNTRY, VOLUME, METRIC TON, 2016 - 2028
- Figure 31:
- GLOBAL ONION SEED MARKET, BY COUNTRY, VALUE, USD, 2016 - 2028
- Figure 32:
- GLOBAL ONION SEED MARKET, SHARE(%), BY BREEDING TECHNOLOGY, 2021 - 2028
- Figure 33:
- GLOBAL ONION SEED MARKET, BY COUNTRY, VOLUME, METRIC TON, 2016 - 2028
- Figure 34:
- GLOBAL ONION SEED MARKET, BY COUNTRY, VALUE, USD, 2016 - 2028
- Figure 35:
- GLOBAL ONION SEED MARKET, SHARE(%), BY BREEDING TECHNOLOGY, 2021 - 2028
- Figure 36:
- GLOBAL ONION SEED MARKET, BY COUNTRY, VOLUME, METRIC TON, 2016 - 2028
- Figure 37:
- GLOBAL ONION SEED MARKET, BY COUNTRY, VALUE, USD, 2016 - 2028
- Figure 38:
- GLOBAL ONION SEED MARKET, SHARE(%), BY BREEDING TECHNOLOGY, 2021 - 2028
- Figure 39:
- GLOBAL ONION SEED MARKET, BY COUNTRY, VOLUME, METRIC TON, 2016 - 2028
- Figure 40:
- GLOBAL ONION SEED MARKET, BY COUNTRY, VALUE, USD, 2016 - 2028
- Figure 41:
- GLOBAL ONION SEED MARKET, SHARE(%), BY BREEDING TECHNOLOGY, 2021 - 2028
- Figure 42:
- GLOBAL ONION SEED MARKET, BY COUNTRY, VOLUME, METRIC TON, 2016 - 2028
- Figure 43:
- GLOBAL ONION SEED MARKET, BY COUNTRY, VALUE, USD, 2016 - 2028
- Figure 44:
- GLOBAL ONION SEED MARKET, SHARE(%), BY BREEDING TECHNOLOGY, 2021 - 2028
- Figure 45:
- GLOBAL ONION SEED MARKET, BY COUNTRY, VOLUME, METRIC TON, 2016 - 2028
- Figure 46:
- GLOBAL ONION SEED MARKET, BY COUNTRY, VALUE, USD, 2016 - 2028
- Figure 47:
- GLOBAL ONION SEED MARKET, SHARE(%), BY BREEDING TECHNOLOGY, 2021 - 2028
- Figure 48:
- GLOBAL ONION SEED MARKET, BY COUNTRY, VOLUME, METRIC TON, 2016 - 2028
- Figure 49:
- GLOBAL ONION SEED MARKET, BY COUNTRY, VALUE, USD, 2016 - 2028
- Figure 50:
- GLOBAL ONION SEED MARKET, SHARE(%), BY BREEDING TECHNOLOGY, 2021 - 2028
- Figure 51:
- GLOBAL ONION SEED MARKET, BY BREEDING TECHNOLOGY, VOLUME, METRIC TON, ASIA-PACIFIC, 2016 - 2028
- Figure 52:
- GLOBAL ONION SEED MARKET, BY BREEDING TECHNOLOGY, VALUE, USD, ASIA-PACIFIC, 2016 - 2028
- Figure 53:
- GLOBAL ONION SEED MARKET, SHARE(%), BY BREEDING TECHNOLOGY, VOLUME, METRIC TON, ASIA-PACIFIC, 2016 VS 2022 VS 2028
- Figure 54:
- GLOBAL ONION SEED MARKET, SHARE(%), BY BREEDING TECHNOLOGY, VALUE, USD, ASIA-PACIFIC, 2016 VS 2022 VS 2028
- Figure 55:
- GLOBAL ONION SEED MARKET, BY COUNTRY, VOLUME, METRIC TON, ASIA-PACIFIC, 2016 - 2028
- Figure 56:
- GLOBAL ONION SEED MARKET, BY COUNTRY, VALUE, USD, ASIA-PACIFIC, 2016 - 2028
- Figure 57:
- GLOBAL ONION SEED MARKET, SHARE(%), BY COUNTRY, VOLUME, METRIC TON, ASIA-PACIFIC, 2016 VS 2022 VS 2028
- Figure 58:
- GLOBAL ONION SEED MARKET, SHARE(%), BY COUNTRY, VALUE, USD, ASIA-PACIFIC, 2016 VS 2022 VS 2028
- Figure 59:
- GLOBAL ONION SEED MARKET, BY COUNTRY, VOLUME, METRIC TON, 2016 - 2028
- Figure 60:
- GLOBAL ONION SEED MARKET, BY COUNTRY, VALUE, USD, 2016 - 2028
- Figure 61:
- GLOBAL ONION SEED MARKET, SHARE(%), BY BREEDING TECHNOLOGY, 2021 - 2028
- Figure 62:
- GLOBAL ONION SEED MARKET, BY COUNTRY, VOLUME, METRIC TON, 2016 - 2028
- Figure 63:
- GLOBAL ONION SEED MARKET, BY COUNTRY, VALUE, USD, 2016 - 2028
- Figure 64:
- GLOBAL ONION SEED MARKET, SHARE(%), BY BREEDING TECHNOLOGY, 2021 - 2028
- Figure 65:
- GLOBAL ONION SEED MARKET, BY COUNTRY, VOLUME, METRIC TON, 2016 - 2028
- Figure 66:
- GLOBAL ONION SEED MARKET, BY COUNTRY, VALUE, USD, 2016 - 2028
- Figure 67:
- GLOBAL ONION SEED MARKET, SHARE(%), BY BREEDING TECHNOLOGY, 2021 - 2028
- Figure 68:
- GLOBAL ONION SEED MARKET, BY COUNTRY, VOLUME, METRIC TON, 2016 - 2028
- Figure 69:
- GLOBAL ONION SEED MARKET, BY COUNTRY, VALUE, USD, 2016 - 2028
- Figure 70:
- GLOBAL ONION SEED MARKET, SHARE(%), BY BREEDING TECHNOLOGY, 2021 - 2028
- Figure 71:
- GLOBAL ONION SEED MARKET, BY COUNTRY, VOLUME, METRIC TON, 2016 - 2028
- Figure 72:
- GLOBAL ONION SEED MARKET, BY COUNTRY, VALUE, USD, 2016 - 2028
- Figure 73:
- GLOBAL ONION SEED MARKET, SHARE(%), BY BREEDING TECHNOLOGY, 2021 - 2028
- Figure 74:
- GLOBAL ONION SEED MARKET, BY COUNTRY, VOLUME, METRIC TON, 2016 - 2028
- Figure 75:
- GLOBAL ONION SEED MARKET, BY COUNTRY, VALUE, USD, 2016 - 2028
- Figure 76:
- GLOBAL ONION SEED MARKET, SHARE(%), BY BREEDING TECHNOLOGY, 2021 - 2028
- Figure 77:
- GLOBAL ONION SEED MARKET, BY COUNTRY, VOLUME, METRIC TON, 2016 - 2028
- Figure 78:
- GLOBAL ONION SEED MARKET, BY COUNTRY, VALUE, USD, 2016 - 2028
- Figure 79:
- GLOBAL ONION SEED MARKET, SHARE(%), BY BREEDING TECHNOLOGY, 2021 - 2028
- Figure 80:
- GLOBAL ONION SEED MARKET, BY COUNTRY, VOLUME, METRIC TON, 2016 - 2028
- Figure 81:
- GLOBAL ONION SEED MARKET, BY COUNTRY, VALUE, USD, 2016 - 2028
- Figure 82:
- GLOBAL ONION SEED MARKET, SHARE(%), BY BREEDING TECHNOLOGY, 2021 - 2028
- Figure 83:
- GLOBAL ONION SEED MARKET, BY COUNTRY, VOLUME, METRIC TON, 2016 - 2028
- Figure 84:
- GLOBAL ONION SEED MARKET, BY COUNTRY, VALUE, USD, 2016 - 2028
- Figure 85:
- GLOBAL ONION SEED MARKET, SHARE(%), BY BREEDING TECHNOLOGY, 2021 - 2028
- Figure 86:
- GLOBAL ONION SEED MARKET, BY COUNTRY, VOLUME, METRIC TON, 2016 - 2028
- Figure 87:
- GLOBAL ONION SEED MARKET, BY COUNTRY, VALUE, USD, 2016 - 2028
- Figure 88:
- GLOBAL ONION SEED MARKET, SHARE(%), BY BREEDING TECHNOLOGY, 2021 - 2028
- Figure 89:
- GLOBAL ONION SEED MARKET, BY COUNTRY, VOLUME, METRIC TON, 2016 - 2028
- Figure 90:
- GLOBAL ONION SEED MARKET, BY COUNTRY, VALUE, USD, 2016 - 2028
- Figure 91:
- GLOBAL ONION SEED MARKET, SHARE(%), BY BREEDING TECHNOLOGY, 2021 - 2028
- Figure 92:
- GLOBAL ONION SEED MARKET, BY COUNTRY, VOLUME, METRIC TON, 2016 - 2028
- Figure 93:
- GLOBAL ONION SEED MARKET, BY COUNTRY, VALUE, USD, 2016 - 2028
- Figure 94:
- GLOBAL ONION SEED MARKET, SHARE(%), BY BREEDING TECHNOLOGY, 2021 - 2028
- Figure 95:
- GLOBAL ONION SEED MARKET, BY BREEDING TECHNOLOGY, VOLUME, METRIC TON, EUROPE, 2016 - 2028
- Figure 96:
- GLOBAL ONION SEED MARKET, BY BREEDING TECHNOLOGY, VALUE, USD, EUROPE, 2016 - 2028
- Figure 97:
- GLOBAL ONION SEED MARKET, SHARE(%), BY BREEDING TECHNOLOGY, VOLUME, METRIC TON, EUROPE, 2016 VS 2022 VS 2028
- Figure 98:
- GLOBAL ONION SEED MARKET, SHARE(%), BY BREEDING TECHNOLOGY, VALUE, USD, EUROPE, 2016 VS 2022 VS 2028
- Figure 99:
- GLOBAL ONION SEED MARKET, BY COUNTRY, VOLUME, METRIC TON, EUROPE, 2016 - 2028
- Figure 100:
- GLOBAL ONION SEED MARKET, BY COUNTRY, VALUE, USD, EUROPE, 2016 - 2028
- Figure 101:
- GLOBAL ONION SEED MARKET, SHARE(%), BY COUNTRY, VOLUME, METRIC TON, EUROPE, 2016 VS 2022 VS 2028
- Figure 102:
- GLOBAL ONION SEED MARKET, SHARE(%), BY COUNTRY, VALUE, USD, EUROPE, 2016 VS 2022 VS 2028
- Figure 103:
- GLOBAL ONION SEED MARKET, BY COUNTRY, VOLUME, METRIC TON, 2016 - 2028
- Figure 104:
- GLOBAL ONION SEED MARKET, BY COUNTRY, VALUE, USD, 2016 - 2028
- Figure 105:
- GLOBAL ONION SEED MARKET, SHARE(%), BY BREEDING TECHNOLOGY, 2021 - 2028
- Figure 106:
- GLOBAL ONION SEED MARKET, BY COUNTRY, VOLUME, METRIC TON, 2016 - 2028
- Figure 107:
- GLOBAL ONION SEED MARKET, BY COUNTRY, VALUE, USD, 2016 - 2028
- Figure 108:
- GLOBAL ONION SEED MARKET, SHARE(%), BY BREEDING TECHNOLOGY, 2021 - 2028
- Figure 109:
- GLOBAL ONION SEED MARKET, BY COUNTRY, VOLUME, METRIC TON, 2016 - 2028
- Figure 110:
- GLOBAL ONION SEED MARKET, BY COUNTRY, VALUE, USD, 2016 - 2028
- Figure 111:
- GLOBAL ONION SEED MARKET, SHARE(%), BY BREEDING TECHNOLOGY, 2021 - 2028
- Figure 112:
- GLOBAL ONION SEED MARKET, BY COUNTRY, VOLUME, METRIC TON, 2016 - 2028
- Figure 113:
- GLOBAL ONION SEED MARKET, BY COUNTRY, VALUE, USD, 2016 - 2028
- Figure 114:
- GLOBAL ONION SEED MARKET, SHARE(%), BY BREEDING TECHNOLOGY, 2021 - 2028
- Figure 115:
- GLOBAL ONION SEED MARKET, BY COUNTRY, VOLUME, METRIC TON, 2016 - 2028
- Figure 116:
- GLOBAL ONION SEED MARKET, BY COUNTRY, VALUE, USD, 2016 - 2028
- Figure 117:
- GLOBAL ONION SEED MARKET, SHARE(%), BY BREEDING TECHNOLOGY, 2021 - 2028
- Figure 118:
- GLOBAL ONION SEED MARKET, BY COUNTRY, VOLUME, METRIC TON, 2016 - 2028
- Figure 119:
- GLOBAL ONION SEED MARKET, BY COUNTRY, VALUE, USD, 2016 - 2028
- Figure 120:
- GLOBAL ONION SEED MARKET, SHARE(%), BY BREEDING TECHNOLOGY, 2021 - 2028
- Figure 121:
- GLOBAL ONION SEED MARKET, BY COUNTRY, VOLUME, METRIC TON, 2016 - 2028
- Figure 122:
- GLOBAL ONION SEED MARKET, BY COUNTRY, VALUE, USD, 2016 - 2028
- Figure 123:
- GLOBAL ONION SEED MARKET, SHARE(%), BY BREEDING TECHNOLOGY, 2021 - 2028
- Figure 124:
- GLOBAL ONION SEED MARKET, BY COUNTRY, VOLUME, METRIC TON, 2016 - 2028
- Figure 125:
- GLOBAL ONION SEED MARKET, BY COUNTRY, VALUE, USD, 2016 - 2028
- Figure 126:
- GLOBAL ONION SEED MARKET, SHARE(%), BY BREEDING TECHNOLOGY, 2021 - 2028
- Figure 127:
- GLOBAL ONION SEED MARKET, BY COUNTRY, VOLUME, METRIC TON, 2016 - 2028
- Figure 128:
- GLOBAL ONION SEED MARKET, BY COUNTRY, VALUE, USD, 2016 - 2028
- Figure 129:
- GLOBAL ONION SEED MARKET, SHARE(%), BY BREEDING TECHNOLOGY, 2021 - 2028
- Figure 130:
- GLOBAL ONION SEED MARKET, BY COUNTRY, VOLUME, METRIC TON, 2016 - 2028
- Figure 131:
- GLOBAL ONION SEED MARKET, BY COUNTRY, VALUE, USD, 2016 - 2028
- Figure 132:
- GLOBAL ONION SEED MARKET, SHARE(%), BY BREEDING TECHNOLOGY, 2021 - 2028
- Figure 133:
- GLOBAL ONION SEED MARKET, BY COUNTRY, VOLUME, METRIC TON, 2016 - 2028
- Figure 134:
- GLOBAL ONION SEED MARKET, BY COUNTRY, VALUE, USD, 2016 - 2028
- Figure 135:
- GLOBAL ONION SEED MARKET, SHARE(%), BY BREEDING TECHNOLOGY, 2021 - 2028
- Figure 136:
- GLOBAL ONION SEED MARKET, BY COUNTRY, VOLUME, METRIC TON, 2016 - 2028
- Figure 137:
- GLOBAL ONION SEED MARKET, BY COUNTRY, VALUE, USD, 2016 - 2028
- Figure 138:
- GLOBAL ONION SEED MARKET, SHARE(%), BY BREEDING TECHNOLOGY, 2021 - 2028
- Figure 139:
- GLOBAL ONION SEED MARKET, BY BREEDING TECHNOLOGY, VOLUME, METRIC TON, MIDDLE EAST, 2016 - 2028
- Figure 140:
- GLOBAL ONION SEED MARKET, BY BREEDING TECHNOLOGY, VALUE, USD, MIDDLE EAST, 2016 - 2028
- Figure 141:
- GLOBAL ONION SEED MARKET, SHARE(%), BY BREEDING TECHNOLOGY, VOLUME, METRIC TON, MIDDLE EAST, 2016 VS 2022 VS 2028
- Figure 142:
- GLOBAL ONION SEED MARKET, SHARE(%), BY BREEDING TECHNOLOGY, VALUE, USD, MIDDLE EAST, 2016 VS 2022 VS 2028
- Figure 143:
- GLOBAL ONION SEED MARKET, BY COUNTRY, VOLUME, METRIC TON, MIDDLE EAST, 2016 - 2028
- Figure 144:
- GLOBAL ONION SEED MARKET, BY COUNTRY, VALUE, USD, MIDDLE EAST, 2016 - 2028
- Figure 145:
- GLOBAL ONION SEED MARKET, SHARE(%), BY COUNTRY, VOLUME, METRIC TON, MIDDLE EAST, 2016 VS 2022 VS 2028
- Figure 146:
- GLOBAL ONION SEED MARKET, SHARE(%), BY COUNTRY, VALUE, USD, MIDDLE EAST, 2016 VS 2022 VS 2028
- Figure 147:
- GLOBAL ONION SEED MARKET, BY COUNTRY, VOLUME, METRIC TON, 2016 - 2028
- Figure 148:
- GLOBAL ONION SEED MARKET, BY COUNTRY, VALUE, USD, 2016 - 2028
- Figure 149:
- GLOBAL ONION SEED MARKET, SHARE(%), BY BREEDING TECHNOLOGY, 2021 - 2028
- Figure 150:
- GLOBAL ONION SEED MARKET, BY COUNTRY, VOLUME, METRIC TON, 2016 - 2028
- Figure 151:
- GLOBAL ONION SEED MARKET, BY COUNTRY, VALUE, USD, 2016 - 2028
- Figure 152:
- GLOBAL ONION SEED MARKET, SHARE(%), BY BREEDING TECHNOLOGY, 2021 - 2028
- Figure 153:
- GLOBAL ONION SEED MARKET, BY COUNTRY, VOLUME, METRIC TON, 2016 - 2028
- Figure 154:
- GLOBAL ONION SEED MARKET, BY COUNTRY, VALUE, USD, 2016 - 2028
- Figure 155:
- GLOBAL ONION SEED MARKET, SHARE(%), BY BREEDING TECHNOLOGY, 2021 - 2028
- Figure 156:
- GLOBAL ONION SEED MARKET, BY BREEDING TECHNOLOGY, VOLUME, METRIC TON, NORTH AMERICA, 2016 - 2028
- Figure 157:
- GLOBAL ONION SEED MARKET, BY BREEDING TECHNOLOGY, VALUE, USD, NORTH AMERICA, 2016 - 2028
- Figure 158:
- GLOBAL ONION SEED MARKET, SHARE(%), BY BREEDING TECHNOLOGY, VOLUME, METRIC TON, NORTH AMERICA, 2016 VS 2022 VS 2028
- Figure 159:
- GLOBAL ONION SEED MARKET, SHARE(%), BY BREEDING TECHNOLOGY, VALUE, USD, NORTH AMERICA, 2016 VS 2022 VS 2028
- Figure 160:
- GLOBAL ONION SEED MARKET, BY COUNTRY, VOLUME, METRIC TON, NORTH AMERICA, 2016 - 2028
- Figure 161:
- GLOBAL ONION SEED MARKET, BY COUNTRY, VALUE, USD, NORTH AMERICA, 2016 - 2028
- Figure 162:
- GLOBAL ONION SEED MARKET, SHARE(%), BY COUNTRY, VOLUME, METRIC TON, NORTH AMERICA, 2016 VS 2022 VS 2028
- Figure 163:
- GLOBAL ONION SEED MARKET, SHARE(%), BY COUNTRY, VALUE, USD, NORTH AMERICA, 2016 VS 2022 VS 2028
- Figure 164:
- GLOBAL ONION SEED MARKET, BY COUNTRY, VOLUME, METRIC TON, 2016 - 2028
- Figure 165:
- GLOBAL ONION SEED MARKET, BY COUNTRY, VALUE, USD, 2016 - 2028
- Figure 166:
- GLOBAL ONION SEED MARKET, SHARE(%), BY BREEDING TECHNOLOGY, 2021 - 2028
- Figure 167:
- GLOBAL ONION SEED MARKET, BY COUNTRY, VOLUME, METRIC TON, 2016 - 2028
- Figure 168:
- GLOBAL ONION SEED MARKET, BY COUNTRY, VALUE, USD, 2016 - 2028
- Figure 169:
- GLOBAL ONION SEED MARKET, SHARE(%), BY BREEDING TECHNOLOGY, 2021 - 2028
- Figure 170:
- GLOBAL ONION SEED MARKET, BY COUNTRY, VOLUME, METRIC TON, 2016 - 2028
- Figure 171:
- GLOBAL ONION SEED MARKET, BY COUNTRY, VALUE, USD, 2016 - 2028
- Figure 172:
- GLOBAL ONION SEED MARKET, SHARE(%), BY BREEDING TECHNOLOGY, 2021 - 2028
- Figure 173:
- GLOBAL ONION SEED MARKET, BY COUNTRY, VOLUME, METRIC TON, 2016 - 2028
- Figure 174:
- GLOBAL ONION SEED MARKET, BY COUNTRY, VALUE, USD, 2016 - 2028
- Figure 175:
- GLOBAL ONION SEED MARKET, SHARE(%), BY BREEDING TECHNOLOGY, 2021 - 2028
- Figure 176:
- GLOBAL ONION SEED MARKET, BY BREEDING TECHNOLOGY, VOLUME, METRIC TON, SOUTH AMERICA, 2016 - 2028
- Figure 177:
- GLOBAL ONION SEED MARKET, BY BREEDING TECHNOLOGY, VALUE, USD, SOUTH AMERICA, 2016 - 2028
- Figure 178:
- GLOBAL ONION SEED MARKET, SHARE(%), BY BREEDING TECHNOLOGY, VOLUME, METRIC TON, SOUTH AMERICA, 2016 VS 2022 VS 2028
- Figure 179:
- GLOBAL ONION SEED MARKET, SHARE(%), BY BREEDING TECHNOLOGY, VALUE, USD, SOUTH AMERICA, 2016 VS 2022 VS 2028
- Figure 180:
- GLOBAL ONION SEED MARKET, BY COUNTRY, VOLUME, METRIC TON, SOUTH AMERICA, 2016 - 2028
- Figure 181:
- GLOBAL ONION SEED MARKET, BY COUNTRY, VALUE, USD, SOUTH AMERICA, 2016 - 2028
- Figure 182:
- GLOBAL ONION SEED MARKET, SHARE(%), BY COUNTRY, VOLUME, METRIC TON, SOUTH AMERICA, 2016 VS 2022 VS 2028
- Figure 183:
- GLOBAL ONION SEED MARKET, SHARE(%), BY COUNTRY, VALUE, USD, SOUTH AMERICA, 2016 VS 2022 VS 2028
- Figure 184:
- GLOBAL ONION SEED MARKET, BY COUNTRY, VOLUME, METRIC TON, 2016 - 2028
- Figure 185:
- GLOBAL ONION SEED MARKET, BY COUNTRY, VALUE, USD, 2016 - 2028
- Figure 186:
- GLOBAL ONION SEED MARKET, SHARE(%), BY BREEDING TECHNOLOGY, 2021 - 2028
- Figure 187:
- GLOBAL ONION SEED MARKET, BY COUNTRY, VOLUME, METRIC TON, 2016 - 2028
- Figure 188:
- GLOBAL ONION SEED MARKET, BY COUNTRY, VALUE, USD, 2016 - 2028
- Figure 189:
- GLOBAL ONION SEED MARKET, SHARE(%), BY BREEDING TECHNOLOGY, 2021 - 2028
- Figure 190:
- GLOBAL ONION SEED MARKET, BY COUNTRY, VOLUME, METRIC TON, 2016 - 2028
- Figure 191:
- GLOBAL ONION SEED MARKET, BY COUNTRY, VALUE, USD, 2016 - 2028
- Figure 192:
- GLOBAL ONION SEED MARKET, SHARE(%), BY BREEDING TECHNOLOGY, 2021 - 2028
- Figure 193:
- GLOBAL ONION SEED MARKET, MOST ACTIVE COMPANIES, BY NUMBER OF STRATEGIC MOVES, 2016 - 2021
- Figure 194:
- GLOBAL ONION SEED MARKET, MOST ADOPTED STRATEGIES, 2018 - 2021
- Figure 195:
- GLOBAL ONION SEED MARKET SHARE(%), BY MAJOR PLAYERS, 2021
Onion Seed Industry Segmentation
Hybrids, Open Pollinated Varieties & Hybrid Derivatives are covered as segments by Breeding Technology. Africa, Asia-Pacific, Europe, Middle East, North America, South America are covered as segments by Region.| Breeding Technology | |
| Hybrids | |
| Open Pollinated Varieties & Hybrid Derivatives |
| Region | |||||||||||||||||
| |||||||||||||||||
| |||||||||||||||||
| |||||||||||||||||
| |||||||||||||||||
| |||||||||||||||||
|
Market Definition
- Commercial Seed - For the purpose of this study, only commercial seeds have been included as part of the scope. Farm-saved Seeds, which are not commercially labeled are excluded from scope, even though a minor percentage of farm-saved seeds are exchanged commercially among farmers. The scope also excludes vegetatively reproduced crops and plant parts, which may be commercially sold in the market.
- Crop Acreage - While calculating the acreage under different crops, the Gross Cropped Area has been considered. Also known as Area Harvested, according to the Food & Agricultural Organization (FAO), this includes the total area cultivated under a particular crop across seasons.
- Seed Replacement Rate - Seed Replacement Rate is the percentage of area sown out of the total area of crop planted in the season by using certified/quality seeds other than the farm-saved seed.
- Protected Cultivation - The report defines protected cultivation as the process of growing crops in a controlled environment. This includes greenhouses, glasshouses, hydroponics, aeroponics, or any other cultivation system that protects the crop against any abiotic stress. However, cultivation in an open field using plastic mulch is excluded from this definition and is included under open field.
Research Methodology
Mordor Intelligence follows a four-step methodology in all our reports.
- Step-1: IDENTIFY KEY VARIABLES: In order to build a robust forecasting methodology, the variables and factors identified in Step-1 are tested against available historical market numbers. Through an iterative process, the variables required for market forecast are set and the model is built on the basis of these variables.
- Step-2: Build a Market Model: Market-size estimations for the forecast years are in nominal terms. Inflation is not a part of the pricing, and the average selling price (ASP) is kept constant throughout the forecast period.
- Step-3: Validate and Finalize: In this important step, all market numbers, variables and analyst calls are validated through an extensive network of primary research experts from the market studied. The respondents are selected across levels and functions to generate a holistic picture of the market studied.
- Step-4: Research Outputs: Syndicated Reports, Custom Consulting Assignments, Databases & Subscription Platforms


