India Protein Market Size

| Icons | Lable | Value |
|---|---|---|
|
|
Study Period | 2017 - 2029 |
|
|
Base Year For Estimation | 2022 |
|
|
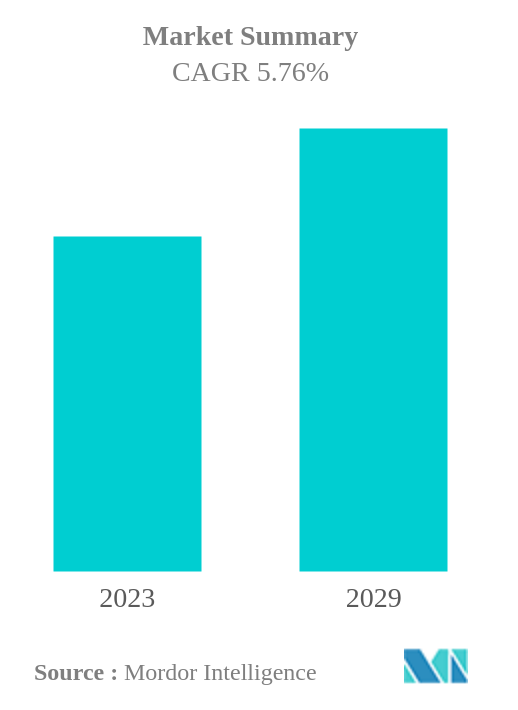
CAGR | 5.76 % |
|
|
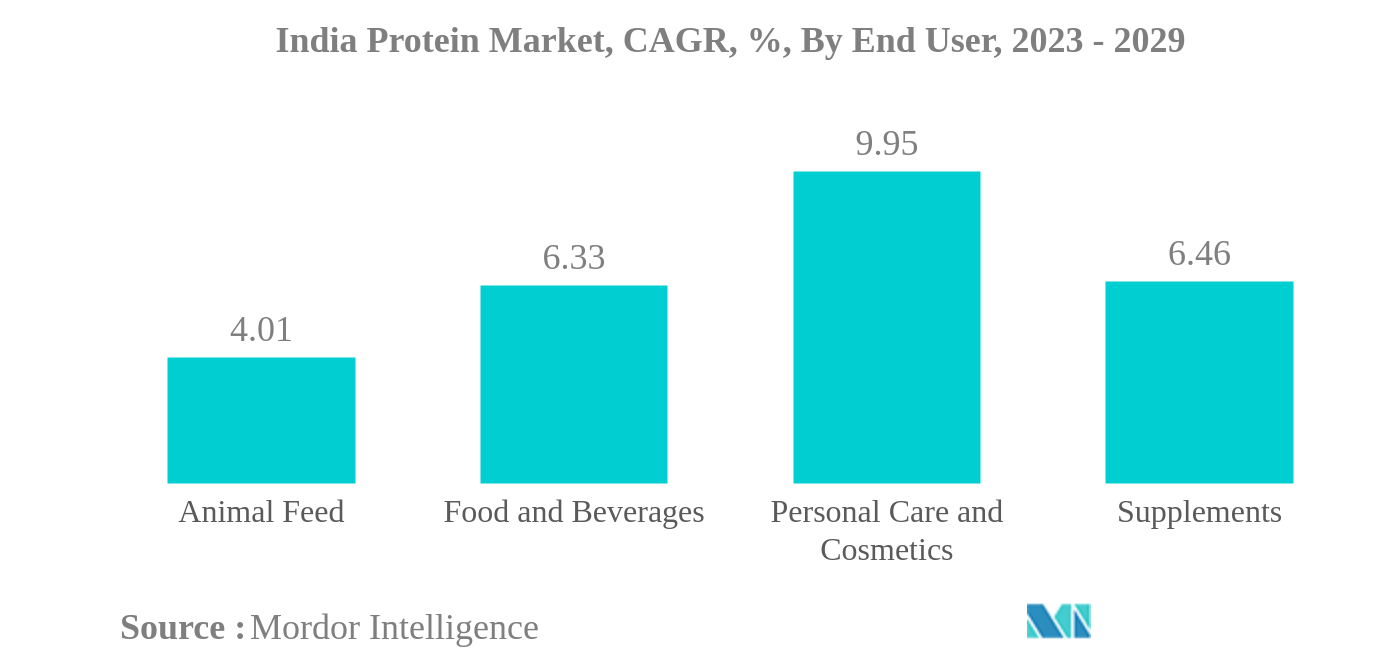
Largest Share by End User | Food and Beverages |
|
|
Fastest Growing by End User | Personal Care and Cosmetics |
|
|
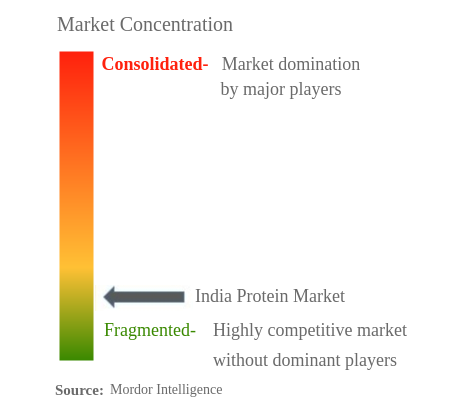
Market Concentration | High |
Major Players |
||
|
|
||
|
*Disclaimer: Major Players sorted in no particular order |
India Protein Market Analysis
The India Protein Market is projected to register a CAGR of 5.76%
- Plant is the Largest Source : Immense availability, functionality, vegan protein source, and low price of soy, wheat, and pea have contributed to the country's leading position of plant proteins.
- Food and Beverages is the Largest End User : F&B is driven mainly by the meat and beverage sectors. The multifunctionalities of plant protein imparted in these products, as well as rising Indian taste for vegan meals.
- Animal is the Fastest-growing Source : Animal proteins with claims such as organic, sustainable, and grass-fed are boosting sales in the segment. Gelatin and collagen are the fastest growing sub-segments.
- Personal Care and Cosmetics is the Fastest-growing End User : Protein-enriched skin, body, and hair care products are on the rise. Players offering protein ingredients with distinct concentration as per the need is boosting the segment.
India Protein Market Trends
This section covers the major market trends shaping the India Protein Market according to our research experts:
Food and Beverages is the largest End User
- The food and beverage segment led protein applications in the region, accounting for a major volume share. The segment is further projected to record a CAGR value of 6.38% during the forecast period. The demand for protein in the food and beverage segment is primarily driven by the increasing demand for protein functionalities and awareness about protein-rich diets. The meat/poultry/seafood and meat alternatives products sub-segment accounted for a major volume share of 31.47%, followed by the dairy and dairy alternative products segment, with 23.2%, in 2022.
- Applications in the baby food and infant formula sub-segment are likely to outpace others, with a projected CAGR value of 8.74% during the forecast period. The rising public awareness of children's nutrition and ideal development can be linked to the expansion of baby food items, which are popular among consumers to give infants and young children extra vitamins to boost their immunity and overall health. The Indian government launched the National Health Mission with the aim to make healthcare affordable and accessible to everyone, aligning with the United Nations' Sustainable Development Goal 3 (Good Health and Well-Being).
- The supplements segment is mainly driven by sports/performance nutrition, projected to record a CAGR value of 4.51% during the forecast period, attributed to the rising consumer engagement in sports and physical activities. Around two lakh new gyms have been opened in the past two years, supported by increasing interest in sports leagues, such as the Chinese Super League and Indian Premier League, which provide a solid platform for the development of sports nutrition and associated ingredients markets.
India Protein Industry Overview
The India Protein Market is fragmented, with the top five companies occupying 8.30%. The major players in this market are Archer Daniels Midland Company, Fonterra Co-operative Group Limited, International Flavors & Fragrances, Inc., Südzucker AG and VIPPY INDUSTRIES LIMITED (sorted alphabetically).
India Protein Market Leaders
Archer Daniels Midland Company
Fonterra Co-operative Group Limited
International Flavors & Fragrances, Inc.
Südzucker AG
VIPPY INDUSTRIES LIMITED
*Disclaimer: Major Players sorted in no particular order
India Protein Market News
- May 2021: Kerry has announced it will a purpose-build food technology and innovation center of excellence in Queensland, Australia. The facility acted as the new headquarters for Kerry in Australia and New Zealand while its existing facility in Sydney will retain a specialist research and development applications hub. With end-to-end capabilities including pilot plants, laboratories and tasting facilities, the new Kerry Australia and New Zealand Development and Application Centre in Brisbane increased Kerry’s R&D capacity in the region.
- April 2021: ADM opened a new cutting-edge, plant-based innovation lab in ADM's Biopolis research hub in Singapore. The lab develops advanced products and customized solutions to meet the increasing food and beverage demand in the Asia-Pacific region. The ADM Biopolis research hub in Singapore features a wide range of capabilities, including a food and flavor analytic lab, a beverage and dairy applications lab and pilot plant, a bakery and confectionery lab, a meat and savory lab, a sweet and savory creation lab, sensory evaluation facilities, and a customer innovation center, in addition to the new plant-based innovation lab.
- February 2021: NZMP, Fonterra's dairy ingredients business, launched a new protein ingredient that delivers 10% more protein than other standard whey protein offerings.
India Protein Market Report - Table of Contents
EXECUTIVE SUMMARY & KEY FINDINGS
1. INTRODUCTION
1.1. Study Assumptions & Market Definition
1.2. Scope of the Study
1.3. Research Methodology
2. KEY INDUSTRY TRENDS
2.1. End User Market Volume
2.2. Protein Consumption Trends
2.3. Production Trends
2.4. Regulatory Framework
2.5. Value Chain & Distribution Channel Analysis
3. MARKET SEGMENTATION
3.1. Source
3.1.1. Animal
3.1.1.1. By Protein Type
3.1.1.1.1. Casein And Caseinates
3.1.1.1.2. Collagen
3.1.1.1.3. Egg Protein
3.1.1.1.4. Gelatin
3.1.1.1.5. Insect Protein
3.1.1.1.6. Milk Protein
3.1.1.1.7. Whey Protein
3.1.1.1.8. Other Animal Protein
3.1.2. Microbial
3.1.2.1. By Protein Type
3.1.2.1.1. Algae Protein
3.1.2.1.2. Mycoprotein
3.1.3. Plant
3.1.3.1. By Protein Type
3.1.3.1.1. Hemp Protein
3.1.3.1.2. Pea Protein
3.1.3.1.3. Potato Protein
3.1.3.1.4. Rice Protein
3.1.3.1.5. Soy Protein
3.1.3.1.6. Wheat Protein
3.1.3.1.7. Other Plant Protein
3.2. End User
3.2.1. Animal Feed
3.2.2. Food And Beverages
3.2.2.1. By Sub End User
3.2.2.1.1. Bakery
3.2.2.1.2. Beverages
3.2.2.1.3. Breakfast Cereals
3.2.2.1.4. Condiments/Sauces
3.2.2.1.5. Confectionery
3.2.2.1.6. Dairy And Dairy Alternative Products
3.2.2.1.7. Meat/Poultry/Seafood And Meat Alternative Products
3.2.2.1.8. RTE/RTC Food Products
3.2.2.1.9. Snacks
3.2.3. Personal Care And Cosmetics
3.2.4. Supplements
3.2.4.1. By Sub End User
3.2.4.1.1. Baby Food And Infant Formula
3.2.4.1.2. Elderly Nutrition And Medical Nutrition
3.2.4.1.3. Sport/Performance Nutrition
4. COMPETITIVE LANDSCAPE
4.1. Key Strategic Moves
4.2. Market Share Analysis
4.3. Company Landscape
4.4. Company Profiles
4.4.1. Archer Daniels Midland Company
4.4.2. Fonterra Co-operative Group Limited
4.4.3. Glanbia PLC
4.4.4. Hilmar Cheese Company Inc.
4.4.5. International Flavors & Fragrances, Inc.
4.4.6. Kerry Group PLC
4.4.7. Nakoda Dairy Private Limited
4.4.8. Nitta Gelatin Inc.
4.4.9. Roquette Frère
4.4.10. Südzucker AG
4.4.11. VIPPY INDUSTRIES LIMITED
5. KEY STRATEGIC QUESTIONS FOR PROTEIN INGREDIENTS INDUSTRY CEOS
6. APPENDIX
6.1. Global Overview
6.1.1. Overview
6.1.2. Porter’s Five Forces Framework
6.1.3. Global Value Chain Analysis
6.1.4. Market Dynamics (DROs)
6.2. Sources & References
6.3. List of Tables & Figures
6.4. Primary Insights
6.5. Data Pack
6.6. Glossary of Terms
List of Tables & Figures
- Figure 1:
- INDIA BABY FOOD AND INFANT FORMULA MARKET, VOLUME IN METRIC TONNES, 2017 - 2029
- Figure 2:
- INDIA BAKERY MARKET, VOLUME IN METRIC TONNES, 2017 - 2029
- Figure 3:
- INDIA BEVERAGES MARKET, VOLUME IN METRIC TONNES, 2017 - 2029
- Figure 4:
- INDIA BREAKFAST CEREALS MARKET, VOLUME IN METRIC TONNES, 2017 - 2029
- Figure 5:
- INDIA CONDIMENTS/SAUCES MARKET, VOLUME IN METRIC TONNES, 2017 - 2029
- Figure 6:
- INDIA CONFECTIONERY MARKET, VOLUME IN METRIC TONNES, 2017 - 2029
- Figure 7:
- INDIA DAIRY AND DAIRY ALTERNATIVE PRODUCTS MARKET, VOLUME IN METRIC TONNES, 2017 - 2029
- Figure 8:
- INDIA ELDERLY NUTRITION AND MEDICAL NUTRITION MARKET, VOLUME IN METRIC TONNES, 2017 - 2029
- Figure 9:
- INDIA MEAT/POULTRY/SEAFOOD AND MEAT ALTERNATIVE PRODUCTS MARKET, VOLUME IN METRIC TONNES, 2017 - 2029
- Figure 10:
- INDIA RTE/RTC FOOD PRODUCTS MARKET, VOLUME IN METRIC TONNES, 2017 - 2029
- Figure 11:
- INDIA SNACKS MARKET, VOLUME IN METRIC TONNES, 2017 - 2029
- Figure 12:
- INDIA SPORT/PERFORMANCE NUTRITION MARKET, VOLUME IN METRIC TONNES, 2017 - 2029
- Figure 13:
- INDIA ANIMAL FEED MARKET, VOLUME IN METRIC TONNES, 2017 - 2029
- Figure 14:
- INDIA PERSONAL CARE AND COSMETICS MARKET, VOLUME IN METRIC TONNES, 2017 - 2029
- Figure 15:
- INDIA PER CAPITA CONSUMPTION OF ANIMAL PROTEIN, IN GRAM, 2017 - 2029
- Figure 16:
- INDIA PER CAPITA CONSUMPTION OF PLANT PROTEIN, IN GRAM, 2017 - 2029
- Figure 17:
- INDIA ANIMAL PROTEIN RAW MATERIAL PRODUCTION, IN METRIC TONNES, 2017 - 2021
- Figure 18:
- INDIA PLANT PROTEIN RAW MATERIAL PRODUCTION, IN METRIC TONNES, 2017 - 2021
- Figure 19:
- INDIA PROTEIN MARKET, 2015-2026
- Figure 20:
- INDIA PROTEIN MARKET, 2015-2026
- Figure 21:
- INDIA PROTEIN MARKET, VOLUME IN METRIC TONNES, BY SOURCE, 2017 - 2029
- Figure 22:
- INDIA PROTEIN MARKET, VALUE IN USD, BY SOURCE, 2017 - 2029
- Figure 23:
- INDIA PROTEIN MARKET, VALUE SHARE (%), BY SOURCE, 2017 VS 2023 VS 2029
- Figure 24:
- INDIA PROTEIN MARKET, VOLUME SHARE (%), BY SOURCE, 2017 VS 2023 VS 2029
- Figure 25:
- INDIA PROTEIN MARKET, VOLUME IN METRIC TONNES, BY PROTEIN TYPE, 2017 - 2029
- Figure 26:
- INDIA PROTEIN MARKET, VALUE IN USD, BY PROTEIN TYPE, 2017 - 2029
- Figure 27:
- INDIA PROTEIN MARKET, VALUE SHARE (%), BY PROTEIN TYPE, 2017 VS 2023 VS 2029
- Figure 28:
- INDIA PROTEIN MARKET, VOLUME SHARE (%), BY PROTEIN TYPE, 2017 VS 2023 VS 2029
- Figure 29:
- INDIA PROTEIN MARKET, VOLUME IN METRIC TONNES, CASEIN AND CASEINATES, 2017 - 2029
- Figure 30:
- INDIA PROTEIN MARKET, VALUE IN USD, CASEIN AND CASEINATES, 2017 - 2029
- Figure 31:
- INDIA PROTEIN MARKET, CASEIN AND CASEINATES, VALUE SHARE (%), BY END USER, 2022 VS 2029
- Figure 32:
- INDIA PROTEIN MARKET, VOLUME IN METRIC TONNES, COLLAGEN, 2017 - 2029
- Figure 33:
- INDIA PROTEIN MARKET, VALUE IN USD, COLLAGEN, 2017 - 2029
- Figure 34:
- INDIA PROTEIN MARKET, COLLAGEN, VALUE SHARE (%), BY END USER, 2022 VS 2029
- Figure 35:
- INDIA PROTEIN MARKET, VOLUME IN METRIC TONNES, EGG PROTEIN, 2017 - 2029
- Figure 36:
- INDIA PROTEIN MARKET, VALUE IN USD, EGG PROTEIN, 2017 - 2029
- Figure 37:
- INDIA PROTEIN MARKET, EGG PROTEIN, VALUE SHARE (%), BY END USER, 2022 VS 2029
- Figure 38:
- INDIA PROTEIN MARKET, VOLUME IN METRIC TONNES, GELATIN, 2017 - 2029
- Figure 39:
- INDIA PROTEIN MARKET, VALUE IN USD, GELATIN, 2017 - 2029
- Figure 40:
- INDIA PROTEIN MARKET, GELATIN, VALUE SHARE (%), BY END USER, 2022 VS 2029
- Figure 41:
- INDIA PROTEIN MARKET, VOLUME IN METRIC TONNES, INSECT PROTEIN, 2017 - 2029
- Figure 42:
- INDIA PROTEIN MARKET, VALUE IN USD, INSECT PROTEIN, 2017 - 2029
- Figure 43:
- INDIA PROTEIN MARKET, INSECT PROTEIN, VALUE SHARE (%), BY END USER, 2022 VS 2029
- Figure 44:
- INDIA PROTEIN MARKET, VOLUME IN METRIC TONNES, MILK PROTEIN, 2017 - 2029
- Figure 45:
- INDIA PROTEIN MARKET, VALUE IN USD, MILK PROTEIN, 2017 - 2029
- Figure 46:
- INDIA PROTEIN MARKET, MILK PROTEIN, VALUE SHARE (%), BY END USER, 2022 VS 2029
- Figure 47:
- INDIA PROTEIN MARKET, VOLUME IN METRIC TONNES, WHEY PROTEIN, 2017 - 2029
- Figure 48:
- INDIA PROTEIN MARKET, VALUE IN USD, WHEY PROTEIN, 2017 - 2029
- Figure 49:
- INDIA PROTEIN MARKET, WHEY PROTEIN, VALUE SHARE (%), BY END USER, 2022 VS 2029
- Figure 50:
- INDIA PROTEIN MARKET, VOLUME IN METRIC TONNES, OTHER ANIMAL PROTEIN, 2017 - 2029
- Figure 51:
- INDIA PROTEIN MARKET, VALUE IN USD, OTHER ANIMAL PROTEIN, 2017 - 2029
- Figure 52:
- INDIA PROTEIN MARKET, OTHER ANIMAL PROTEIN, VALUE SHARE (%), BY END USER, 2022 VS 2029
- Figure 53:
- INDIA PROTEIN MARKET, VOLUME IN METRIC TONNES, BY PROTEIN TYPE, 2017 - 2029
- Figure 54:
- INDIA PROTEIN MARKET, VALUE IN USD, BY PROTEIN TYPE, 2017 - 2029
- Figure 55:
- INDIA PROTEIN MARKET, VALUE SHARE (%), BY PROTEIN TYPE, 2017 VS 2023 VS 2029
- Figure 56:
- INDIA PROTEIN MARKET, VOLUME SHARE (%), BY PROTEIN TYPE, 2017 VS 2023 VS 2029
- Figure 57:
- INDIA PROTEIN MARKET, VOLUME IN METRIC TONNES, ALGAE PROTEIN, 2017 - 2029
- Figure 58:
- INDIA PROTEIN MARKET, VALUE IN USD, ALGAE PROTEIN, 2017 - 2029
- Figure 59:
- INDIA PROTEIN MARKET, ALGAE PROTEIN, VALUE SHARE (%), BY END USER, 2022 VS 2029
- Figure 60:
- INDIA PROTEIN MARKET, VOLUME IN METRIC TONNES, MYCOPROTEIN, 2017 - 2029
- Figure 61:
- INDIA PROTEIN MARKET, VALUE IN USD, MYCOPROTEIN, 2017 - 2029
- Figure 62:
- INDIA PROTEIN MARKET, MYCOPROTEIN, VALUE SHARE (%), BY END USER, 2022 VS 2029
- Figure 63:
- INDIA PROTEIN MARKET, VOLUME IN METRIC TONNES, BY PROTEIN TYPE, 2017 - 2029
- Figure 64:
- INDIA PROTEIN MARKET, VALUE IN USD, BY PROTEIN TYPE, 2017 - 2029
- Figure 65:
- INDIA PROTEIN MARKET, VALUE SHARE (%), BY PROTEIN TYPE, 2017 VS 2023 VS 2029
- Figure 66:
- INDIA PROTEIN MARKET, VOLUME SHARE (%), BY PROTEIN TYPE, 2017 VS 2023 VS 2029
- Figure 67:
- INDIA PROTEIN MARKET, VOLUME IN METRIC TONNES, HEMP PROTEIN, 2017 - 2029
- Figure 68:
- INDIA PROTEIN MARKET, VALUE IN USD, HEMP PROTEIN, 2017 - 2029
- Figure 69:
- INDIA PROTEIN MARKET, HEMP PROTEIN, VALUE SHARE (%), BY END USER, 2022 VS 2029
- Figure 70:
- INDIA PROTEIN MARKET, VOLUME IN METRIC TONNES, PEA PROTEIN, 2017 - 2029
- Figure 71:
- INDIA PROTEIN MARKET, VALUE IN USD, PEA PROTEIN, 2017 - 2029
- Figure 72:
- INDIA PROTEIN MARKET, PEA PROTEIN, VALUE SHARE (%), BY END USER, 2022 VS 2029
- Figure 73:
- INDIA PROTEIN MARKET, VOLUME IN METRIC TONNES, POTATO PROTEIN, 2017 - 2029
- Figure 74:
- INDIA PROTEIN MARKET, VALUE IN USD, POTATO PROTEIN, 2017 - 2029
- Figure 75:
- INDIA PROTEIN MARKET, POTATO PROTEIN, VALUE SHARE (%), BY END USER, 2022 VS 2029
- Figure 76:
- INDIA PROTEIN MARKET, VOLUME IN METRIC TONNES, RICE PROTEIN, 2017 - 2029
- Figure 77:
- INDIA PROTEIN MARKET, VALUE IN USD, RICE PROTEIN, 2017 - 2029
- Figure 78:
- INDIA PROTEIN MARKET, RICE PROTEIN, VALUE SHARE (%), BY END USER, 2022 VS 2029
- Figure 79:
- INDIA PROTEIN MARKET, VOLUME IN METRIC TONNES, SOY PROTEIN, 2017 - 2029
- Figure 80:
- INDIA PROTEIN MARKET, VALUE IN USD, SOY PROTEIN, 2017 - 2029
- Figure 81:
- INDIA PROTEIN MARKET, SOY PROTEIN, VALUE SHARE (%), BY END USER, 2022 VS 2029
- Figure 82:
- INDIA PROTEIN MARKET, VOLUME IN METRIC TONNES, WHEAT PROTEIN, 2017 - 2029
- Figure 83:
- INDIA PROTEIN MARKET, VALUE IN USD, WHEAT PROTEIN, 2017 - 2029
- Figure 84:
- INDIA PROTEIN MARKET, WHEAT PROTEIN, VALUE SHARE (%), BY END USER, 2022 VS 2029
- Figure 85:
- INDIA PROTEIN MARKET, VOLUME IN METRIC TONNES, OTHER PLANT PROTEIN, 2017 - 2029
- Figure 86:
- INDIA PROTEIN MARKET, VALUE IN USD, OTHER PLANT PROTEIN, 2017 - 2029
- Figure 87:
- INDIA PROTEIN MARKET, OTHER PLANT PROTEIN, VALUE SHARE (%), BY END USER, 2022 VS 2029
- Figure 88:
- INDIA PROTEIN MARKET, VOLUME IN METRIC TONNES, BY END USER, 2017 - 2029
- Figure 89:
- INDIA PROTEIN MARKET, VALUE IN USD, BY END USER, 2017 - 2029
- Figure 90:
- INDIA PROTEIN MARKET, VALUE SHARE (%), BY END USER, 2017 VS 2023 VS 2029
- Figure 91:
- INDIA PROTEIN MARKET, VOLUME SHARE (%), BY END USER, 2017 VS 2023 VS 2029
- Figure 92:
- INDIA PROTEIN MARKET, VOLUME IN METRIC TONNES, ANIMAL FEED, 2017 - 2029
- Figure 93:
- INDIA PROTEIN MARKET, VALUE IN USD, ANIMAL FEED, 2017 - 2029
- Figure 94:
- INDIA PROTEIN MARKET, ANIMAL FEED, VALUE SHARE (%), BY SOURCE, 2022 VS 2029
- Figure 95:
- INDIA PROTEIN MARKET, VOLUME IN METRIC TONNES, BY SUB END USER, 2017 - 2029
- Figure 96:
- INDIA PROTEIN MARKET, VALUE IN USD, BY SUB END USER, 2017 - 2029
- Figure 97:
- INDIA PROTEIN MARKET, VALUE SHARE (%), BY SUB END USER, 2017 VS 2023 VS 2029
- Figure 98:
- INDIA PROTEIN MARKET, VOLUME SHARE (%), BY SUB END USER, 2017 VS 2023 VS 2029
- Figure 99:
- INDIA PROTEIN MARKET, VOLUME IN METRIC TONNES, BAKERY, 2017 - 2029
- Figure 100:
- INDIA PROTEIN MARKET, VALUE IN USD, BAKERY, 2017 - 2029
- Figure 101:
- INDIA PROTEIN MARKET, BAKERY, VALUE SHARE (%), BY SOURCE, 2022 VS 2029
- Figure 102:
- INDIA PROTEIN MARKET, VOLUME IN METRIC TONNES, BEVERAGES, 2017 - 2029
- Figure 103:
- INDIA PROTEIN MARKET, VALUE IN USD, BEVERAGES, 2017 - 2029
- Figure 104:
- INDIA PROTEIN MARKET, BEVERAGES, VALUE SHARE (%), BY SOURCE, 2022 VS 2029
- Figure 105:
- INDIA PROTEIN MARKET, VOLUME IN METRIC TONNES, BREAKFAST CEREALS, 2017 - 2029
- Figure 106:
- INDIA PROTEIN MARKET, VALUE IN USD, BREAKFAST CEREALS, 2017 - 2029
- Figure 107:
- INDIA PROTEIN MARKET, BREAKFAST CEREALS, VALUE SHARE (%), BY SOURCE, 2022 VS 2029
- Figure 108:
- INDIA PROTEIN MARKET, VOLUME IN METRIC TONNES, CONDIMENTS/SAUCES, 2017 - 2029
- Figure 109:
- INDIA PROTEIN MARKET, VALUE IN USD, CONDIMENTS/SAUCES, 2017 - 2029
- Figure 110:
- INDIA PROTEIN MARKET, CONDIMENTS/SAUCES, VALUE SHARE (%), BY SOURCE, 2022 VS 2029
- Figure 111:
- INDIA PROTEIN MARKET, VOLUME IN METRIC TONNES, CONFECTIONERY, 2017 - 2029
- Figure 112:
- INDIA PROTEIN MARKET, VALUE IN USD, CONFECTIONERY, 2017 - 2029
- Figure 113:
- INDIA PROTEIN MARKET, CONFECTIONERY, VALUE SHARE (%), BY SOURCE, 2022 VS 2029
- Figure 114:
- INDIA PROTEIN MARKET, VOLUME IN METRIC TONNES, DAIRY AND DAIRY ALTERNATIVE PRODUCTS, 2017 - 2029
- Figure 115:
- INDIA PROTEIN MARKET, VALUE IN USD, DAIRY AND DAIRY ALTERNATIVE PRODUCTS, 2017 - 2029
- Figure 116:
- INDIA PROTEIN MARKET, DAIRY AND DAIRY ALTERNATIVE PRODUCTS, VALUE SHARE (%), BY SOURCE, 2022 VS 2029
- Figure 117:
- INDIA PROTEIN MARKET, VOLUME IN METRIC TONNES, MEAT/POULTRY/SEAFOOD AND MEAT ALTERNATIVE PRODUCTS, 2017 - 2029
- Figure 118:
- INDIA PROTEIN MARKET, VALUE IN USD, MEAT/POULTRY/SEAFOOD AND MEAT ALTERNATIVE PRODUCTS, 2017 - 2029
- Figure 119:
- INDIA PROTEIN MARKET, MEAT/POULTRY/SEAFOOD AND MEAT ALTERNATIVE PRODUCTS, VALUE SHARE (%), BY SOURCE, 2022 VS 2029
- Figure 120:
- INDIA PROTEIN MARKET, VOLUME IN METRIC TONNES, RTE/RTC FOOD PRODUCTS, 2017 - 2029
- Figure 121:
- INDIA PROTEIN MARKET, VALUE IN USD, RTE/RTC FOOD PRODUCTS, 2017 - 2029
- Figure 122:
- INDIA PROTEIN MARKET, RTE/RTC FOOD PRODUCTS, VALUE SHARE (%), BY SOURCE, 2022 VS 2029
- Figure 123:
- INDIA PROTEIN MARKET, VOLUME IN METRIC TONNES, SNACKS, 2017 - 2029
- Figure 124:
- INDIA PROTEIN MARKET, VALUE IN USD, SNACKS, 2017 - 2029
- Figure 125:
- INDIA PROTEIN MARKET, SNACKS, VALUE SHARE (%), BY SOURCE, 2022 VS 2029
- Figure 126:
- INDIA PROTEIN MARKET, VOLUME IN METRIC TONNES, PERSONAL CARE AND COSMETICS, 2017 - 2029
- Figure 127:
- INDIA PROTEIN MARKET, VALUE IN USD, PERSONAL CARE AND COSMETICS, 2017 - 2029
- Figure 128:
- INDIA PROTEIN MARKET, PERSONAL CARE AND COSMETICS, VALUE SHARE (%), BY SOURCE, 2022 VS 2029
- Figure 129:
- INDIA PROTEIN MARKET, VOLUME IN METRIC TONNES, BY SUB END USER, 2017 - 2029
- Figure 130:
- INDIA PROTEIN MARKET, VALUE IN USD, BY SUB END USER, 2017 - 2029
- Figure 131:
- INDIA PROTEIN MARKET, VALUE SHARE (%), BY SUB END USER, 2017 VS 2023 VS 2029
- Figure 132:
- INDIA PROTEIN MARKET, VOLUME SHARE (%), BY SUB END USER, 2017 VS 2023 VS 2029
- Figure 133:
- INDIA PROTEIN MARKET, VOLUME IN METRIC TONNES, BABY FOOD AND INFANT FORMULA, 2017 - 2029
- Figure 134:
- INDIA PROTEIN MARKET, VALUE IN USD, BABY FOOD AND INFANT FORMULA, 2017 - 2029
- Figure 135:
- INDIA PROTEIN MARKET, BABY FOOD AND INFANT FORMULA, VALUE SHARE (%), BY SOURCE, 2022 VS 2029
- Figure 136:
- INDIA PROTEIN MARKET, VOLUME IN METRIC TONNES, ELDERLY NUTRITION AND MEDICAL NUTRITION, 2017 - 2029
- Figure 137:
- INDIA PROTEIN MARKET, VALUE IN USD, ELDERLY NUTRITION AND MEDICAL NUTRITION, 2017 - 2029
- Figure 138:
- INDIA PROTEIN MARKET, ELDERLY NUTRITION AND MEDICAL NUTRITION, VALUE SHARE (%), BY SOURCE, 2022 VS 2029
- Figure 139:
- INDIA PROTEIN MARKET, VOLUME IN METRIC TONNES, SPORT/PERFORMANCE NUTRITION, 2017 - 2029
- Figure 140:
- INDIA PROTEIN MARKET, VALUE IN USD, SPORT/PERFORMANCE NUTRITION, 2017 - 2029
- Figure 141:
- INDIA PROTEIN MARKET, SPORT/PERFORMANCE NUTRITION, VALUE SHARE (%), BY SOURCE, 2022 VS 2029
- Figure 142:
- INDIA PROTEIN MARKET, MOST ACTIVE COMPANIES, BY NUMBER OF STRATEGIC MOVES, 2017 - 2022
- Figure 143:
- INDIA PROTEIN MARKET, TOTAL NUMBER OF STRATEGIC MOVES, 2017 - 2022
- Figure 144:
- INDIA PROTEIN MARKET SHARE(%), BY KEY PLAYERS, 2021
India Protein Industry Segmentation
Animal, Microbial, Plant are covered as segments by Source. Animal Feed, Food And Beverages, Personal Care And Cosmetics, Supplements are covered as segments by End User.| Source | ||||||||||||
| ||||||||||||
| ||||||||||||
|
| End User | |||||||||||||
| Animal Feed | |||||||||||||
| |||||||||||||
| Personal Care And Cosmetics | |||||||||||||
|
Market Definition
- End User - The Protein Ingredients Market operates on a B2B basis. Food, Beverages, Supplements, Animal Feed, and Personal Care & Cosmetic manufacturers are considered to be end-consumers in the market studied. The scope excludes manufacturers buying liquid/dry whey to be used for application as a binding agent or thickener or other non-protein applications.
- Penetration Rate - Penetration Rate is defined as the percentage of Protein-Fortified End User Market Volume in the Overall End User Market Volume.
- Average Protein Content - It is the average protein content present in per 100 g of product manufactured by all end-user companies considered under the scope of this report.
Research Methodology
Mordor Intelligence follows a four-step methodology in all our reports.
- Step-1: Identify Key Variables: The quantifiable key variables (industry and extraneous) pertaining to the specific product segment and country are selected from a group of relevant variables & factors based on desk research & literature review; along with primary expert inputs. These variables are further confirmed through regression modeling (wherever required).
- Step-2: Build a Market Model: In order to build a robust forecasting methodology, the variables and factors identified in Step-1 are tested against available historical market numbers. Through an iterative process, the variables required for market forecast are set and the model is built on the basis of these variables.
- Step-3: Validate and Finalize: In this important step, all market numbers, variables and analyst calls are validated through an extensive network of primary research experts from the market studied. The respondents are selected across levels and functions to generate a holistic picture of the market studied.
- Step-4: Research Outputs: Syndicated Reports, Custom Consulting Assignments, Databases & Subscription Platforms


