Indonesia Sealants Market Size

| Icons | Lable | Value |
|---|---|---|
|
|
Study Period | 2017 - 2028 |
|
|
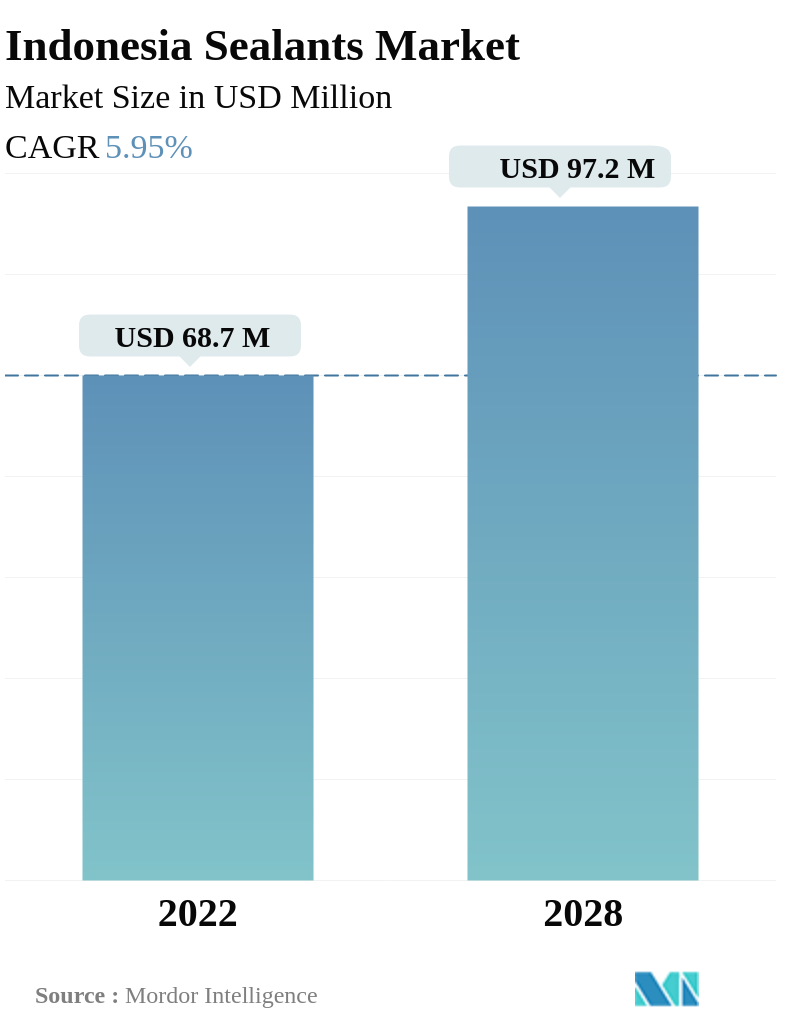
Market Size (2028) | USD 97.2 Million |
|
|
Market Size (2022) | USD 68.7 Million |
|
|
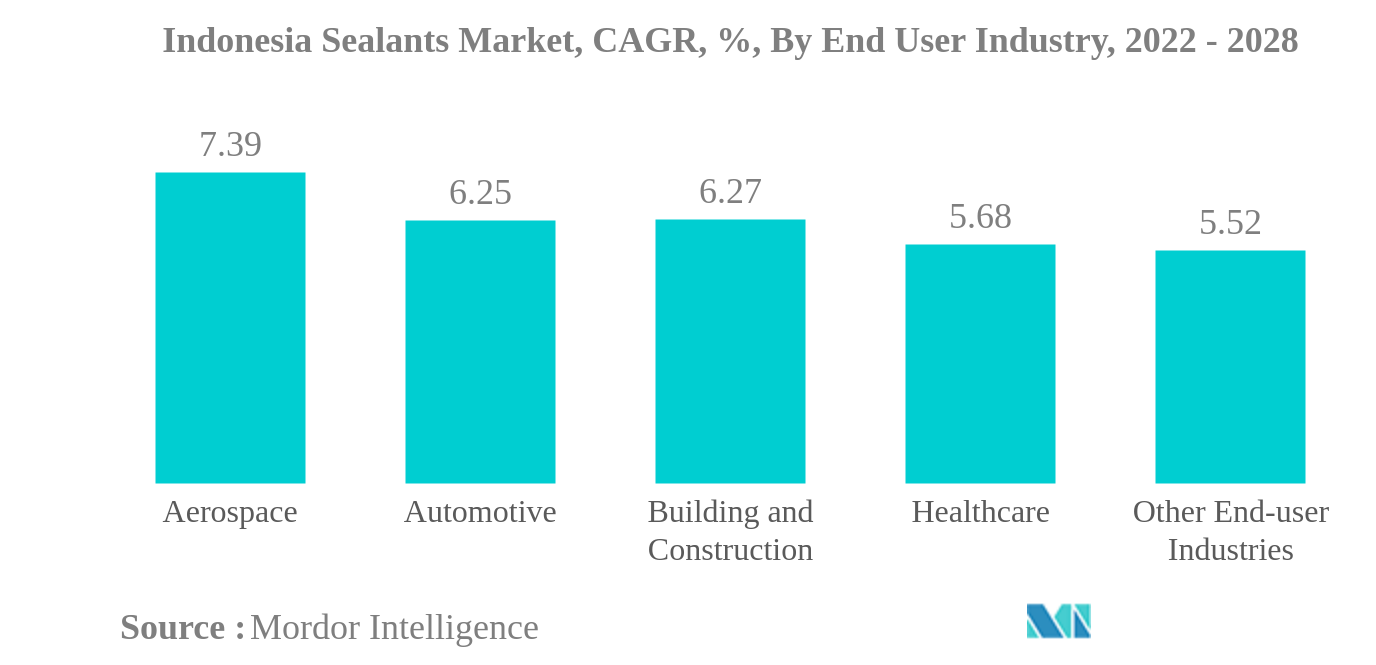
Largest Share by End User Industry | Building and Construction |
|
|
CAGR (2022 - 2028) | 5.95 % |
|
|
Fastest Growing by End User Industry | Aerospace |
Major Players |
||
|
|
||
|
*Disclaimer: Major Players sorted in no particular order |
Indonesia Sealants Market Analysis
The Indonesia Sealants Market is projected to register a CAGR of 5.95%
- Building and Construction is the Largest End User Industry. In Indonesia, building and construction is the dominant end-user industry owing to the wide range of sealant applications, including joint sealing, weatherproofing, window sealing, glazing, façade, and others.
- Aerospace is the Fastest-growing End User Industry. The aerospace industry is likely to witness the fastest growth owing to the rapid expansion of general aviation for the domestic market.
- Silicone is the Largest Resin. Due to their excellent tear and abrasion resistance and wide usage in building and construction end users, silicone sealants have dominated the market.
- Polyurethane is the Fastest-growing Resin. Owing to their wide applications in building construction and automotive industries, specifically for exterior applications, the resin is expected to witness the fastest growth in the coming years.
Indonesia Sealants Market Trends
This section covers the major market trends shaping the Indonesia Sealants Market according to our research experts:
Building and Construction is the largest End User Industry
- The Indonesian sealants market is largely driven by the construction industry, followed by other end-user industries due to the wide range of applications of sealants in building and construction activities such as waterproofing, weather-sealing, cracks-sealing, and joint-sealing. Moreover, construction sealants are designed for longevity and ease of application on different substrates. The construction industry has registered as the fourth-largest contributor to the country’s GDP in 2021. However, construction activities decreased in 2020 due to COVID-19 restrictions and the scarcity of raw materials.
- Other end-user industries are likely to obtain the second largest market share of the Indonesian sealants market owing to the diverse applications in the electronics and electrical equipment manufacturing industry for potting and protecting materials, and they are used for sealing sensors and cables, etc. The electronics market of Indonesia is expected to showcase a considerable growth rate which will create demand for sealants over the projected time period. Moreover, the rapid growth of e-commerce activities, along with the strong market positioning of the consumer electronics segment, would like to propel the industry size of the Indonesian sealants market.
- Sealants have considerable applications in the healthcare and automotive industries, and Indonesia has achieved significant development in these sectors in recent times. Sealants are used in healthcare mostly for assembling and sealing medical device parts. Increasing demand for electric vehicles due to favourable government policies, along with consumer preferences for lightweight vehicles, will gradually influence the demand for sealants.
Indonesia Sealants Industry Overview
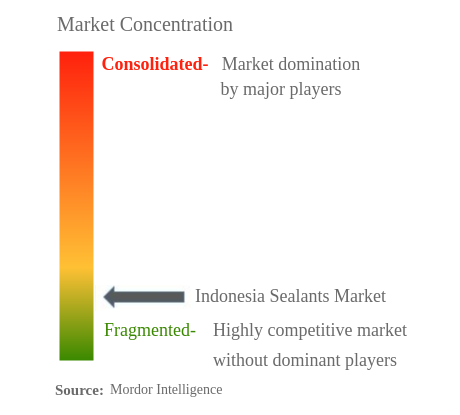
The Indonesia Sealants Market is fragmented, with the top five companies occupying 28.76%. The major players in this market are 3M, DEXTONE INDONESIA, Henkel AG & Co. KGaA, Pioneer Adhesives, Inc. and Sika AG (sorted alphabetically).
Indonesia Sealants Market Leaders
3M
DEXTONE INDONESIA
Henkel AG & Co. KGaA
Pioneer Adhesives, Inc.
Sika AG
*Disclaimer: Major Players sorted in no particular order
Indonesia Sealants Market News
- January 2020: H.B. Fuller Company introduced a new range of Gorilla professional-grade adhesives and sealants for MRO industrial applications.
- April 2019: Dow completed the separation of its Material Science division through a spin-off of Dow Inc.
Indonesia Sealants Market Report - Table of Contents
1. INTRODUCTION
1.1. Study Assumptions & Market Definition
1.2. Scope of the Study
1.3. Research Methodology
2. KEY INDUSTRY TRENDS
2.1. End User Trends
2.2. Regulatory Framework
2.3. Value Chain & Distribution Channel Analysis
3. MARKET SEGMENTATION
3.1. End User Industry
3.1.1. Aerospace
3.1.2. Automotive
3.1.3. Building and Construction
3.1.4. Healthcare
3.1.5. Other End-user Industries
3.2. Resin
3.2.1. Acrylic
3.2.2. Epoxy
3.2.3. Polyurethane
3.2.4. Silicone
3.2.5. Other Resins
4. COMPETITIVE LANDSCAPE
4.1. Key Strategic Moves
4.2. Market Share Analysis
4.3. Company Landscape
4.4. Company Profiles
4.4.1. 3M
4.4.2. Arkema Group
4.4.3. DEXTONE INDONESIA
4.4.4. Dow
4.4.5. H.B. Fuller Company
4.4.6. Henkel AG & Co. KGaA
4.4.7. IKA GROUP
4.4.8. Illinois Tool Works Inc.
4.4.9. Pioneer Adhesives, Inc.
4.4.10. Sika AG
5. KEY STRATEGIC QUESTIONS FOR ADHESIVES AND SEALANTS CEOS
6. APPENDIX
6.1. Global Adhesives and Sealants Industry Overview
6.1.1. Overview
6.1.2. Porter’s Five Forces Framework
6.1.3. Global Value Chain Analysis
6.1.4. Drivers, Restraints, and Opportunities
6.2. Sources & References
6.3. List of Tables & Figures
6.4. Primary Insights
6.5. Data Pack
6.6. Glossary of Terms
List of Tables & Figures
- Figure 1:
- INDONESIA AIRCRAFT DELIVERIES, VOLUME IN UNITS, 2017-2028
- Figure 2:
- INDONESIA AUTOMOBILE PRODUCTION, VOLUME IN UNITS, 2017-2028
- Figure 3:
- INDONESIA NEW FLOOR AREA, VOLUME IN SQUARE FEET, 2017-2028
- Figure 4:
- INDONESIA SEALANTS MARKET, VOLUME, TONS, 2017 - 2028
- Figure 5:
- INDONESIA SEALANTS MARKET, VALUE, USD, 2017 - 2028
- Figure 6:
- INDONESIA SEALANTS MARKET, BY END USER INDUSTRY, VOLUME, TONS, 2017 - 2028
- Figure 7:
- INDONESIA SEALANTS MARKET, BY END USER INDUSTRY, VALUE, USD, 2017 - 2028
- Figure 8:
- INDONESIA SEALANTS MARKET, BY END USER INDUSTRY, VOLUME SHARE (%), 2022 VS 2028
- Figure 9:
- INDONESIA SEALANTS MARKET, BY END USER INDUSTRY, VALUE SHARE (%), 2022 VS 2028
- Figure 10:
- INDONESIA SEALANTS MARKET, AEROSPACE, VOLUME, TONS, 2017 - 2028
- Figure 11:
- INDONESIA SEALANTS MARKET, AEROSPACE, VALUE, USD, 2017 - 2028
- Figure 12:
- INDONESIA SEALANTS MARKET, AEROSPACE, BY RESIN, VALUE SHARE (%), 2021 VS 2028
- Figure 13:
- INDONESIA SEALANTS MARKET, AUTOMOTIVE, VOLUME, TONS, 2017 - 2028
- Figure 14:
- INDONESIA SEALANTS MARKET, AUTOMOTIVE, VALUE, USD, 2017 - 2028
- Figure 15:
- INDONESIA SEALANTS MARKET, AUTOMOTIVE, BY RESIN, VALUE SHARE (%), 2021 VS 2028
- Figure 16:
- INDONESIA SEALANTS MARKET, BUILDING AND CONSTRUCTION, VOLUME, TONS, 2017 - 2028
- Figure 17:
- INDONESIA SEALANTS MARKET, BUILDING AND CONSTRUCTION, VALUE, USD, 2017 - 2028
- Figure 18:
- INDONESIA SEALANTS MARKET, BUILDING AND CONSTRUCTION, BY RESIN, VALUE SHARE (%), 2021 VS 2028
- Figure 19:
- INDONESIA SEALANTS MARKET, HEALTHCARE, VOLUME, TONS, 2017 - 2028
- Figure 20:
- INDONESIA SEALANTS MARKET, HEALTHCARE, VALUE, USD, 2017 - 2028
- Figure 21:
- INDONESIA SEALANTS MARKET, HEALTHCARE, BY RESIN, VALUE SHARE (%), 2021 VS 2028
- Figure 22:
- INDONESIA SEALANTS MARKET, OTHER END-USER INDUSTRIES, VOLUME, TONS, 2017 - 2028
- Figure 23:
- INDONESIA SEALANTS MARKET, OTHER END-USER INDUSTRIES, VALUE, USD, 2017 - 2028
- Figure 24:
- INDONESIA SEALANTS MARKET, OTHER END-USER INDUSTRIES, BY RESIN, VALUE SHARE (%), 2021 VS 2028
- Figure 25:
- INDONESIA SEALANTS MARKET, BY RESIN, VOLUME, TONS, 2017 - 2028
- Figure 26:
- INDONESIA SEALANTS MARKET, BY RESIN, VALUE, USD, 2017 - 2028
- Figure 27:
- INDONESIA SEALANTS MARKET, BY RESIN, VOLUME SHARE (%), 2022 VS 2028
- Figure 28:
- INDONESIA SEALANTS MARKET, BY RESIN, VALUE SHARE (%), 2022 VS 2028
- Figure 29:
- INDONESIA SEALANTS MARKET, ACRYLIC, VOLUME, TONS, 2017 - 2028
- Figure 30:
- INDONESIA SEALANTS MARKET, ACRYLIC, VALUE, USD, 2017 - 2028
- Figure 31:
- INDONESIA SEALANTS MARKET, ACRYLIC, BY END USER INDUSTRY, VALUE SHARE (%), 2021 VS 2028
- Figure 32:
- INDONESIA SEALANTS MARKET, EPOXY, VOLUME, TONS, 2017 - 2028
- Figure 33:
- INDONESIA SEALANTS MARKET, EPOXY, VALUE, USD, 2017 - 2028
- Figure 34:
- INDONESIA SEALANTS MARKET, EPOXY, BY END USER INDUSTRY, VALUE SHARE (%), 2021 VS 2028
- Figure 35:
- INDONESIA SEALANTS MARKET, POLYURETHANE, VOLUME, TONS, 2017 - 2028
- Figure 36:
- INDONESIA SEALANTS MARKET, POLYURETHANE, VALUE, USD, 2017 - 2028
- Figure 37:
- INDONESIA SEALANTS MARKET, POLYURETHANE, BY END USER INDUSTRY, VALUE SHARE (%), 2021 VS 2028
- Figure 38:
- INDONESIA SEALANTS MARKET, SILICONE, VOLUME, TONS, 2017 - 2028
- Figure 39:
- INDONESIA SEALANTS MARKET, SILICONE, VALUE, USD, 2017 - 2028
- Figure 40:
- INDONESIA SEALANTS MARKET, SILICONE, BY END USER INDUSTRY, VALUE SHARE (%), 2021 VS 2028
- Figure 41:
- INDONESIA SEALANTS MARKET, OTHER RESINS, VOLUME, TONS, 2017 - 2028
- Figure 42:
- INDONESIA SEALANTS MARKET, OTHER RESINS, VALUE, USD, 2017 - 2028
- Figure 43:
- INDONESIA SEALANTS MARKET, OTHER RESINS, BY END USER INDUSTRY, VALUE SHARE (%), 2021 VS 2028
- Figure 44:
- INDONESIA SEALANTS MARKET, MOST ACTIVE COMPANIES, BY NUMBER OF STRATEGIC MOVES, 2019 - 2021
- Figure 45:
- INDONESIA SEALANTS MARKET, MOST ADOPTED STRATEGIES, 2019 - 2021
- Figure 46:
- INDONESIA SEALANTS MARKET SHARE(%), BY MAJOR PLAYERS REVENUE, 2021
Indonesia Sealants Industry Segmentation
Aerospace, Automotive, Building and Construction, Healthcare are covered as segments by End User Industry. Acrylic, Epoxy, Polyurethane, Silicone are covered as segments by Resin.| End User Industry | |
| Aerospace | |
| Automotive | |
| Building and Construction | |
| Healthcare | |
| Other End-user Industries |
| Resin | |
| Acrylic | |
| Epoxy | |
| Polyurethane | |
| Silicone | |
| Other Resins |
Market Definition
- End-user Industry - Building & Construction, Automotive, Aerospace, Healthcare, and Others are the end-user industries considered under the sealants market.
- Product - All sealant products are considered in the market studied
- Resin - Under the scope of the study, resins like Polyurethane, Epoxy, Acrylic, Silicone, and Others are considered
- Technology - For the purpose of this study, One component and Two component sealant technologies are taken into consideration.
Research Methodology
Mordor Intelligence follows a four-step methodology in all our reports.
- Step-1: Identify Key Variables: The quantifiable key variables (industry and extraneous) pertaining to the specific product segment and country are selected from a group of relevant variables & factors based on desk research & literature review; along with primary expert inputs. These variables are further confirmed through regression modeling (wherever required).
- Step-2: Build a Market Model: In order to build a robust forecasting methodology, the variables and factors identified in Step-1 are tested against available historical market numbers. Through an iterative process, the variables required for market forecast are set and the model is built on the basis of these variables.
- Step-3: Validate and Finalize: In this important step, all market numbers, variables and analyst calls are validated through an extensive network of primary research experts from the market studied. The respondents are selected across levels and functions to generate a holistic picture of the market studied.
- Step-4: Research Outputs: Syndicated Reports, Custom Consulting Assignments, Databases & Subscription Platforms


