Japan Data Center Market Size

| Icons | Lable | Value |
|---|---|---|
|
|
Study Period | 2017 - 2029 |
|
|
Market Size (2023) | USD 19.09 Billion |
|
|
Market Size (2028) | USD 25.56 Billion |
|
|
CAGR (2023 - 2028) | 6.01 % |
|
|
Largest Share by Tier Type | Tier 3 |
|
|
Fastest Growing by Tier Type | Tier 4 |
Major Players |
||
|
|
||
|
*Disclaimer: Major Players sorted in no particular order |
Japan Data Center Market Analysis
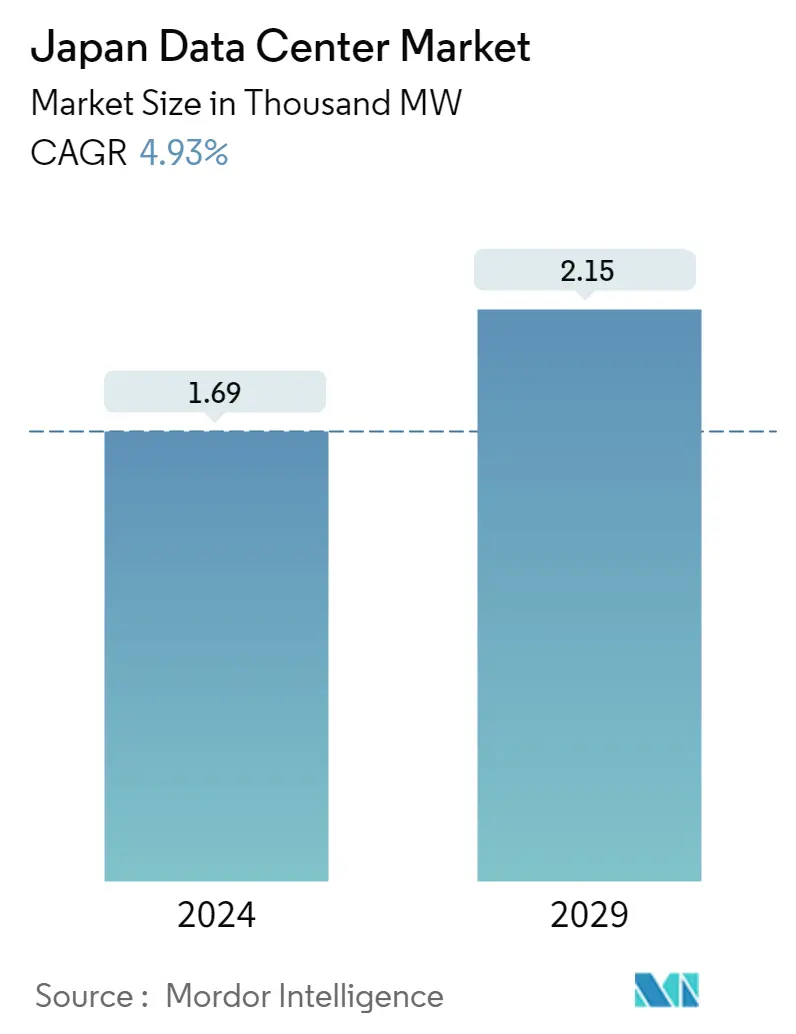
The Japan Data Center Market size is expected to grow from USD 19.09 billion in 2023 to USD 25.56 billion by 2028, at a CAGR of 6.01% during the forecast period (2023-2028).
- IT Load Capacity: The IT load capacity of the Japanese data center market may grow steadily and reach 4446.5 MW by 2029.
- Raised Floor Space: The country's total raised floor area is expected to reach 10.2 million sq. ft by 2029.
- Installed Racks: The country's total number of installed racks is expected to reach 512,270 units by 2029. Tokyo is expected to house the maximum number of racks by 2029.
- DC Facilities: Japan is expected to notice investments in green DC R&D, such as the zero-emission DC plan of Ishikari City, Hokkaido, which leverages the cold climate and proximity to renewable energy, thus offering a huge potential for data growth and government incentives.
- Leading Market Player: AirTrunk Operating Pty Ltd holds the highest share of 15.4% in the data center market compared to its competitors. The company currently operates at an IT load capacity of 185 MW, which is expected to increase during the forecast period.
Japan Data Center Market Trends
This section covers the major market trends shaping the Japan Data Center Market according to our research experts:
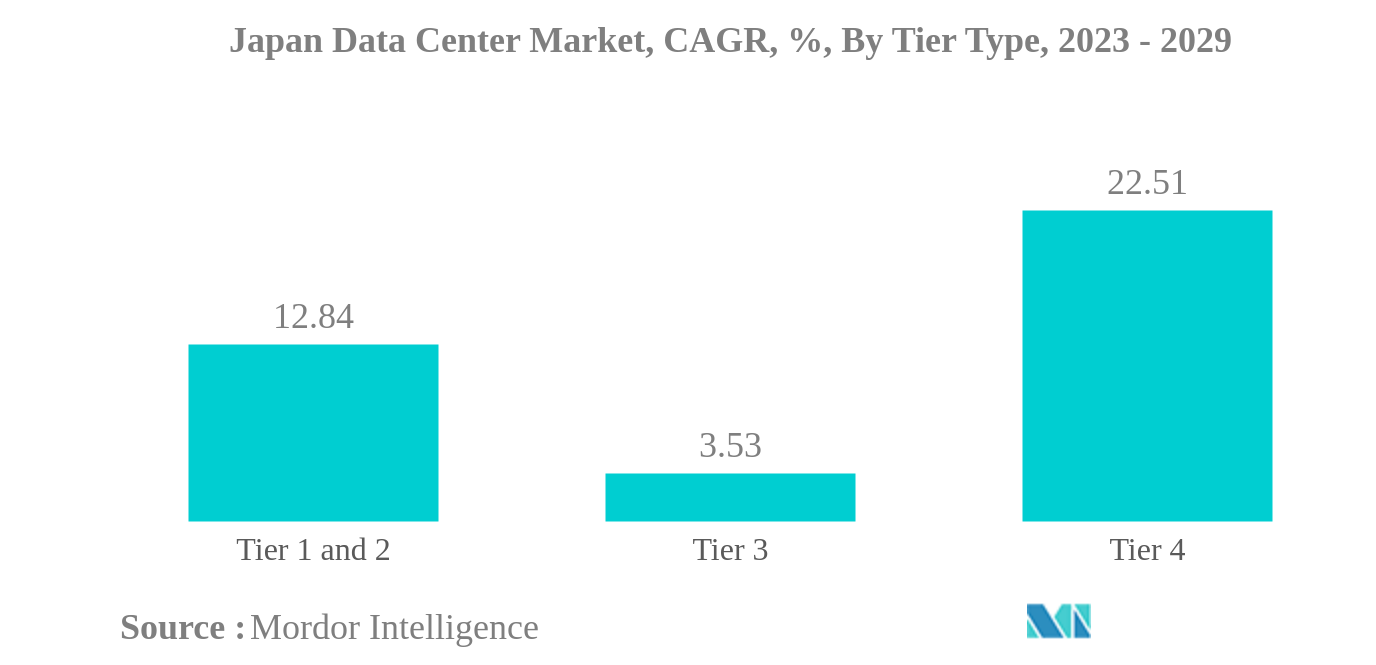
Tier 3 is the largest Tier Type
- Tier 3 data centers are mostly preferred by SMBs (small and medium businesses) for their far superior redundancy protection offerings. There is a significant jump in uptime from tier 2, with tier 3 offering annual uptime of 99.982%. The segment is expected to grow from 1,309.25 MW in 2022 to 1,905.47 MW by 2029, registering a CAGR of 5.51%. These data centers are mainly opted for by large companies.
- Tier 4 facilities are the next most preferred data centers by large businesses due to their performance, lower downtime, and 99.99% uptime. However, the majority of facilities still prefer tier 3 data centers due to their long-term financial and operational sustainability. Tier 3 is the most widely adopted standard across the industry. However, the growth rate for tier 4 facilities is expected to be the largest.
- Tier 1 & 2 data centers are the least preferred due to their higher downtime durations and low redundancies, but start-up companies usually prefer these data centers. However, in Japan, start-up companies also prefer tier 3 data center facilities. Currently, in Japan, there are no facilities certified with Tier 1 and Tier 2, and this trend is expected to continue during the forecast period.
Japan Data Center Industry Overview
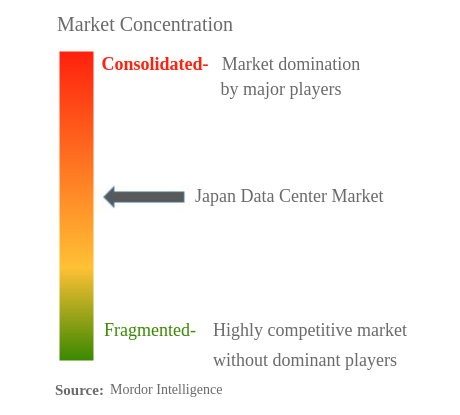
The Japan Data Center Market is moderately consolidated, with the top five companies occupying 55.68%. The major players in this market are Colt Technology Services, Digital Realty Trust, Inc., Equinix, Inc., IDC Frontier Inc. (SoftBank Group) and NEC Corporation (sorted alphabetically).
Japan Data Center Market Leaders
Colt Technology Services
Digital Realty Trust, Inc.
Equinix, Inc.
IDC Frontier Inc. (SoftBank Group)
NEC Corporation
*Disclaimer: Major Players sorted in no particular order
Japan Data Center Market News
- November 2022: Equinix announced its 15th international business exchange (IBX) data centre in Tokyo, Japan. The company said that it has made an initial investment of USD 115 million on the new data centre, touted TY15. The first phase of TY15 will provide an initial capacity of approximately 1,200 cabinets, and 3,700 cabinets when fully built out.
- October 2022: Zenlayer entered into a joint venture with Megaport to strengthen and expand its presence globally. The partnership is aimed at providing enhanced services such as improved network connectivity, real time provisioning, and on demand private connectivity for its clients around the globe.
- September 2022: NTT Corporation announced to invest approximately YEN 40 billion through NTT Global Data Centers Corporation to build new "Keihanna Data Center" in Kyoto Prefecture. The building is a four-story, seismic-isolated structure that will stably supply a total of 30 MW for IT load (starting at 6 MW and gradually expanding) to a server room space of 10,900 sqm (equivalent to 4,800 racks).
Japan Data Center Market Report - Table of Contents
1. INTRODUCTION
1.1. Study Assumptions & Market Definition
1.2. Scope of the Study
1.3. Research Methodology
2. MARKET OUTLOOK
2.1. IT Load Capacity
2.2. Raised Floor Space
2.3. Colocation Revenue
2.4. Installed Racks
2.5. Rack Space Utilization
2.6. Submarine Cable
3. KEY INDUSTRY TRENDS
3.1. Smartphone Users
3.2. Data Traffic Per Smartphone
3.3. Mobile Data Speed
3.4. Broadband Data Speed
3.5. Fiber Connectivity Network
3.6. Regulatory Framework
3.7. Value Chain & Distribution Channel Analysis
4. MARKET SEGMENTATION
4.1. Hotspot
4.1.1. Osaka
4.1.2. Tokyo
4.1.3. Rest of Japan
4.2. Data Center Size
4.2.1. Large
4.2.2. Massive
4.2.3. Medium
4.2.4. Mega
4.2.5. Small
4.3. Tier Type
4.3.1. Tier 1 and 2
4.3.2. Tier 3
4.3.3. Tier 4
4.4. Absorption
4.4.1. Non-Utilized
4.4.2. Utilized
4.4.2.1. By Colocation Type
4.4.2.1.1. Hyperscale
4.4.2.1.2. Retail
4.4.2.1.3. Wholesale
4.4.2.2. By End User
4.4.2.2.1. BFSI
4.4.2.2.2. Cloud
4.4.2.2.3. E-Commerce
4.4.2.2.4. Government
4.4.2.2.5. Manufacturing
4.4.2.2.6. Media & Entertainment
4.4.2.2.7. Telecom
4.4.2.2.8. Other End User
5. COMPETITIVE LANDSCAPE
5.1. Market Share Analysis
5.2. Company Landscape
5.3. Company Profiles
5.3.1. AirTrunk Operating Pty Ltd.
5.3.2. Arteria Networks Corporation
5.3.3. Colt Technology Services
5.3.4. Digital Edge (Singapore) Holdings Pte Ltd.
5.3.5. Digital Realty Trust, Inc.
5.3.6. Equinix, Inc.
5.3.7. IDC Frontier Inc. (SoftBank Group)
5.3.8. NEC Corporation
5.3.9. netXDC (SCSK Corporation)
5.3.10. NTT Ltd.
5.3.11. Telehouse (KDDI Corporation)
5.3.12. Zenlayer Inc
5.4. LIST OF COMPANIES STUDIED
6. KEY STRATEGIC QUESTIONS FOR DATA CENTER CEOS
7. APPENDIX
7.1. Global Overview
7.1.1. Overview
7.1.2. Porter’s Five Forces Framework
7.1.3. Global Value Chain Analysis
7.1.4. Global Market Size and DROs
7.2. Sources & References
7.3. List of Tables & Figures
7.4. Primary Insights
7.5. Data Pack
7.6. Glossary of Terms
List of Tables & Figures
- Figure 1:
- JAPAN DATA CENTER MARKET, COLOCATION REVENUE, VALUE IN USD MILLION, 2017 - 2029
- Figure 2:
- JAPAN DATA CENTER MARKET, INSTALLED RACKS, VALUE IN UNIT, 2017 - 2029
- Figure 3:
- JAPAN DATA CENTER MARKET, RACK SPACE UTILIZATION, VALUE IN (%), 2017 - 2029
- Figure 4:
- JAPAN DATA CENTER MARKET, SMARTPHONE USERS, VOLUME IN MILLION, 2017 - 2029
- Figure 5:
- JAPAN DATA CENTER MARKET, DATA TRAFFIC PER SMARTPHONE, VOLUME IN GB, 2017 - 2029
- Figure 6:
- JAPAN DATA CENTER MARKET, MOBILE DATA SPEED, VOLUME IN MBPS, 2017 - 2029
- Figure 7:
- JAPAN DATA CENTER MARKET, BROADBAND SPEED, VOLUME IN MBPS, 2017 - 2029
- Figure 8:
- JAPAN DATA CENTER MARKET, FIBER CONNECTIVITY NETWORK, VOLUME IN KILOMETER, 2017 - 2029
- Figure 9:
- JAPAN DATA CENTER MARKET, VOLUME, MW, 2017 - 2029
- Figure 10:
- JAPAN DATA CENTER MARKET, BY HOTSPOT, VOLUME IN MW, 2017 - 2029
- Figure 11:
- JAPAN DATA CENTER MARKET, SHARE(%), BY HOTSPOT, 2017 - 2023 - 2029
- Figure 12:
- JAPAN DATA CENTER MARKET, OSAKA, VOLUME IN MW, 2017 - 2029
- Figure 13:
- JAPAN DATA CENTER MARKET, BY DATA CENTER SIZE, OSAKA, VOLUME SHARE (%), 2022 - 2029
- Figure 14:
- JAPAN DATA CENTER MARKET, TOKYO, VOLUME IN MW, 2017 - 2029
- Figure 15:
- JAPAN DATA CENTER MARKET, BY DATA CENTER SIZE, TOKYO, VOLUME SHARE (%), 2022 - 2029
- Figure 16:
- JAPAN DATA CENTER MARKET, REST OF JAPAN, VOLUME IN MW, 2017 - 2029
- Figure 17:
- JAPAN DATA CENTER MARKET, BY DATA CENTER SIZE, REST OF JAPAN, VOLUME SHARE (%), 2022 - 2029
- Figure 18:
- JAPAN DATA CENTER MARKET, BY DATA CENTER SIZE, VOLUME IN MW, 2017 - 2029
- Figure 19:
- JAPAN DATA CENTER MARKET, SHARE(%), BY DATA CENTER SIZE, 2017 - 2023 - 2029
- Figure 20:
- JAPAN DATA CENTER MARKET, LARGE, VOLUME IN MW, 2017 - 2029
- Figure 21:
- JAPAN DATA CENTER MARKET, MASSIVE, VOLUME IN MW, 2017 - 2029
- Figure 22:
- JAPAN DATA CENTER MARKET, MEDIUM, VOLUME IN MW, 2017 - 2029
- Figure 23:
- JAPAN DATA CENTER MARKET, MEGA, VOLUME IN MW, 2017 - 2029
- Figure 24:
- JAPAN DATA CENTER MARKET, SMALL, VOLUME IN MW, 2017 - 2029
- Figure 25:
- JAPAN DATA CENTER MARKET, BY TIER TYPE, VOLUME IN MW, 2017 - 2029
- Figure 26:
- JAPAN DATA CENTER MARKET, SHARE(%), BY TIER TYPE, 2017 - 2023 - 2029
- Figure 27:
- JAPAN DATA CENTER MARKET, TIER 1&2, VOLUME IN MW, 2017 - 2029
- Figure 28:
- JAPAN DATA CENTER MARKET, TIER 3, VOLUME IN MW, 2017 - 2029
- Figure 29:
- JAPAN DATA CENTER MARKET, TIER 4, VOLUME IN MW, 2017 - 2029
- Figure 30:
- JAPAN DATA CENTER MARKET, BY ABSORPTION, VOLUME IN MW, 2017 - 2029
- Figure 31:
- JAPAN DATA CENTER MARKET, SHARE(%), BY ABSORPTION, 2017 - 2023 - 2029
- Figure 32:
- JAPAN DATA CENTER MARKET, NON-UTILIZED, VOLUME IN MW, 2017 - 2029
- Figure 33:
- JAPAN DATA CENTER MARKET, BY COLOCATION TYPE, VOLUME IN MW, 2017 - 2029
- Figure 34:
- JAPAN DATA CENTER MARKET, SHARE(%), BY COLOCATION TYPE, 2017 - 2023 - 2029
- Figure 35:
- JAPAN DATA CENTER MARKET, HYPERSCALE, VOLUME IN MW, 2017 - 2029
- Figure 36:
- JAPAN DATA CENTER MARKET, RETAIL, VOLUME IN MW, 2017 - 2029
- Figure 37:
- JAPAN DATA CENTER MARKET, WHOLESALE, VOLUME IN MW, 2017 - 2029
- Figure 38:
- JAPAN DATA CENTER MARKET, BY END USER, VOLUME IN MW, 2017 - 2029
- Figure 39:
- JAPAN DATA CENTER MARKET, SHARE(%), BY END USER, 2017 - 2023 - 2029
- Figure 40:
- JAPAN DATA CENTER MARKET, BFSI, VOLUME IN MW, 2017 - 2029
- Figure 41:
- JAPAN DATA CENTER MARKET, CLOUD, VOLUME IN MW, 2017 - 2029
- Figure 42:
- JAPAN DATA CENTER MARKET, E-COMMERCE, VOLUME IN MW, 2017 - 2029
- Figure 43:
- JAPAN DATA CENTER MARKET, GOVERNMENT, VOLUME IN MW, 2017 - 2029
- Figure 44:
- JAPAN DATA CENTER MARKET, MANUFACTURING, VOLUME IN MW, 2017 - 2029
- Figure 45:
- JAPAN DATA CENTER MARKET, MEDIA & ENTERTAINMENT, VOLUME IN MW, 2017 - 2029
- Figure 46:
- JAPAN DATA CENTER MARKET, TELECOM, VOLUME IN MW, 2017 - 2029
- Figure 47:
- JAPAN DATA CENTER MARKET, OTHER END USER, VOLUME IN MW, 2017 - 2029
- Figure 48:
- JAPAN DATA CENTER MARKET, BY MAJOR PLAYER IT LOAD CAPACITY, 2022
Japan Data Center Industry Segmentation
Osaka, Tokyo are covered as segments by Hotspot. Large, Massive, Medium, Mega, Small are covered as segments by Data Center Size. Tier 1 and 2, Tier 3, Tier 4 are covered as segments by Tier Type. Non-Utilized, Utilized are covered as segments by Absorption.| Hotspot | |
| Osaka | |
| Tokyo | |
| Rest of Japan |
| Data Center Size | |
| Large | |
| Massive | |
| Medium | |
| Mega | |
| Small |
| Tier Type | |
| Tier 1 and 2 | |
| Tier 3 | |
| Tier 4 |
| Absorption | |||||||||||||||||
| Non-Utilized | |||||||||||||||||
|
Market Definition
- IT LOAD CAPACITY - The IT load capacity or installed capacity, refers to the amount of energy consumed by servers and network equipments placed in a rack installed. It is measured in megawatt (MW).
- ABSORPTION RATE - It denotes the extend to which the data center capacity has been leased out. For instance, a 100 MW DC has leased out 75 MW, then absorption rate would be 75%. It is also referred as utilization rate and leased-out capacity.
- RAISED FLOOR SPACE - It is an elevated space build over the floor. This gap between the original floor and the elevated floor is used to accommodate wiring, cooling, and other data center equipment. This arrangement assist in having proper wiring and cooling infrastructure. It is measured in square feet (ft^2).
- DATA CENTER SIZE - Data Center Size is segmented based on the raised floor space allocated to the data center facilities. Mega DC - # of Racks must be more than 9000 or RFS (raised floor space) must be more than 225001 Sq. ft; Massive DC - # of Racks must be in between 9000 and 3001 or RFS must be in between 225000 Sq. ft and 75001 Sq. ft; Large DC - # of Racks must be in between 3000 and 801 or RFS must be in between 75000 Sq. ft and 20001 Sq. ft; Medium DC # of Racks must be in between 800 and 201 or RFS must be in between 20000 Sq. ft and 5001 Sq. ft; Small DC - # of Racks must be less than 200 or RFS must be less than 5000 Sq. ft.
- TIER TYPE - According to Uptime Institute the data centers are classified into four tiers based on the proficiencies of redundant equipment of the data center infrastructure. In this segment the data center are segmented as Tier 1,Tier 2, Tier 3 and Tier 4.
- COLOCATION TYPE - The segment is segregated into 3 categories namely Retail, Wholesale and Hyperscale Colocation service. The categorization is done based on the amount of IT load leased out to potential customers. Retail colocation service has leased capacity less than 250 kW; Wholesale colocation services has leased capacity between 251 kW and 4 MW and Hyperscale colocation services has leased capacity more than 4 MW.
- END CONSUMERS - The Data Center Market operates on a B2B basis. BFSI, Government, Cloud Operators, Media and Entertainment, E-Commerce, Telecom and Manufacturing are the major end-consumers in the market studied. The scope only includes colocation service operators catering to the increasing digitalization of the end-user industries.
Research Methodology
Mordor Intelligence follows a four-step methodology in all our reports.
- Step-1: Identify Key Variables: In order to build a robust forecasting methodology, the variables and factors identified in Step-1 are tested against available historical market numbers. Through an iterative process, the variables required for market forecast are set and the model is built on the basis of these variables.
- Step-2: Build a Market Model: Market-size estimations for the forecast years are in nominal terms. Inflation is not a part of the pricing, and the average selling price (ASP) is kept constant throughout the forecast period for each country.
- Step-3: Validate and Finalize: In this important step, all market numbers, variables and analyst calls are validated through an extensive network of primary research experts from the market studied. The respondents are selected across levels and functions to generate a holistic picture of the market studied.
- Step-4: Research Outputs: Syndicated Reports, Custom Consulting Assignments, Databases & Subscription Platforms


