Liquid Crystal Polymers Market Size

| Icons | Lable | Value |
|---|---|---|
|
|
Study Period | 2017 - 2029 |
|
|
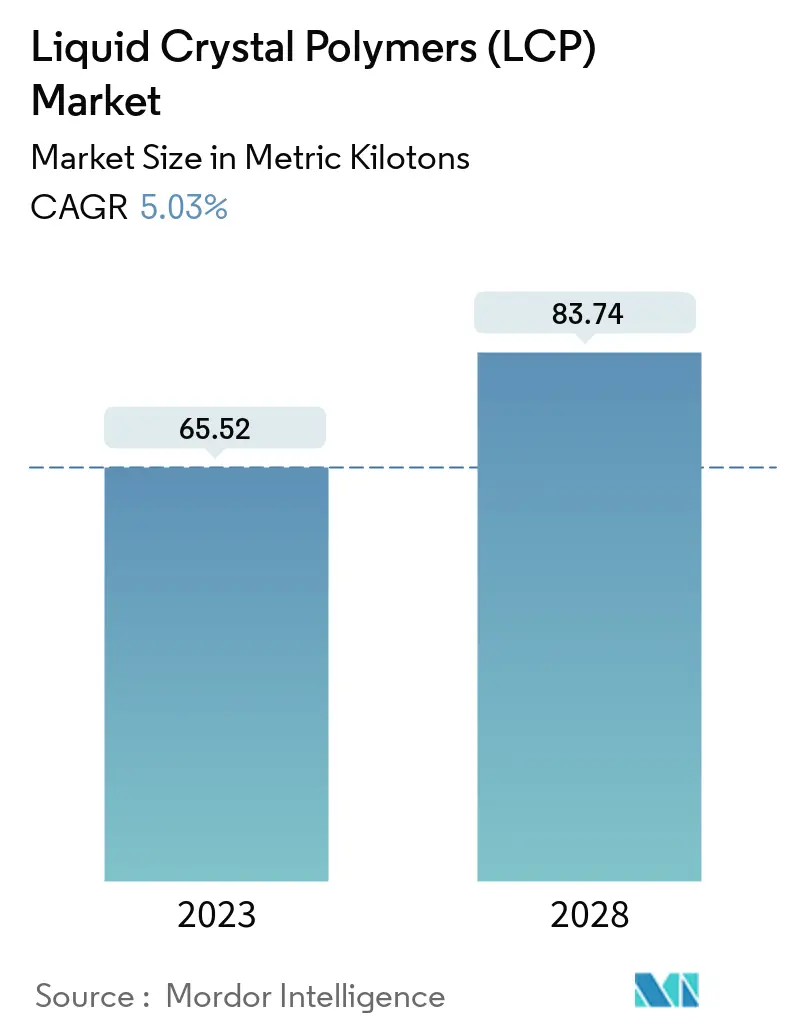
Market Volume (2023) | 65.52 metric kilotons |
|
|
Market Volume (2028) | 83.74 metric kilotons |
|
|
Largest Share by End User Industry | Electrical and Electronics |
|
|
CAGR (2023 - 2028) | 5.03 % |
|
|
Largest Share by Region | Asia-Pacific |
Major Players |
||
|
|
||
|
*Disclaimer: Major Players sorted in no particular order |
Liquid Crystal Polymers Market Analysis
The Global Liquid Crystal Polymer (Lcp) Market size is expected to grow from 65.52 kilo metric tons in 2023 to 83.74 kilo metric tons by 2028, at a CAGR of 5.03% during the forecast period (2023-2028).
- Electrical and Electronics is the Largest End User Industry. Composites of LCP are majorly used in the electronics industry due to rapid innovation, their dielectric properties, and their chemical resistance. Thus, the industry occupied the highest share.
- Aerospace is the Fastest-growing End User Industry. LCP is adopted in microelectronics in the aerospace industry. Thus, the segment is anticipated to witness the fastest growth in the market.
- Asia-Pacific is the Largest Region. Asia-Pacific is majorly driven by emerging economies such as China, India, Japan, and South Korea. Its electronics industry is expected to witness a CAGR of 6.63%, making Asia-Pacific the largest region in the market.
- Middle East is the Fastest-growing Region. With electronics production expected to register a faster CAGR of around 8.7% during the forecast period, the Middle East is projected to be the fastest-growing region.
Liquid Crystal Polymers Market Trends
This section covers the major market trends shaping the Liquid Crystal Polymers (LCP) Market according to our research experts:
RAPID PACE OF TECHNOLOGICAL INNOVATIONS IN THE ELECTRONICS INDUSTRY TO BOOST MARKET DEMAND
- Liquid crystal polymers (LCP) exhibit versatile properties like resistance to creep, chemicals, impact, and abrasion. LCPs also have high dielectric and mechanical strength, due to which they are used widely in the electronics, aerospace, and industrial machinery industries. The LCP market accounted for 0.65% of the revenue of global engineering plastics in 2022.
- The electrical and electronics industry was the largest consumer of LCP resins in 2022. The rising trend of using high-strength and lightweight materials in consumer electronics is expected to drive the demand for LCP resin. Revenue of the global consumer electronics industry is projected to reach USD 1,103 billion by the end of 2023 and grow annually by 2.17% till 2027.
- The industrial machinery industry was the second-largest consumer of LCP resin globally in 2022. The growing trends of rapid urbanization and restoration of offshore exports for machine tools and structural equipment post-pandemic boosted the production of industrial machinery in 2022, resulting in a surge in the consumption of LCP resins. The industrial machinery segment of the global LCP market witnessed a growth of 19.20% by value in 2022 compared to the previous year.
- The aerospace industry is the fastest-growing end-user segment in terms of revenue. It is expected to witness a CAGR of 9.11% by value during the forecast period (2023-2029), which can be attributed to the increased production of aircraft components to cater to the growing demand for lighter and more fuel-efficient aircraft that will increase the consumption of LCP in the future. Aerospace production revenue is expected to reach USD 723 billion by 2029 compared to USD 466 billion in 2022.
_Market__CAGR_____By_End_User_Industry__2023_-_2029.png)
ASIA-PACIFIC REGION TO DOMINATE THE GLOBAL LCP MARKET OVER THE COMING YEARS
- Liquid crystal polymers are extensively used for various applications, such as in thin-walled high-precision parts exposed to high heat, in regions such as Asia-Pacific, North America, and South America. Some of LCP's key applications are in the automotive, electrical and electronic, and industrial machinery end-user industries. Liquid crystal polymers accounted for a 0.65% share of the global engineering plastics market in 2022 by revenue.
- Asia-Pacific witnessed a 3.70% growth in value in 2022 over the previous year. This could be attributed to the electrical and electronics and automotive industries, which accounted for value shares of 75.96% and 69.59%, respectively, of the global demand for LCP from these end-user industries. With an increase in the demand for technology, gaming consoles, and electronic devices due to companies adopting work-from-home models and people setting up home offices, the global LCP market is likely to increase.
- In 2022, North America was the second-largest regional consumer of LCP, with a share of 14.27% by revenue. The region holds a predominant share in the global consumption of LCP as it accounts for the highest number of end-user applications in industry segments such as automotive and electronics. For example, the region accounted for a 10.09% share of global vehicle production and a 9.92% share of global electronic component production in 2022.
- Africa is the second fastest-growing region, and it is expected to grow by 9.82% by value in 2023 compared to 2022, led by the electrical and electronics industry. The major South Korean electrical and electronics brands have a strong foothold in Africa, with Samsung accounting for 35% of the smartphone market. Samsung is the leading investor in the manufacturing and assembly of electronic machinery goods in Ethiopia and Sudan.
_Market__CAGR_____By_Region__2023_-_2029.png)
Liquid Crystal Polymers Industry Overview
The Liquid Crystal Polymers (LCP) Market is fairly consolidated, with the top five companies occupying 80.34%. The major players in this market are Celanese Corporation, Daicel Corporation, Shenzhen WOTE Advanced Materials Co.,Ltd., Solvay and Sumitomo Chemical Co., Ltd. (sorted alphabetically).
Liquid Crystal Polymers Market Leaders
Celanese Corporation
Daicel Corporation
Shenzhen WOTE Advanced Materials Co.,Ltd.
Solvay
Sumitomo Chemical Co., Ltd.
*Disclaimer: Major Players sorted in no particular order
Market/1688721344375_LiquidCrystalPolymers(LCP)Market_market_concentration.png)
Liquid Crystal Polymers Market News
- April 2022: Kingfa SCI. & TECH. Co. Ltd planned to expand its annual LCP production capacity by 6 kilotons by the end of the last month of 2023.
- January 2022: Sumitomo Chemical decided to build additional production lines for its liquid crystal polymer (LCP) SUMIKASUPERTM, which is a super engineering plastic, at its Ehime Works (Niihama, Ehime, Japan).
- September 2021: Shanghai PRET Composite Material Co. Ltd announced that its wholly owned subsidiary, Shanghai Primite Chemical New Materials Co. Ltd, acquired all of the LCP-related business assets of Nantong Haidi New Materials Co. Ltd, reorganizing as part of its financial restructuring program.
Liquid Crystal Polymers Market Report - Table of Contents
1. INTRODUCTION
1.1. Study Assumptions & Market Definition
1.2. Scope of the Study
1.3. Research Methodology
2. KEY INDUSTRY TRENDS
2.1. End User Trends
2.2. Regulatory Framework
2.3. Value Chain & Distribution Channel Analysis
3. MARKET SEGMENTATION
3.1. End User Industry
3.1.1. Aerospace
3.1.2. Automotive
3.1.3. Electrical and Electronics
3.1.4. Industrial and Machinery
3.1.5. Other End-user Industries
3.2. Region
3.2.1. Africa
3.2.1.1. By Country
3.2.1.1.1. Nigeria
3.2.1.1.2. South Africa
3.2.1.1.3. Rest of Africa
3.2.2. Asia-Pacific
3.2.2.1. By Country
3.2.2.1.1. Australia
3.2.2.1.2. China
3.2.2.1.3. India
3.2.2.1.4. Japan
3.2.2.1.5. Malaysia
3.2.2.1.6. South Korea
3.2.2.1.7. Rest of Asia-Pacific
3.2.3. Europe
3.2.3.1. By Country
3.2.3.1.1. France
3.2.3.1.2. Germany
3.2.3.1.3. Italy
3.2.3.1.4. Russia
3.2.3.1.5. United Kingdom
3.2.3.1.6. Rest of Europe
3.2.4. Middle East
3.2.4.1. By Country
3.2.4.1.1. Saudi Arabia
3.2.4.1.2. United Arab Emirates
3.2.4.1.3. Rest of Middle East
3.2.5. North America
3.2.5.1. By Country
3.2.5.1.1. Canada
3.2.5.1.2. Mexico
3.2.5.1.3. United States
3.2.6. South America
3.2.6.1. By Country
3.2.6.1.1. Argentina
3.2.6.1.2. Brazil
3.2.6.1.3. Rest of South America
4. COMPETITIVE LANDSCAPE
4.1. Key Strategic Moves
4.2. Market Share Analysis
4.3. Company Landscape
4.4. Company Profiles
4.4.1. Celanese Corporation
4.4.2. Daicel Corporation
4.4.3. Kingfa SCI. & TECH. CO., LTD.
4.4.4. Ningbo Jujia New Material Technology Co., Ltd
4.4.5. Shanghai PRET Composite Material Co., Ltd.
4.4.6. Shenzhen WOTE Advanced Materials Co.,Ltd.
4.4.7. Solvay
4.4.8. Sumitomo Chemical Co., Ltd.
4.4.9. TORAY INDUSTRIES, INC.
4.4.10. UENO FINE CHEMICALS INDUSTRY, LTD.
5. KEY STRATEGIC QUESTIONS FOR ENGINEERING PLASTICS CEOS
6. APPENDIX
6.1. Global Overview
6.1.1. Overview
6.1.2. Porter’s Five Forces Framework
6.1.3. Global Value Chain Analysis
6.1.4. Market Dynamics (DROs)
6.2. Sources & References
6.3. List of Tables & Figures
6.4. Primary Insights
6.5. Data Pack
6.6. Glossary of Terms
List of Tables & Figures
- Figure 1:
- GLOBAL AEROSPACE COMPONENT PRODUCTION, VALUE IN USD, 2017-2029
- Figure 2:
- GLOBAL AUTOMOBILE PRODUCTION, VOLUME IN UNITS, 2017-2029
- Figure 3:
- GLOBAL NEW CONSTRUCTION FLOOR AREA, IN SQUARE FEET, 2017-2029
- Figure 4:
- GLOBAL ELECTRICAL AND ELECTRONICS PRODUCTION, VALUE IN USD, 2017-2029
- Figure 5:
- GLOBAL PLASTIC PACKAGING PRODUCTION, VOLUME IN TONS, 2017-2029
- Figure 6:
- GLOBAL LIQUID CRYSTAL POLYMERS (LCP) MARKET, VOLUME, TONS, 2017 - 2029
- Figure 7:
- GLOBAL LIQUID CRYSTAL POLYMERS (LCP) MARKET, VALUE, USD, 2017 - 2029
- Figure 8:
- GLOBAL LIQUID CRYSTAL POLYMERS (LCP) MARKET, BY END USER INDUSTRY, VOLUME, TONS, 2017 - 2029
- Figure 9:
- GLOBAL LIQUID CRYSTAL POLYMERS (LCP) MARKET, BY END USER INDUSTRY, VALUE, USD, 2017 - 2029
- Figure 10:
- GLOBAL LIQUID CRYSTAL POLYMERS (LCP) MARKET, BY END USER INDUSTRY, VOLUME SHARE(%), 2017 - 2029
- Figure 11:
- GLOBAL LIQUID CRYSTAL POLYMERS (LCP) MARKET, BY END USER INDUSTRY, VALUE SHARE(%), 2017 - 2029
- Figure 12:
- GLOBAL LIQUID CRYSTAL POLYMERS (LCP) MARKET, AEROSPACE, VOLUME, TONS, 2017 - 2029
- Figure 13:
- GLOBAL LIQUID CRYSTAL POLYMERS (LCP) MARKET, AEROSPACE, VALUE, USD, 2017 - 2029
- Figure 14:
- GLOBAL LIQUID CRYSTAL POLYMERS (LCP) MARKET, AEROSPACE, BY REGION, VALUE SHARE(%), 2022 VS 2029
- Figure 15:
- GLOBAL LIQUID CRYSTAL POLYMERS (LCP) MARKET, AUTOMOTIVE, VOLUME, TONS, 2017 - 2029
- Figure 16:
- GLOBAL LIQUID CRYSTAL POLYMERS (LCP) MARKET, AUTOMOTIVE, VALUE, USD, 2017 - 2029
- Figure 17:
- GLOBAL LIQUID CRYSTAL POLYMERS (LCP) MARKET, AUTOMOTIVE, BY REGION, VALUE SHARE(%), 2022 VS 2029
- Figure 18:
- GLOBAL LIQUID CRYSTAL POLYMERS (LCP) MARKET, ELECTRICAL AND ELECTRONICS, VOLUME, TONS, 2017 - 2029
- Figure 19:
- GLOBAL LIQUID CRYSTAL POLYMERS (LCP) MARKET, ELECTRICAL AND ELECTRONICS, VALUE, USD, 2017 - 2029
- Figure 20:
- GLOBAL LIQUID CRYSTAL POLYMERS (LCP) MARKET, ELECTRICAL AND ELECTRONICS, BY REGION, VALUE SHARE(%), 2022 VS 2029
- Figure 21:
- GLOBAL LIQUID CRYSTAL POLYMERS (LCP) MARKET, INDUSTRIAL AND MACHINERY, VOLUME, TONS, 2017 - 2029
- Figure 22:
- GLOBAL LIQUID CRYSTAL POLYMERS (LCP) MARKET, INDUSTRIAL AND MACHINERY, VALUE, USD, 2017 - 2029
- Figure 23:
- GLOBAL LIQUID CRYSTAL POLYMERS (LCP) MARKET, INDUSTRIAL AND MACHINERY, BY REGION, VALUE SHARE(%), 2022 VS 2029
- Figure 24:
- GLOBAL LIQUID CRYSTAL POLYMERS (LCP) MARKET, OTHER END-USER INDUSTRIES, VOLUME, TONS, 2017 - 2029
- Figure 25:
- GLOBAL LIQUID CRYSTAL POLYMERS (LCP) MARKET, OTHER END-USER INDUSTRIES, VALUE, USD, 2017 - 2029
- Figure 26:
- GLOBAL LIQUID CRYSTAL POLYMERS (LCP) MARKET, OTHER END-USER INDUSTRIES, BY REGION, VALUE SHARE(%), 2022 VS 2029
- Figure 27:
- GLOBAL LIQUID CRYSTAL POLYMERS (LCP) MARKET, BY REGION, VOLUME, TONS, 2017 - 2029
- Figure 28:
- GLOBAL LIQUID CRYSTAL POLYMERS (LCP) MARKET, BY REGION, VALUE, USD, 2017 - 2029
- Figure 29:
- GLOBAL LIQUID CRYSTAL POLYMERS (LCP) MARKET, BY REGION, VOLUME SHARE(%), 2017 - 2029
- Figure 30:
- GLOBAL LIQUID CRYSTAL POLYMERS (LCP) MARKET, BY REGION, VALUE SHARE(%), 2017 - 2029
- Figure 31:
- GLOBAL LIQUID CRYSTAL POLYMERS (LCP) MARKET, BY COUNTRY, AFRICA, VOLUME, TONS, 2017 - 2029
- Figure 32:
- GLOBAL LIQUID CRYSTAL POLYMERS (LCP) MARKET, BY COUNTRY, AFRICA, VALUE, USD, 2017 - 2029
- Figure 33:
- GLOBAL LIQUID CRYSTAL POLYMERS (LCP) MARKET, BY COUNTRY, AFRICA, VOLUME SHARE(%), 2017 - 2029
- Figure 34:
- GLOBAL LIQUID CRYSTAL POLYMERS (LCP) MARKET, BY COUNTRY, AFRICA, VALUE SHARE(%), 2017 - 2029
- Figure 35:
- GLOBAL LIQUID CRYSTAL POLYMERS (LCP) MARKET, NIGERIA, VOLUME, TONS, 2017 - 2029
- Figure 36:
- GLOBAL LIQUID CRYSTAL POLYMERS (LCP) MARKET, NIGERIA, VALUE, USD, 2017 - 2029
- Figure 37:
- GLOBAL LIQUID CRYSTAL POLYMERS (LCP) MARKET, NIGERIA, BY END USER INDUSTRY, VALUE SHARE(%), 2022 VS 2029
- Figure 38:
- GLOBAL LIQUID CRYSTAL POLYMERS (LCP) MARKET, SOUTH AFRICA, VOLUME, TONS, 2017 - 2029
- Figure 39:
- GLOBAL LIQUID CRYSTAL POLYMERS (LCP) MARKET, SOUTH AFRICA, VALUE, USD, 2017 - 2029
- Figure 40:
- GLOBAL LIQUID CRYSTAL POLYMERS (LCP) MARKET, SOUTH AFRICA, BY END USER INDUSTRY, VALUE SHARE(%), 2022 VS 2029
- Figure 41:
- GLOBAL LIQUID CRYSTAL POLYMERS (LCP) MARKET, REST OF AFRICA, VOLUME, TONS, 2017 - 2029
- Figure 42:
- GLOBAL LIQUID CRYSTAL POLYMERS (LCP) MARKET, REST OF AFRICA, VALUE, USD, 2017 - 2029
- Figure 43:
- GLOBAL LIQUID CRYSTAL POLYMERS (LCP) MARKET, REST OF AFRICA, BY END USER INDUSTRY, VALUE SHARE(%), 2022 VS 2029
- Figure 44:
- GLOBAL LIQUID CRYSTAL POLYMERS (LCP) MARKET, BY COUNTRY, ASIA-PACIFIC, VOLUME, TONS, 2017 - 2029
- Figure 45:
- GLOBAL LIQUID CRYSTAL POLYMERS (LCP) MARKET, BY COUNTRY, ASIA-PACIFIC, VALUE, USD, 2017 - 2029
- Figure 46:
- GLOBAL LIQUID CRYSTAL POLYMERS (LCP) MARKET, BY COUNTRY, ASIA-PACIFIC, VOLUME SHARE(%), 2017 - 2029
- Figure 47:
- GLOBAL LIQUID CRYSTAL POLYMERS (LCP) MARKET, BY COUNTRY, ASIA-PACIFIC, VALUE SHARE(%), 2017 - 2029
- Figure 48:
- GLOBAL LIQUID CRYSTAL POLYMERS (LCP) MARKET, AUSTRALIA, VOLUME, TONS, 2017 - 2029
- Figure 49:
- GLOBAL LIQUID CRYSTAL POLYMERS (LCP) MARKET, AUSTRALIA, VALUE, USD, 2017 - 2029
- Figure 50:
- GLOBAL LIQUID CRYSTAL POLYMERS (LCP) MARKET, AUSTRALIA, BY END USER INDUSTRY, VALUE SHARE(%), 2022 VS 2029
- Figure 51:
- GLOBAL LIQUID CRYSTAL POLYMERS (LCP) MARKET, CHINA, VOLUME, TONS, 2017 - 2029
- Figure 52:
- GLOBAL LIQUID CRYSTAL POLYMERS (LCP) MARKET, CHINA, VALUE, USD, 2017 - 2029
- Figure 53:
- GLOBAL LIQUID CRYSTAL POLYMERS (LCP) MARKET, CHINA, BY END USER INDUSTRY, VALUE SHARE(%), 2022 VS 2029
- Figure 54:
- GLOBAL LIQUID CRYSTAL POLYMERS (LCP) MARKET, INDIA, VOLUME, TONS, 2017 - 2029
- Figure 55:
- GLOBAL LIQUID CRYSTAL POLYMERS (LCP) MARKET, INDIA, VALUE, USD, 2017 - 2029
- Figure 56:
- GLOBAL LIQUID CRYSTAL POLYMERS (LCP) MARKET, INDIA, BY END USER INDUSTRY, VALUE SHARE(%), 2022 VS 2029
- Figure 57:
- GLOBAL LIQUID CRYSTAL POLYMERS (LCP) MARKET, JAPAN, VOLUME, TONS, 2017 - 2029
- Figure 58:
- GLOBAL LIQUID CRYSTAL POLYMERS (LCP) MARKET, JAPAN, VALUE, USD, 2017 - 2029
- Figure 59:
- GLOBAL LIQUID CRYSTAL POLYMERS (LCP) MARKET, JAPAN, BY END USER INDUSTRY, VALUE SHARE(%), 2022 VS 2029
- Figure 60:
- GLOBAL LIQUID CRYSTAL POLYMERS (LCP) MARKET, MALAYSIA, VOLUME, TONS, 2017 - 2029
- Figure 61:
- GLOBAL LIQUID CRYSTAL POLYMERS (LCP) MARKET, MALAYSIA, VALUE, USD, 2017 - 2029
- Figure 62:
- GLOBAL LIQUID CRYSTAL POLYMERS (LCP) MARKET, MALAYSIA, BY END USER INDUSTRY, VALUE SHARE(%), 2022 VS 2029
- Figure 63:
- GLOBAL LIQUID CRYSTAL POLYMERS (LCP) MARKET, SOUTH KOREA, VOLUME, TONS, 2017 - 2029
- Figure 64:
- GLOBAL LIQUID CRYSTAL POLYMERS (LCP) MARKET, SOUTH KOREA, VALUE, USD, 2017 - 2029
- Figure 65:
- GLOBAL LIQUID CRYSTAL POLYMERS (LCP) MARKET, SOUTH KOREA, BY END USER INDUSTRY, VALUE SHARE(%), 2022 VS 2029
- Figure 66:
- GLOBAL LIQUID CRYSTAL POLYMERS (LCP) MARKET, REST OF ASIA-PACIFIC, VOLUME, TONS, 2017 - 2029
- Figure 67:
- GLOBAL LIQUID CRYSTAL POLYMERS (LCP) MARKET, REST OF ASIA-PACIFIC, VALUE, USD, 2017 - 2029
- Figure 68:
- GLOBAL LIQUID CRYSTAL POLYMERS (LCP) MARKET, REST OF ASIA-PACIFIC, BY END USER INDUSTRY, VALUE SHARE(%), 2022 VS 2029
- Figure 69:
- GLOBAL LIQUID CRYSTAL POLYMERS (LCP) MARKET, BY COUNTRY, EUROPE, VOLUME, TONS, 2017 - 2029
- Figure 70:
- GLOBAL LIQUID CRYSTAL POLYMERS (LCP) MARKET, BY COUNTRY, EUROPE, VALUE, USD, 2017 - 2029
- Figure 71:
- GLOBAL LIQUID CRYSTAL POLYMERS (LCP) MARKET, BY COUNTRY, EUROPE, VOLUME SHARE(%), 2017 - 2029
- Figure 72:
- GLOBAL LIQUID CRYSTAL POLYMERS (LCP) MARKET, BY COUNTRY, EUROPE, VALUE SHARE(%), 2017 - 2029
- Figure 73:
- GLOBAL LIQUID CRYSTAL POLYMERS (LCP) MARKET, FRANCE, VOLUME, TONS, 2017 - 2029
- Figure 74:
- GLOBAL LIQUID CRYSTAL POLYMERS (LCP) MARKET, FRANCE, VALUE, USD, 2017 - 2029
- Figure 75:
- GLOBAL LIQUID CRYSTAL POLYMERS (LCP) MARKET, FRANCE, BY END USER INDUSTRY, VALUE SHARE(%), 2022 VS 2029
- Figure 76:
- GLOBAL LIQUID CRYSTAL POLYMERS (LCP) MARKET, GERMANY, VOLUME, TONS, 2017 - 2029
- Figure 77:
- GLOBAL LIQUID CRYSTAL POLYMERS (LCP) MARKET, GERMANY, VALUE, USD, 2017 - 2029
- Figure 78:
- GLOBAL LIQUID CRYSTAL POLYMERS (LCP) MARKET, GERMANY, BY END USER INDUSTRY, VALUE SHARE(%), 2022 VS 2029
- Figure 79:
- GLOBAL LIQUID CRYSTAL POLYMERS (LCP) MARKET, ITALY, VOLUME, TONS, 2017 - 2029
- Figure 80:
- GLOBAL LIQUID CRYSTAL POLYMERS (LCP) MARKET, ITALY, VALUE, USD, 2017 - 2029
- Figure 81:
- GLOBAL LIQUID CRYSTAL POLYMERS (LCP) MARKET, ITALY, BY END USER INDUSTRY, VALUE SHARE(%), 2022 VS 2029
- Figure 82:
- GLOBAL LIQUID CRYSTAL POLYMERS (LCP) MARKET, RUSSIA, VOLUME, TONS, 2017 - 2029
- Figure 83:
- GLOBAL LIQUID CRYSTAL POLYMERS (LCP) MARKET, RUSSIA, VALUE, USD, 2017 - 2029
- Figure 84:
- GLOBAL LIQUID CRYSTAL POLYMERS (LCP) MARKET, RUSSIA, BY END USER INDUSTRY, VALUE SHARE(%), 2022 VS 2029
- Figure 85:
- GLOBAL LIQUID CRYSTAL POLYMERS (LCP) MARKET, UNITED KINGDOM, VOLUME, TONS, 2017 - 2029
- Figure 86:
- GLOBAL LIQUID CRYSTAL POLYMERS (LCP) MARKET, UNITED KINGDOM, VALUE, USD, 2017 - 2029
- Figure 87:
- GLOBAL LIQUID CRYSTAL POLYMERS (LCP) MARKET, UNITED KINGDOM, BY END USER INDUSTRY, VALUE SHARE(%), 2022 VS 2029
- Figure 88:
- GLOBAL LIQUID CRYSTAL POLYMERS (LCP) MARKET, REST OF EUROPE, VOLUME, TONS, 2017 - 2029
- Figure 89:
- GLOBAL LIQUID CRYSTAL POLYMERS (LCP) MARKET, REST OF EUROPE, VALUE, USD, 2017 - 2029
- Figure 90:
- GLOBAL LIQUID CRYSTAL POLYMERS (LCP) MARKET, REST OF EUROPE, BY END USER INDUSTRY, VALUE SHARE(%), 2022 VS 2029
- Figure 91:
- GLOBAL LIQUID CRYSTAL POLYMERS (LCP) MARKET, BY COUNTRY, MIDDLE EAST, VOLUME, TONS, 2017 - 2029
- Figure 92:
- GLOBAL LIQUID CRYSTAL POLYMERS (LCP) MARKET, BY COUNTRY, MIDDLE EAST, VALUE, USD, 2017 - 2029
- Figure 93:
- GLOBAL LIQUID CRYSTAL POLYMERS (LCP) MARKET, BY COUNTRY, MIDDLE EAST, VOLUME SHARE(%), 2017 - 2029
- Figure 94:
- GLOBAL LIQUID CRYSTAL POLYMERS (LCP) MARKET, BY COUNTRY, MIDDLE EAST, VALUE SHARE(%), 2017 - 2029
- Figure 95:
- GLOBAL LIQUID CRYSTAL POLYMERS (LCP) MARKET, SAUDI ARABIA, VOLUME, TONS, 2017 - 2029
- Figure 96:
- GLOBAL LIQUID CRYSTAL POLYMERS (LCP) MARKET, SAUDI ARABIA, VALUE, USD, 2017 - 2029
- Figure 97:
- GLOBAL LIQUID CRYSTAL POLYMERS (LCP) MARKET, SAUDI ARABIA, BY END USER INDUSTRY, VALUE SHARE(%), 2022 VS 2029
- Figure 98:
- GLOBAL LIQUID CRYSTAL POLYMERS (LCP) MARKET, UNITED ARAB EMIRATES, VOLUME, TONS, 2017 - 2029
- Figure 99:
- GLOBAL LIQUID CRYSTAL POLYMERS (LCP) MARKET, UNITED ARAB EMIRATES, VALUE, USD, 2017 - 2029
- Figure 100:
- GLOBAL LIQUID CRYSTAL POLYMERS (LCP) MARKET, UNITED ARAB EMIRATES, BY END USER INDUSTRY, VALUE SHARE(%), 2022 VS 2029
- Figure 101:
- GLOBAL LIQUID CRYSTAL POLYMERS (LCP) MARKET, REST OF MIDDLE EAST, VOLUME, TONS, 2017 - 2029
- Figure 102:
- GLOBAL LIQUID CRYSTAL POLYMERS (LCP) MARKET, REST OF MIDDLE EAST, VALUE, USD, 2017 - 2029
- Figure 103:
- GLOBAL LIQUID CRYSTAL POLYMERS (LCP) MARKET, REST OF MIDDLE EAST, BY END USER INDUSTRY, VALUE SHARE(%), 2022 VS 2029
- Figure 104:
- GLOBAL LIQUID CRYSTAL POLYMERS (LCP) MARKET, BY COUNTRY, NORTH AMERICA, VOLUME, TONS, 2017 - 2029
- Figure 105:
- GLOBAL LIQUID CRYSTAL POLYMERS (LCP) MARKET, BY COUNTRY, NORTH AMERICA, VALUE, USD, 2017 - 2029
- Figure 106:
- GLOBAL LIQUID CRYSTAL POLYMERS (LCP) MARKET, BY COUNTRY, NORTH AMERICA, VOLUME SHARE(%), 2017 - 2029
- Figure 107:
- GLOBAL LIQUID CRYSTAL POLYMERS (LCP) MARKET, BY COUNTRY, NORTH AMERICA, VALUE SHARE(%), 2017 - 2029
- Figure 108:
- GLOBAL LIQUID CRYSTAL POLYMERS (LCP) MARKET, CANADA, VOLUME, TONS, 2017 - 2029
- Figure 109:
- GLOBAL LIQUID CRYSTAL POLYMERS (LCP) MARKET, CANADA, VALUE, USD, 2017 - 2029
- Figure 110:
- GLOBAL LIQUID CRYSTAL POLYMERS (LCP) MARKET, CANADA, BY END USER INDUSTRY, VALUE SHARE(%), 2022 VS 2029
- Figure 111:
- GLOBAL LIQUID CRYSTAL POLYMERS (LCP) MARKET, MEXICO, VOLUME, TONS, 2017 - 2029
- Figure 112:
- GLOBAL LIQUID CRYSTAL POLYMERS (LCP) MARKET, MEXICO, VALUE, USD, 2017 - 2029
- Figure 113:
- GLOBAL LIQUID CRYSTAL POLYMERS (LCP) MARKET, MEXICO, BY END USER INDUSTRY, VALUE SHARE(%), 2022 VS 2029
- Figure 114:
- GLOBAL LIQUID CRYSTAL POLYMERS (LCP) MARKET, UNITED STATES, VOLUME, TONS, 2017 - 2029
- Figure 115:
- GLOBAL LIQUID CRYSTAL POLYMERS (LCP) MARKET, UNITED STATES, VALUE, USD, 2017 - 2029
- Figure 116:
- GLOBAL LIQUID CRYSTAL POLYMERS (LCP) MARKET, UNITED STATES, BY END USER INDUSTRY, VALUE SHARE(%), 2022 VS 2029
- Figure 117:
- GLOBAL LIQUID CRYSTAL POLYMERS (LCP) MARKET, BY COUNTRY, SOUTH AMERICA, VOLUME, TONS, 2017 - 2029
- Figure 118:
- GLOBAL LIQUID CRYSTAL POLYMERS (LCP) MARKET, BY COUNTRY, SOUTH AMERICA, VALUE, USD, 2017 - 2029
- Figure 119:
- GLOBAL LIQUID CRYSTAL POLYMERS (LCP) MARKET, BY COUNTRY, SOUTH AMERICA, VOLUME SHARE(%), 2017 - 2029
- Figure 120:
- GLOBAL LIQUID CRYSTAL POLYMERS (LCP) MARKET, BY COUNTRY, SOUTH AMERICA, VALUE SHARE(%), 2017 - 2029
- Figure 121:
- GLOBAL LIQUID CRYSTAL POLYMERS (LCP) MARKET, ARGENTINA, VOLUME, TONS, 2017 - 2029
- Figure 122:
- GLOBAL LIQUID CRYSTAL POLYMERS (LCP) MARKET, ARGENTINA, VALUE, USD, 2017 - 2029
- Figure 123:
- GLOBAL LIQUID CRYSTAL POLYMERS (LCP) MARKET, ARGENTINA, BY END USER INDUSTRY, VALUE SHARE(%), 2022 VS 2029
- Figure 124:
- GLOBAL LIQUID CRYSTAL POLYMERS (LCP) MARKET, BRAZIL, VOLUME, TONS, 2017 - 2029
- Figure 125:
- GLOBAL LIQUID CRYSTAL POLYMERS (LCP) MARKET, BRAZIL, VALUE, USD, 2017 - 2029
- Figure 126:
- GLOBAL LIQUID CRYSTAL POLYMERS (LCP) MARKET, BRAZIL, BY END USER INDUSTRY, VALUE SHARE(%), 2022 VS 2029
- Figure 127:
- GLOBAL LIQUID CRYSTAL POLYMERS (LCP) MARKET, REST OF SOUTH AMERICA, VOLUME, TONS, 2017 - 2029
- Figure 128:
- GLOBAL LIQUID CRYSTAL POLYMERS (LCP) MARKET, REST OF SOUTH AMERICA, VALUE, USD, 2017 - 2029
- Figure 129:
- GLOBAL LIQUID CRYSTAL POLYMERS (LCP) MARKET, REST OF SOUTH AMERICA, BY END USER INDUSTRY, VALUE SHARE(%), 2022 VS 2029
- Figure 130:
- GLOBAL LIQUID CRYSTAL POLYMERS (LCP) MARKET, MOST ACTIVE COMPANIES, BY NUMBER OF STRATEGIC MOVES, 2019 - 2021
- Figure 131:
- GLOBAL LIQUID CRYSTAL POLYMERS (LCP) MARKET, MOST ADOPTED STRATEGIES, 2019 - 2021
- Figure 132:
- GLOBAL LIQUID CRYSTAL POLYMER (LCP) MARKET SHARE(%), BY MAJOR PLAYERS PRODUCTION CAPACITY, 2022
Liquid Crystal Polymers Industry Segmentation
Aerospace, Automotive, Electrical and Electronics, Industrial and Machinery are covered as segments by End User Industry. Africa, Asia-Pacific, Europe, Middle East, North America, South America are covered as segments by Region.| End User Industry | |
| Aerospace | |
| Automotive | |
| Electrical and Electronics | |
| Industrial and Machinery | |
| Other End-user Industries |
| Region | |||||||||||
| |||||||||||
| |||||||||||
| |||||||||||
| |||||||||||
| |||||||||||
|
Market Definition
- End-user Industry - Aerospace, Industrial Machinery, Electrical & Electronics, and Others are the end-user industries considered under the liquid crystal polymer market.
- Resin - Under the scope of the study, virgin liquid crystal polymer resin in the primary forms such as powder, pellet, etc. are considered.
Research Methodology
Mordor Intelligence follows a four-step methodology in all our reports.
- Step-1: Identify Key Variables: The quantifiable key variables (industry and extraneous) pertaining to the specific product segment and country are selected from a group of relevant variables & factors based on desk research & literature review; along with primary expert inputs. These variables are further confirmed through regression modeling (wherever required).
- Step-2: Build a Market Model: In order to build a robust forecasting methodology, the variables and factors identified in Step-1 are tested against available historical market numbers. Through an iterative process, the variables required for market forecast are set and the model is built on the basis of these variables.
- Step-3: Validate and Finalize: In this important step, all market numbers, variables and analyst calls are validated through an extensive network of primary research experts from the market studied. The respondents are selected across levels and functions to generate a holistic picture of the market studied.
- Step-4: Research Outputs: Syndicated Reports, Custom Consulting Assignments, Databases & Subscription Platforms


