Netherlands Data Center Market Size

| Icons | Lable | Value |
|---|---|---|
|
|
Study Period | 2017 - 2029 |
|
|
Market Size (2023) | USD 4.63 Billion |
|
|
Market Size (2028) | USD 5.84 Billion |
|
|
CAGR (2023 - 2028) | 4.75 % |
|
|
Largest Share by Tier Type | Tier 3 |
|
|
Fastest Growing by Tier Type | Tier 4 |
Major Players |
||
|
|
||
|
*Disclaimer: Major Players sorted in no particular order |
Netherlands Data Center Market Analysis
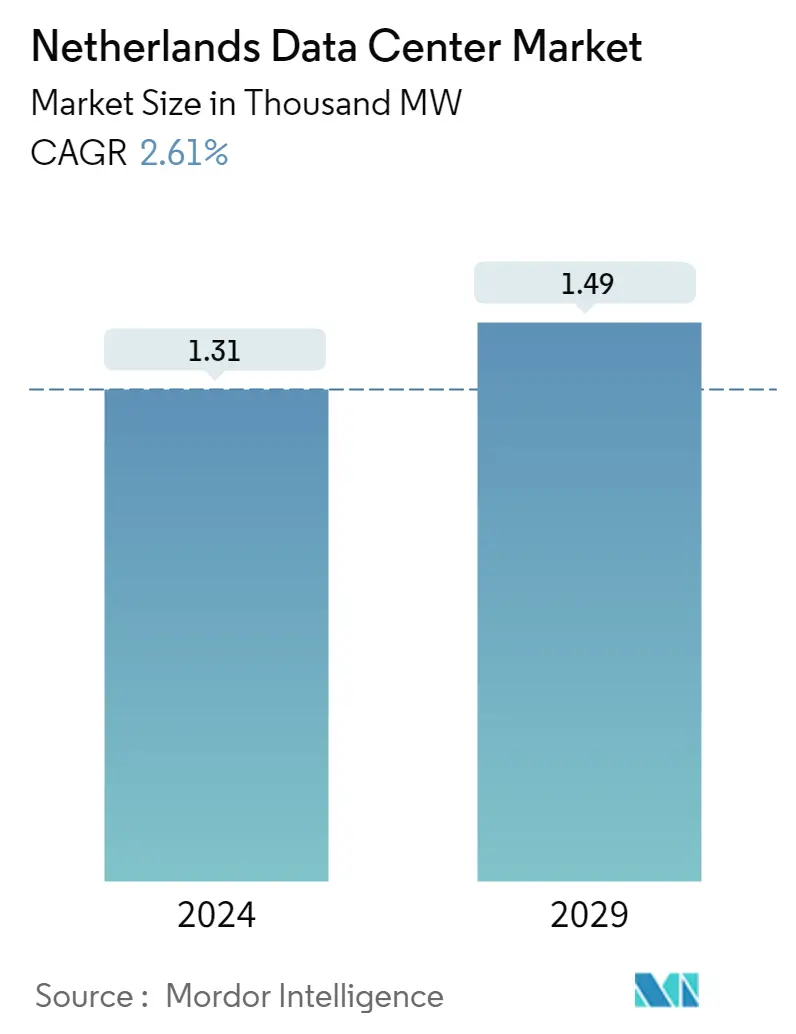
The Netherlands Data Center Market size is expected to grow from USD 4.63 billion in 2023 to USD 5.84 billion by 2028, at a CAGR of 4.75% during the forecast period (2023-2028).
- IT Load Capacity: The IT load capacity of the data center market in the Netherlands may grow steadily and reach 1490.2 MW by 2029.
- Raised Floor Space: The country's total raised floor area is expected to reach 6.7 million sq. ft by 2029.
- Installed Racks: The total number of installed racks is expected to reach 338,134 units by 2029. Amsterdam will likely house the maximum number of racks by 2029.
- DC Facilities: The Netherlands has 107 colocation data centers, with Amsterdam as the major hotspot. The growing adoption of the cloud by most businesses is one of the factors boosting the number of data centers in the country.
- Leading Market Player: Equinix Inc. has 11 data center facilities in the Netherlands, with 586,051.0 sq. ft of net rentable capacity, an IT load capacity of 163.40 MW, and average racks of more than 29,000 units.
Netherlands Data Center Market Trends
This section covers the major market trends shaping the Netherlands Data Center Market according to our research experts:
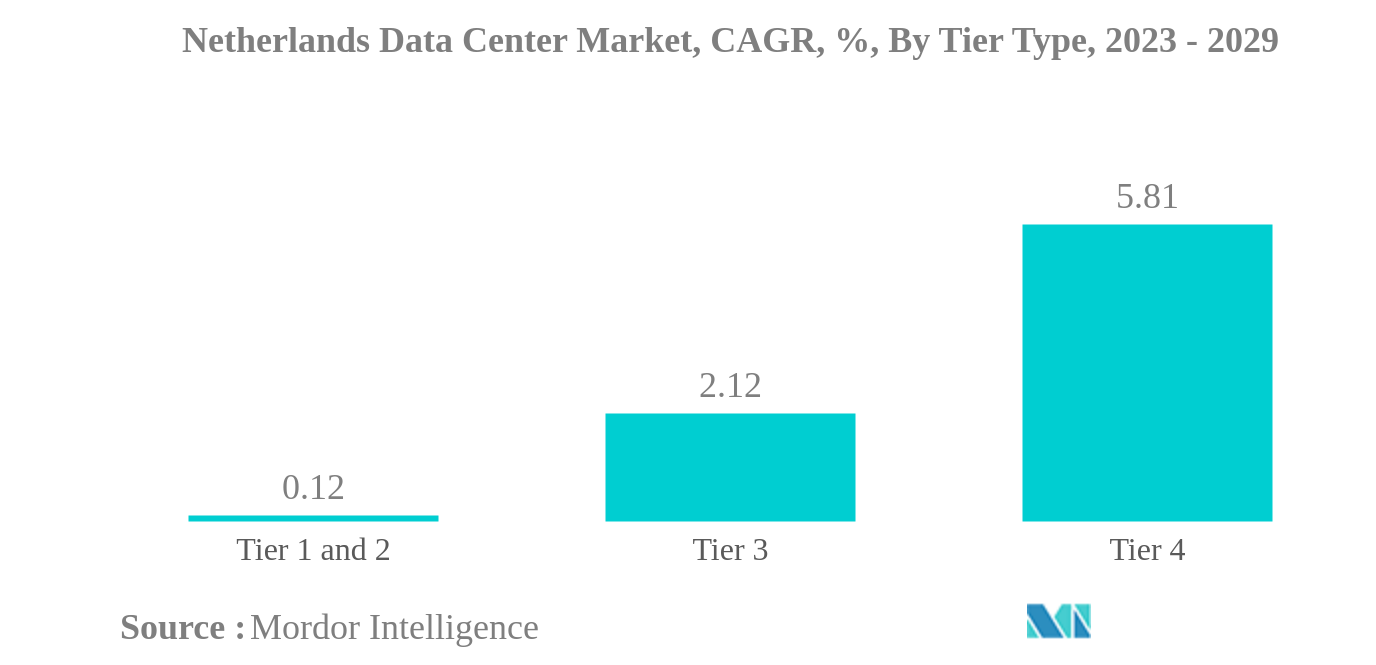
Tier 3 is the largest Tier Type
- Tier 1 & 2 facilities are becoming less popular owing to the increasing demand for high computing power and data storage facilities. With the rise of business continuity services 24 hours a day, tier 3 and tier 4 data centers have increasingly become more popular due to the ever-growing number of conglomerates.
- The tier 3 data center is expected to reach 974.38 MW in 2023. It is projected to register a CAGR of 2.12%, reaching 1105.23 MW by 2029. On the other hand, the tier 4 data center is predicted to register a CAGR of 5.81% to reach a capacity of 368.44 MW by 2029.
- As technology advanced, the population began utilizing a variety of internet-connected devices, including smartphones, consoles, and smart gear, to access services like streaming entertainment, online gaming, and others. Tier 3 certified facilities are ideal for such services and are expected to hold the highest market share of 74.2% in 2029, followed by tier 4 facilities with 24.7% of the market.
- In order to better serve their customers, clients have to raise their rack capacities as a result of the population's adoption of other devices. In addition, they have to ensure the availability of the appropriate speeds owing to the 5G launch. As a result, the nation adopted cloud computing, the internet, and fiber technologies, formulating tier 3 and 4 data center infrastructure for better data storage solutions.
Netherlands Data Center Industry Overview
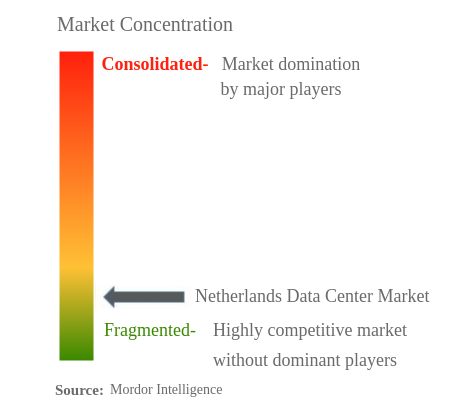
The Netherlands Data Center Market is fragmented, with the top five companies occupying 29.36%. The major players in this market are EdgeConneX, Inc., Equinix, Inc., Evoswitch Internantional B.V., Iron Mountain Incorporated and SD Data Center (sorted alphabetically).
Netherlands Data Center Market Leaders
EdgeConneX, Inc.
Equinix, Inc.
Evoswitch Internantional B.V.
Iron Mountain Incorporated
SD Data Center
*Disclaimer: Major Players sorted in no particular order
Netherlands Data Center Market News
- December 2022: A new data center is being built in Eindhoven by NorthC Datacenters, a local provider of data centers in the Netherlands. In October 2023, the latest data center will start operating, which will have a total surface area of nearly 4,000m2.
- September 2022: A hosting and cloud services provider called Leaseweb Global stated that it would open three new data centers in Tokyo, Singapore, and Sydney before the year is out to increase its footprint in the Asia Pacific region. When the new sites go live, Leaseweb will have nine data centers operating all across the area.
- April 2022: The regional Dutch data center provider NorthC Datacenters has a contract to buy the Swiss data centers and connection offerings of Netrics. The deal consists of three data centers with a combined floor area of around 13,000 m2, a power capacity of over 7.5MW, and room for future growth, two of which are located in Münchenstein (near Basel) and one in Biel.
Netherlands Data Center Market Report - Table of Contents
1. INTRODUCTION
1.1. Study Assumptions & Market Definition
1.2. Scope of the Study
1.3. Research Methodology
2. MARKET OUTLOOK
2.1. IT Load Capacity
2.2. Raised Floor Space
2.3. Colocation Revenue
2.4. Installed Racks
2.5. Rack Space Utilization
2.6. Submarine Cable
3. KEY INDUSTRY TRENDS
3.1. Smartphone Users
3.2. Data Traffic Per Smartphone
3.3. Mobile Data Speed
3.4. Broadband Data Speed
3.5. Fiber Connectivity Network
3.6. Regulatory Framework
3.7. Value Chain & Distribution Channel Analysis
4. MARKET SEGMENTATION
4.1. Hotspot
4.1.1. Amsterdam
4.1.2. Rest of Netherlands
4.2. Data Center Size
4.2.1. Large
4.2.2. Massive
4.2.3. Medium
4.2.4. Mega
4.2.5. Small
4.3. Tier Type
4.3.1. Tier 1 and 2
4.3.2. Tier 3
4.3.3. Tier 4
4.4. Absorption
4.4.1. Non-Utilized
4.4.2. Utilized
4.4.2.1. By Colocation Type
4.4.2.1.1. Hyperscale
4.4.2.1.2. Retail
4.4.2.1.3. Wholesale
4.4.2.2. By End User
4.4.2.2.1. BFSI
4.4.2.2.2. Cloud
4.4.2.2.3. E-Commerce
4.4.2.2.4. Government
4.4.2.2.5. Manufacturing
4.4.2.2.6. Media & Entertainment
4.4.2.2.7. Telecom
4.4.2.2.8. Other End User
5. COMPETITIVE LANDSCAPE
5.1. Market Share Analysis
5.2. Company Landscape
5.3. Company Profiles
5.3.1. CyrusOne Inc.
5.3.2. EdgeConneX, Inc.
5.3.3. Equinix, Inc.
5.3.4. Evoswitch Internantional B.V.
5.3.5. Global Switch Holdings Limited
5.3.6. Interxion (Digital Reality Trust, Inc.)
5.3.7. Iron Mountain Incorporated
5.3.8. Keppel DC REIT Management Pte. Ltd.
5.3.9. Leaseweb Global B.V.
5.3.10. NorthC Group B.V.
5.3.11. QTS Realty Trust, Inc.
5.3.12. SD Data Center
5.4. LIST OF COMPANIES STUDIED
6. KEY STRATEGIC QUESTIONS FOR DATA CENTER CEOS
7. APPENDIX
7.1. Global Overview
7.1.1. Overview
7.1.2. Porter’s Five Forces Framework
7.1.3. Global Value Chain Analysis
7.1.4. Global Market Size and DROs
7.2. Sources & References
7.3. List of Tables & Figures
7.4. Primary Insights
7.5. Data Pack
7.6. Glossary of Terms
List of Tables & Figures
- Figure 1:
- NETHERLANDS DATA CENTER MARKET, IT LOAD CAPACITY, VOLUME IN MW, 2017 - 2029
- Figure 2:
- NETHERLANDS DATA CENTER MARKET, RAISED FLOOR SPACE, VOLUME IN SQ. FT.(000'), 2017 - 2029
- Figure 3:
- NETHERLANDS DATA CENTER MARKET, COLOCATION REVENUE, VALUE IN USD MILLION, 2017 - 2029
- Figure 4:
- NETHERLANDS DATA CENTER MARKET, INSTALLED RACKS, VALUE IN UNIT, 2017 - 2029
- Figure 5:
- NETHERLANDS DATA CENTER MARKET, RACK SPACE UTILIZATION, VALUE IN (%), 2017 - 2029
- Figure 6:
- NETHERLANDS DATA CENTER MARKET, SMARTPHONE USERS, VOLUME IN MILLION, 2017 - 2029
- Figure 7:
- NETHERLANDS DATA CENTER MARKET, DATA TRAFFIC PER SMARTPHONE, VOLUME IN GB, 2017 - 2029
- Figure 8:
- NETHERLANDS DATA CENTER MARKET, MOBILE DATA SPEED, VOLUME IN MBPS, 2017 - 2029
- Figure 9:
- NETHERLANDS DATA CENTER MARKET, BROADBAND SPEED, VOLUME IN MBPS, 2017 - 2029
- Figure 10:
- NETHERLANDS DATA CENTER MARKET, FIBER CONNECTIVITY NETWORK, VOLUME IN KILOMETER, 2017 - 2029
- Figure 11:
- NETHERLANDS DATA CENTER MARKET, VOLUME, MW, 2017 - 2029
- Figure 12:
- NETHERLANDS DATA CENTER MARKET, BY HOTSPOT, VOLUME IN MW, 2017 - 2029
- Figure 13:
- NETHERLANDS DATA CENTER MARKET, SHARE(%), BY HOTSPOT, 2017 - 2023 - 2029
- Figure 14:
- NETHERLANDS DATA CENTER MARKET, AMSTERDAM, VOLUME IN MW, 2017 - 2029
- Figure 15:
- NETHERLANDS DATA CENTER MARKET, BY DATA CENTER SIZE, AMSTERDAM, VOLUME SHARE (%), 2022 - 2029
- Figure 16:
- NETHERLANDS DATA CENTER MARKET, REST OF NETHERLANDS, VOLUME IN MW, 2017 - 2029
- Figure 17:
- NETHERLANDS DATA CENTER MARKET, BY DATA CENTER SIZE, REST OF NETHERLANDS, VOLUME SHARE (%), 2022 - 2029
- Figure 18:
- NETHERLANDS DATA CENTER MARKET, BY DATA CENTER SIZE, VOLUME IN MW, 2017 - 2029
- Figure 19:
- NETHERLANDS DATA CENTER MARKET, SHARE(%), BY DATA CENTER SIZE, 2017 - 2023 - 2029
- Figure 20:
- NETHERLANDS DATA CENTER MARKET, LARGE, VOLUME IN MW, 2017 - 2029
- Figure 21:
- NETHERLANDS DATA CENTER MARKET, MASSIVE, VOLUME IN MW, 2017 - 2029
- Figure 22:
- NETHERLANDS DATA CENTER MARKET, MEDIUM, VOLUME IN MW, 2017 - 2029
- Figure 23:
- NETHERLANDS DATA CENTER MARKET, MEGA, VOLUME IN MW, 2017 - 2029
- Figure 24:
- NETHERLANDS DATA CENTER MARKET, SMALL, VOLUME IN MW, 2017 - 2029
- Figure 25:
- NETHERLANDS DATA CENTER MARKET, BY TIER TYPE, VOLUME IN MW, 2017 - 2029
- Figure 26:
- NETHERLANDS DATA CENTER MARKET, SHARE(%), BY TIER TYPE, 2017 - 2023 - 2029
- Figure 27:
- NETHERLANDS DATA CENTER MARKET, TIER 1&2, VOLUME IN MW, 2017 - 2029
- Figure 28:
- NETHERLANDS DATA CENTER MARKET, TIER 3, VOLUME IN MW, 2017 - 2029
- Figure 29:
- NETHERLANDS DATA CENTER MARKET, TIER 4, VOLUME IN MW, 2017 - 2029
- Figure 30:
- NETHERLANDS DATA CENTER MARKET, BY ABSORPTION, VOLUME IN MW, 2017 - 2029
- Figure 31:
- NETHERLANDS DATA CENTER MARKET, SHARE(%), BY ABSORPTION, 2017 - 2023 - 2029
- Figure 32:
- NETHERLANDS DATA CENTER MARKET, NON-UTILIZED, VOLUME IN MW, 2017 - 2029
- Figure 33:
- NETHERLANDS DATA CENTER MARKET, BY COLOCATION TYPE, VOLUME IN MW, 2017 - 2029
- Figure 34:
- NETHERLANDS DATA CENTER MARKET, SHARE(%), BY COLOCATION TYPE, 2017 - 2023 - 2029
- Figure 35:
- NETHERLANDS DATA CENTER MARKET, HYPERSCALE, VOLUME IN MW, 2017 - 2029
- Figure 36:
- NETHERLANDS DATA CENTER MARKET, RETAIL, VOLUME IN MW, 2017 - 2029
- Figure 37:
- NETHERLANDS DATA CENTER MARKET, WHOLESALE, VOLUME IN MW, 2017 - 2029
- Figure 38:
- NETHERLANDS DATA CENTER MARKET, BY END USER, VOLUME IN MW, 2017 - 2029
- Figure 39:
- NETHERLANDS DATA CENTER MARKET, SHARE(%), BY END USER, 2017 - 2023 - 2029
- Figure 40:
- NETHERLANDS DATA CENTER MARKET, BFSI, VOLUME IN MW, 2017 - 2029
- Figure 41:
- NETHERLANDS DATA CENTER MARKET, CLOUD, VOLUME IN MW, 2017 - 2029
- Figure 42:
- NETHERLANDS DATA CENTER MARKET, E-COMMERCE, VOLUME IN MW, 2017 - 2029
- Figure 43:
- NETHERLANDS DATA CENTER MARKET, GOVERNMENT, VOLUME IN MW, 2017 - 2029
- Figure 44:
- NETHERLANDS DATA CENTER MARKET, MANUFACTURING, VOLUME IN MW, 2017 - 2029
- Figure 45:
- NETHERLANDS DATA CENTER MARKET, MEDIA & ENTERTAINMENT, VOLUME IN MW, 2017 - 2029
- Figure 46:
- NETHERLANDS DATA CENTER MARKET, TELECOM, VOLUME IN MW, 2017 - 2029
- Figure 47:
- NETHERLANDS DATA CENTER MARKET, OTHER END USER, VOLUME IN MW, 2017 - 2029
- Figure 48:
- NETHERLANDS DATA CENTER MARKET, BY MAJOR PLAYER IT LOAD CAPACITY, 2022
Netherlands Data Center Industry Segmentation
Amsterdam are covered as segments by Hotspot. Large, Massive, Medium, Mega, Small are covered as segments by Data Center Size. Tier 1 and 2, Tier 3, Tier 4 are covered as segments by Tier Type. Non-Utilized, Utilized are covered as segments by Absorption.| Hotspot | |
| Amsterdam | |
| Rest of Netherlands |
| Data Center Size | |
| Large | |
| Massive | |
| Medium | |
| Mega | |
| Small |
| Tier Type | |
| Tier 1 and 2 | |
| Tier 3 | |
| Tier 4 |
| Absorption | |||||||||||||||||
| Non-Utilized | |||||||||||||||||
|
Market Definition
- IT LOAD CAPACITY - The IT load capacity or installed capacity, refers to the amount of energy consumed by servers and network equipments placed in a rack installed. It is measured in megawatt (MW).
- ABSORPTION RATE - It denotes the extend to which the data center capacity has been leased out. For instance, a 100 MW DC has leased out 75 MW, then absorption rate would be 75%. It is also referred as utilization rate and leased-out capacity.
- RAISED FLOOR SPACE - It is an elevated space build over the floor. This gap between the original floor and the elevated floor is used to accommodate wiring, cooling, and other data center equipment. This arrangement assist in having proper wiring and cooling infrastructure. It is measured in square feet (ft^2).
- DATA CENTER SIZE - Data Center Size is segmented based on the raised floor space allocated to the data center facilities. Mega DC - # of Racks must be more than 9000 or RFS (raised floor space) must be more than 225001 Sq. ft; Massive DC - # of Racks must be in between 9000 and 3001 or RFS must be in between 225000 Sq. ft and 75001 Sq. ft; Large DC - # of Racks must be in between 3000 and 801 or RFS must be in between 75000 Sq. ft and 20001 Sq. ft; Medium DC # of Racks must be in between 800 and 201 or RFS must be in between 20000 Sq. ft and 5001 Sq. ft; Small DC - # of Racks must be less than 200 or RFS must be less than 5000 Sq. ft.
- TIER TYPE - According to Uptime Institute the data centers are classified into four tiers based on the proficiencies of redundant equipment of the data center infrastructure. In this segment the data center are segmented as Tier 1,Tier 2, Tier 3 and Tier 4.
- COLOCATION TYPE - The segment is segregated into 3 categories namely Retail, Wholesale and Hyperscale Colocation service. The categorization is done based on the amount of IT load leased out to potential customers. Retail colocation service has leased capacity less than 250 kW; Wholesale colocation services has leased capacity between 251 kW and 4 MW and Hyperscale colocation services has leased capacity more than 4 MW.
- END CONSUMERS - The Data Center Market operates on a B2B basis. BFSI, Government, Cloud Operators, Media and Entertainment, E-Commerce, Telecom and Manufacturing are the major end-consumers in the market studied. The scope only includes colocation service operators catering to the increasing digitalization of the end-user industries.
Research Methodology
Mordor Intelligence follows a four-step methodology in all our reports.
- Step-1: Identify Key Variables: In order to build a robust forecasting methodology, the variables and factors identified in Step-1 are tested against available historical market numbers. Through an iterative process, the variables required for market forecast are set and the model is built on the basis of these variables.
- Step-2: Build a Market Model: Market-size estimations for the forecast years are in nominal terms. Inflation is not a part of the pricing, and the average selling price (ASP) is kept constant throughout the forecast period for each country.
- Step-3: Validate and Finalize: In this important step, all market numbers, variables and analyst calls are validated through an extensive network of primary research experts from the market studied. The respondents are selected across levels and functions to generate a holistic picture of the market studied.
- Step-4: Research Outputs: Syndicated Reports, Custom Consulting Assignments, Databases & Subscription Platforms


