North America General Aviation Market Size

| Icons | Lable | Value |
|---|---|---|
|
|
Study Period | 2016 - 2028 |
|
|
Market Size (2023) | USD 17.42 Billion |
|
|
Market Size (2028) | USD 19.68 Billion |
|
|
CAGR (2023 - 2028) | 2.47 % |
|
|
Largest Share by Sub Aircraft Type | Business Jets |
|
|
Largest Share by Country | United States |
Major Players |
||
|
|
||
|
*Disclaimer: Major Players sorted in no particular order |
North America General Aviation Market Analysis
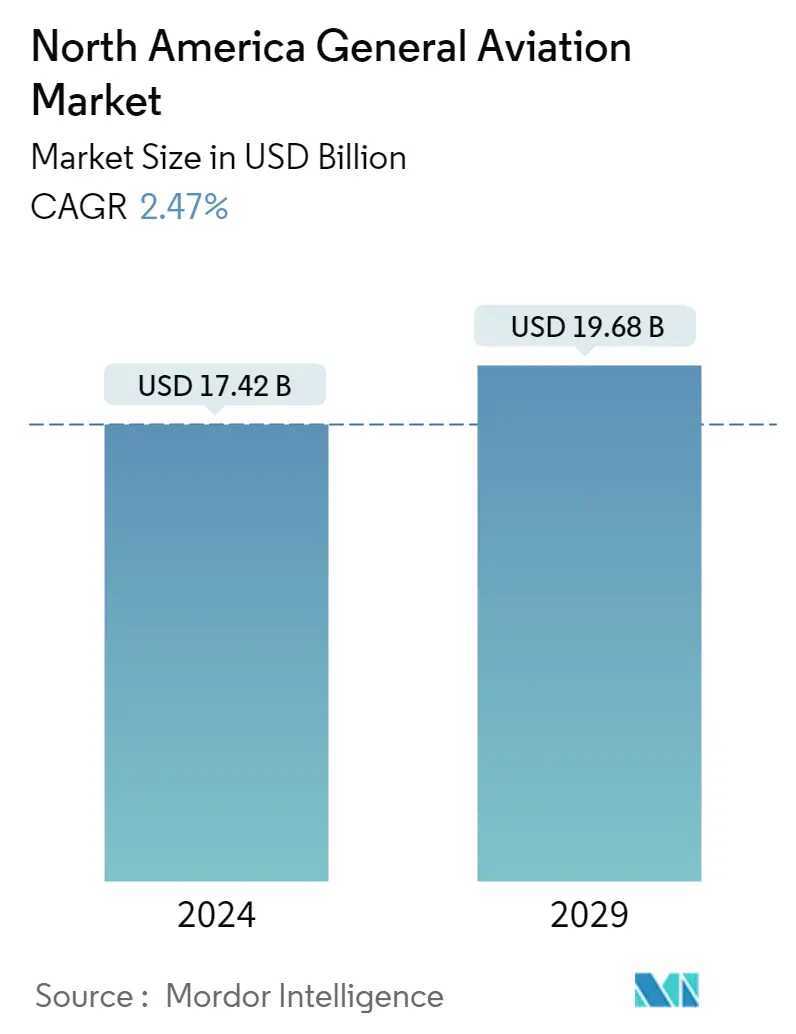
The North America General Aviation Market size is estimated at USD 17.42 billion in 2023, and is expected to reach USD 19.68 billion by 2028, growing at a CAGR of 2.47% during the forecast period (2023-2028).
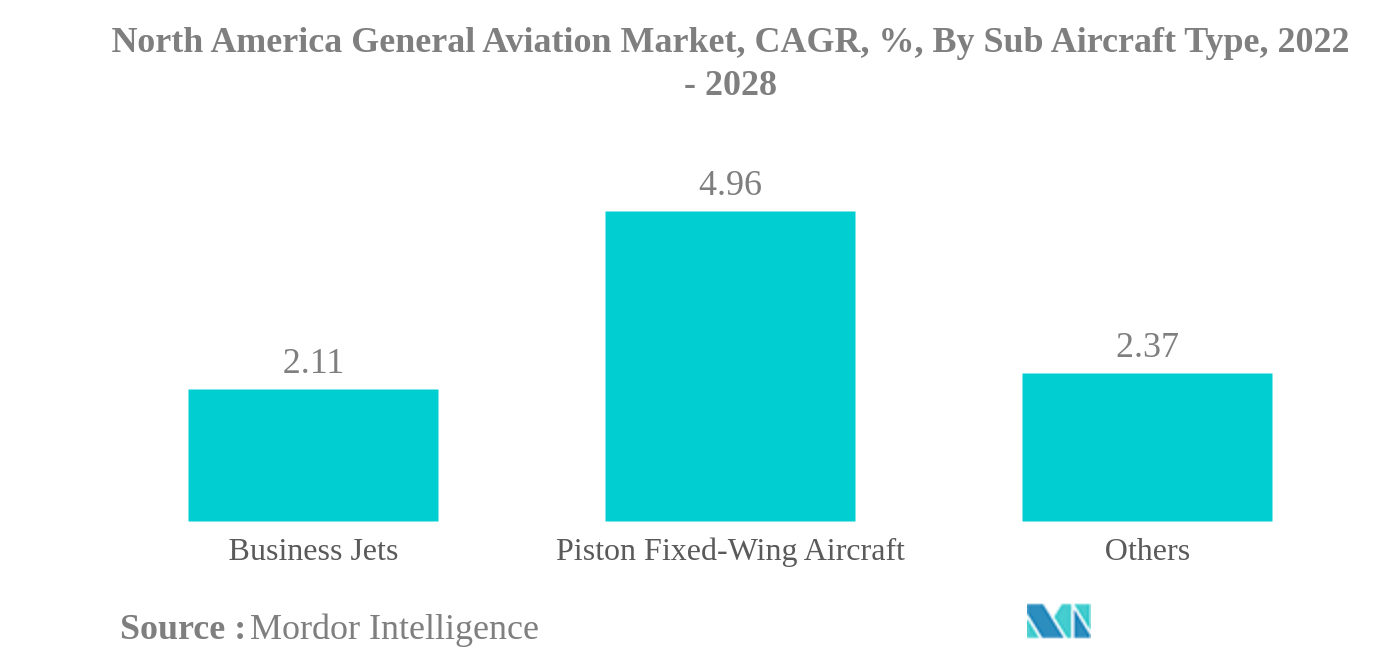
- Largest Market by Sub-Aircraft Type - Business Jets : An increasing number of HNWIs and UHNWIs in the region are mainly driving the market's growth.
- Fastest-growing Market by Sub-Aircraft Type - Piston Fixed-Wing Aircraft : The need to meet the increasing training requirements of various countries and the rising adoption of piston aircraft across different sectors are boosting the market's growth.
- Largest Market by Body Type - Large Jet : The increasing consumer preference for large jets is driving the demand. Therefore, manufacturers offer a wide range of large jets to consumers according to their preferences.
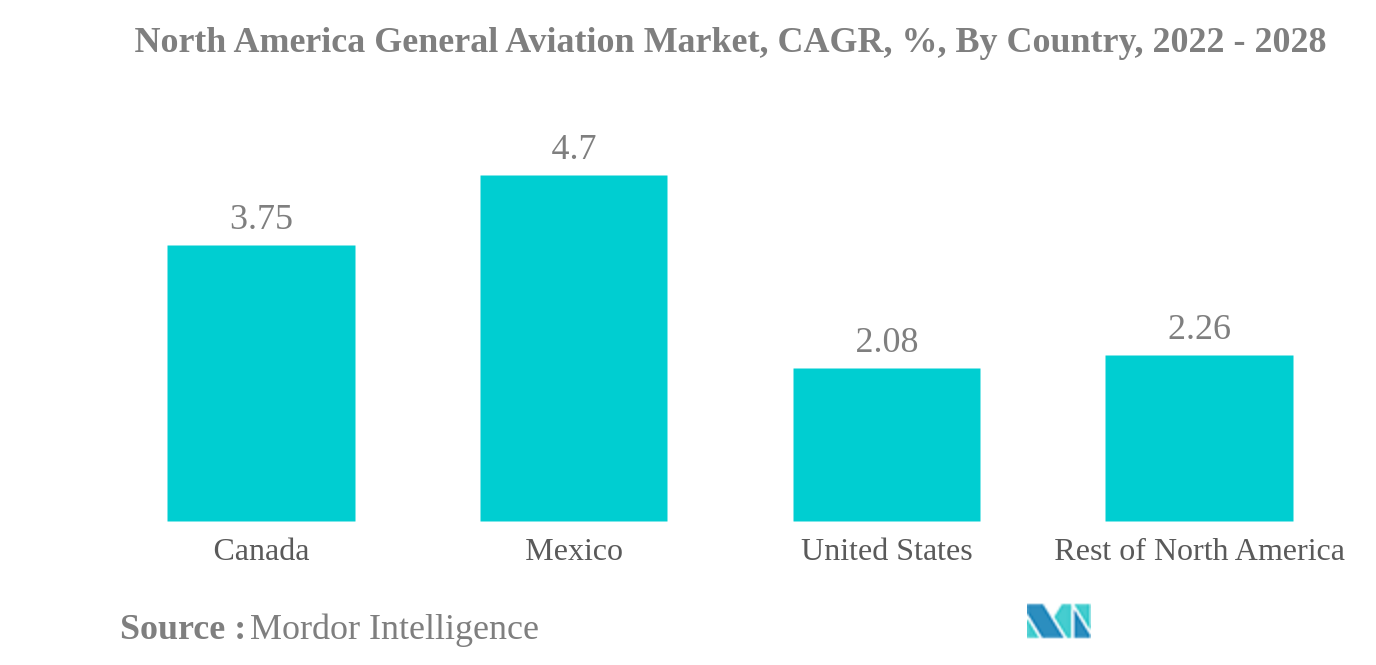
- Largest Market by Country - United States : A strong economy and the procurement and usage of aircraft by various sectors are leading to the growth of the general aviation market in the country.
North America General Aviation Market Trends
This section covers the major market trends shaping the North America General Aviation Market according to our research experts:
Business Jets is the largest Sub Aircraft Type
- The business jet category dominated the market in terms of value and accounted for USD 11418.8 million in the year 2021. The surge in the number of UHNWI individuals in the region along with the development of ultralong range aircraft is expected to aid the growth of the North American general aviation market.
- During the COVID-19 pandemic, the total number of general aviation aircraft deliveries declined by 11.4% in 2020. This was due to a COVID-induced reduction in aviation demand by global travel restrictions.
- In business jets, there is a growth of 10.7% in the number of deliveries in 2021 due to a surge in economic recovery in the business aviation sector, and 3,817 units of the global demand for jets is expected to be from the North America region during the forecast period.
- In 2021, 69% of the piston fixed wing and 71% of the business jets were delivered in the North America region of the total deliveries worldwide making it the most significant general aviation market globally. The advent of new models is likely to increase the competition among the existing players in the market and the availability of options for the customers, thereby driving the growth of the general aviation market in the region.
- Around 16,930 aircraft comprising business jets, helicopters, turboprop, and piston aircraft are expected to be delivered in the North American region during the forecast period.
United States is the largest Country
- The general aviation sector significantly contributes to the GDP of major countries in this region. For instance, it contributes around USD 150 billion annually to the US economy. In 2021, North America accounted for the highest growth in the ultra-wealthy population, with remarkably high purchasing power parity, representing an increase in the sales of general aviation aircraft in the region. For instance, the number of HNWI individuals in North America increased from 34 million in 2016 to 71 million in 2021, with a growth of 107% during 2016-2021.
- The overall aircraft deliveries in the general aviation sector were affected during the COVID-19 pandemic, and the growth in 2020 declined by 11%. The reduction in North America's economic activities and travel-related restrictions affected the demand for general aviation aircraft in the region.
- The United States accounts for around 89% of the total business jet fleet in the North American region, which makes it the most dominating market in terms of volume and value. Mexico and Canada accounted for 6% and 3% of the current operational fleet in the region, respectively, as of July 2022.
- Pilot training institutes are the major users of piston fixed-wing aircraft. The positive economic recovery led to a surge in demand for piston aircraft in the region, and deliveries increased by around 6.7% in 2021. During 2022-2028, out of the 16,000 estimated deliveries in the country's general aviation sector, 3,800+ business jets, 4,800+ other categories, and 8,200+ piston aircraft are expected to be delivered.
North America General Aviation Industry Overview
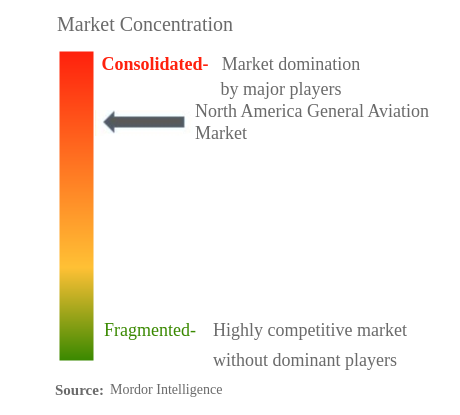
The North America General Aviation Market is fairly consolidated, with the top five companies occupying 75.42%. The major players in this market are Bombardier Inc., Dassault Aviation, Embraer, General Dynamics Corporation and Textron Inc. (sorted alphabetically).
North America General Aviation Market Leaders
Bombardier Inc.
Dassault Aviation
Embraer
General Dynamics Corporation
Textron Inc.
*Disclaimer: Major Players sorted in no particular order
North America General Aviation Market News
- July 2022: In July 2022, the Cessna Citation Longitude Marine Patrol Aircraft was introduced by Textron Aviation Special Missions.
- May 2022: Aircraft Global 8000 is unveiled by Bombardier
- April 2022: Exclusive Jets LLC and TEXTRON AVIATION have signed a sales contract for up to 30 Cessna Citation CJ3+ aircraft.
North America General Aviation Market Report - Table of Contents
1. INTRODUCTION
1.1. Study Assumptions & Market Definition
1.2. Scope of the Study
1.3. Research Methodology
2. KEY INDUSTRY TRENDS
2.1. High-Net-Worth Individual (HNWI)
2.2. Regulatory Framework
2.3. Value Chain Analysis
3. MARKET SEGMENTATION
3.1. Sub Aircraft Type
3.1.1. Business Jets
3.1.1.1. Large Jet
3.1.1.2. Light Jet
3.1.1.3. Mid-Size Jet
3.1.2. Piston Fixed-Wing Aircraft
3.1.3. Others
3.2. Country
3.2.1. Canada
3.2.2. Mexico
3.2.3. United States
3.2.4. Rest Of North America
4. COMPETITIVE LANDSCAPE
4.1. Key Strategic Moves
4.2. Market Share Analysis
4.3. Company Landscape
4.4. Company Profiles
4.4.1. Bombardier Inc.
4.4.2. Cirrus Design Corporation
4.4.3. Dassault Aviation
4.4.4. Embraer
4.4.5. General Dynamics Corporation
4.4.6. Honda Motor Co., Ltd.
4.4.7. Pilatus Aircraft Ltd
4.4.8. Textron Inc.
5. KEY STRATEGIC QUESTIONS FOR AVIATION CEOS
6. APPENDIX
6.1. Global Overview
6.1.1. Overview
6.1.2. Porter’s Five Forces Framework
6.1.3. Global Value Chain Analysis
6.1.4. Market Dynamics (DROs)
6.2. Sources & References
6.3. List of Tables & Figures
6.4. Primary Insights
6.5. Data Pack
6.6. Glossary of Terms
List of Tables & Figures
- Figure 1:
- NORTH AMERICA GENERAL AVIATION MARKET, HIGH-NET-WORTH INDIVIDUAL (HNWI), POPULATION, 2016 – 2028
- Figure 2:
- NORTH AMERICA GENERAL AVIATION MARKET, VOLUME, UNITS, 2016 - 2028
- Figure 3:
- NORTH AMERICA GENERAL AVIATION MARKET, VALUE, USD, 2016 - 2028
- Figure 4:
- NORTH AMERICA GENERAL AVIATION MARKET, BY SUB AIRCRAFT TYPE, VOLUME, UNITS, 2016 - 2028
- Figure 5:
- NORTH AMERICA GENERAL AVIATION MARKET, BY SUB AIRCRAFT TYPE, VALUE, USD, 2016 - 2028
- Figure 6:
- NORTH AMERICA GENERAL AVIATION MARKET, BY SUB AIRCRAFT TYPE, VOLUME, %, 2016 VS 2022 VS 2028
- Figure 7:
- NORTH AMERICA GENERAL AVIATION MARKET, BY SUB AIRCRAFT TYPE, VALUE, %, 2016 VS 2022 VS 2028
- Figure 8:
- NORTH AMERICA GENERAL AVIATION MARKET, BY BODY TYPE, VOLUME, UNITS, 2016 - 2028
- Figure 9:
- NORTH AMERICA GENERAL AVIATION MARKET, BY BODY TYPE, VALUE, USD, 2016 - 2028
- Figure 10:
- NORTH AMERICA GENERAL AVIATION MARKET, BY BODY TYPE, VOLUME, %, 2016 VS 2022 VS 2028
- Figure 11:
- NORTH AMERICA GENERAL AVIATION MARKET, BY BODY TYPE, VALUE, %, 2016 VS 2022 VS 2028
- Figure 12:
- NORTH AMERICA GENERAL AVIATION MARKET, BY LARGE JET, VOLUME, UNITS, 2016 - 2028
- Figure 13:
- NORTH AMERICA GENERAL AVIATION MARKET, BY LARGE JET, VALUE, USD, 2016 - 2028
- Figure 14:
- NORTH AMERICA GENERAL AVIATION MARKET, BY LARGE JET, VALUE, %, 2021 VS 2028
- Figure 15:
- NORTH AMERICA GENERAL AVIATION MARKET, BY LIGHT JET, VOLUME, UNITS, 2016 - 2028
- Figure 16:
- NORTH AMERICA GENERAL AVIATION MARKET, BY LIGHT JET, VALUE, USD, 2016 - 2028
- Figure 17:
- NORTH AMERICA GENERAL AVIATION MARKET, BY LIGHT JET, VALUE, %, 2021 VS 2028
- Figure 18:
- NORTH AMERICA GENERAL AVIATION MARKET, BY MID-SIZE JET, VOLUME, UNITS, 2016 - 2028
- Figure 19:
- NORTH AMERICA GENERAL AVIATION MARKET, BY MID-SIZE JET, VALUE, USD, 2016 - 2028
- Figure 20:
- NORTH AMERICA GENERAL AVIATION MARKET, BY MID-SIZE JET, VALUE, %, 2021 VS 2028
- Figure 21:
- NORTH AMERICA GENERAL AVIATION MARKET, BY PISTON FIXED-WING AIRCRAFT, VOLUME, UNITS, 2016 - 2028
- Figure 22:
- NORTH AMERICA GENERAL AVIATION MARKET, BY PISTON FIXED-WING AIRCRAFT, VALUE, USD, 2016 - 2028
- Figure 23:
- NORTH AMERICA GENERAL AVIATION MARKET, BY PISTON FIXED-WING AIRCRAFT, VALUE, %, 2021 VS 2028
- Figure 24:
- NORTH AMERICA GENERAL AVIATION MARKET, BY OTHERS, VOLUME, UNITS, 2016 - 2028
- Figure 25:
- NORTH AMERICA GENERAL AVIATION MARKET, BY OTHERS, VALUE, USD, 2016 - 2028
- Figure 26:
- NORTH AMERICA GENERAL AVIATION MARKET, BY OTHERS, VALUE, %, 2021 VS 2028
- Figure 27:
- NORTH AMERICA GENERAL AVIATION MARKET, BY COUNTRY, VOLUME, UNITS, 2016 - 2028
- Figure 28:
- NORTH AMERICA GENERAL AVIATION MARKET, BY COUNTRY, VALUE, USD, 2016 - 2028
- Figure 29:
- NORTH AMERICA GENERAL AVIATION MARKET, BY COUNTRY, VOLUME, %, 2016 VS 2022 VS 2028
- Figure 30:
- NORTH AMERICA GENERAL AVIATION MARKET, BY COUNTRY, VALUE, %, 2016 VS 2022 VS 2028
- Figure 31:
- NORTH AMERICA GENERAL AVIATION MARKET, BY CANADA, VOLUME, UNITS, 2016 - 2028
- Figure 32:
- NORTH AMERICA GENERAL AVIATION MARKET, BY CANADA, VALUE, USD, 2016 - 2028
- Figure 33:
- NORTH AMERICA GENERAL AVIATION MARKET, BY CANADA, VALUE, %, 2021 VS 2028
- Figure 34:
- NORTH AMERICA GENERAL AVIATION MARKET, BY MEXICO, VOLUME, UNITS, 2016 - 2028
- Figure 35:
- NORTH AMERICA GENERAL AVIATION MARKET, BY MEXICO, VALUE, USD, 2016 - 2028
- Figure 36:
- NORTH AMERICA GENERAL AVIATION MARKET, BY MEXICO, VALUE, %, 2021 VS 2028
- Figure 37:
- NORTH AMERICA GENERAL AVIATION MARKET, BY UNITED STATES, VOLUME, UNITS, 2016 - 2028
- Figure 38:
- NORTH AMERICA GENERAL AVIATION MARKET, BY UNITED STATES, VALUE, USD, 2016 - 2028
- Figure 39:
- NORTH AMERICA GENERAL AVIATION MARKET, BY UNITED STATES, VALUE, %, 2021 VS 2028
- Figure 40:
- NORTH AMERICA GENERAL AVIATION MARKET, BY REST OF NORTH AMERICA, VOLUME, UNITS, 2016 - 2028
- Figure 41:
- NORTH AMERICA GENERAL AVIATION MARKET, BY REST OF NORTH AMERICA, VALUE, USD, 2016 - 2028
- Figure 42:
- NORTH AMERICA GENERAL AVIATION MARKET, BY REST OF NORTH AMERICA, VALUE, %, 2021 VS 2028
- Figure 43:
- NORTH AMERICA GENERAL AVIATION MARKET, MOST ACTIVE COMPANIES, BY NUMBER OF STRATEGIC MOVES, 2018 - 2021
- Figure 44:
- NORTH AMERICA GENERAL AVIATION MARKET, MOST ADOPTED STRATEGIES, 2018 - 2021
- Figure 45:
- NORTH AMERICA GENERAL AVIATION MARKET SHARE(%), BY MAJOR PLAYERS, 2021
North America General Aviation Industry Segmentation
Business Jets, Piston Fixed-Wing Aircraft, Others are covered as segments by Sub Aircraft Type. Canada, Mexico, United States are covered as segments by Country.| Sub Aircraft Type | |||||
| |||||
| Piston Fixed-Wing Aircraft | |||||
| Others |
| Country | |
| Canada | |
| Mexico | |
| United States | |
| Rest Of North America |
Market Definition
- Aircraft Type - General Aviation includes aircraft used for corporate aviation, business aviation and other aerial works.
- Body Type - Light Jets, Mid-Size Jets, and Large Jets according to their ability to carry passengers and flying distance ranges have been included under this study.
- Sub-Aircraft Type - Business Jets, Piston Fixed-Wing Aircraft, and helicopters and turboprop aircraft are taken into consideration.
Research Methodology
Mordor Intelligence follows a four-step methodology in all our reports.
- Step-1: Identify Key Variables: In order to build a robust forecasting methodology, the variables and factors identified in Step-1 are tested against available historical market numbers. Through an iterative process, the variables required for market forecast are set and the model is built on the basis of these variables.
- Step-2: Build a Market Model: Market-size estimations for the historical and forecast years have been provided in revenue and volume terms. For sales conversion to volume, the average selling price (ASP) is kept constant throughout the forecast period for each country, and inflation is not a part of the pricing.
- Step-3: Validate and Finalize: In this important step, all market numbers, variables and analyst calls are validated through an extensive network of primary research experts from the market studied. The respondents are selected across levels and functions to generate a holistic picture of the market studied.
- Step-4: Research Outputs: Syndicated Reports, Custom Consulting Assignments, Databases & Subscription Platforms


