North America Grain Seed Market Size

| Icons | Lable | Value |
|---|---|---|
|
|
Study Period | 2016 - 2028 |
|
|
Base Year For Estimation | 2021 |
|
|
CAGR | 3.58 % |
|
|
Largest Share by Breeding Technology | Hybrids |
|
|
Largest Share by Country | United States |
|
|
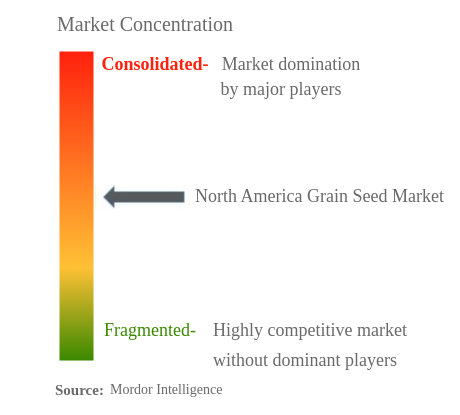
Market Concentration | High |
Major Players |
||
|
|
||
|
*Disclaimer: Major Players sorted in no particular order |
North America Grain Seed Market Analysis
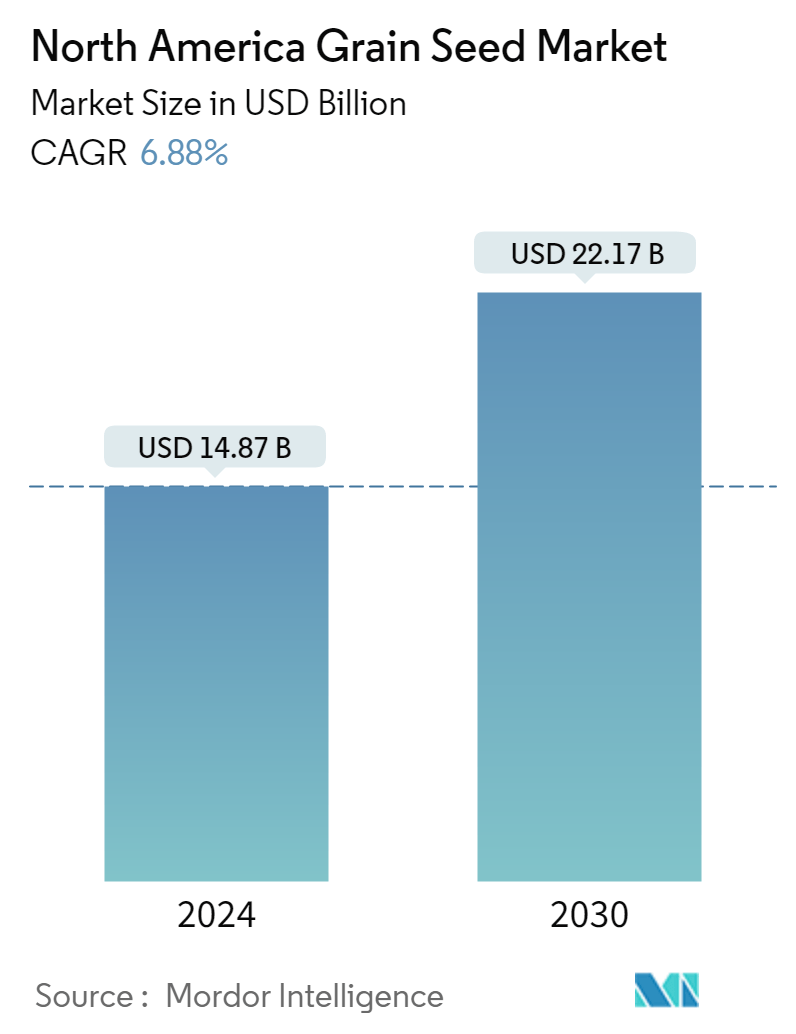
The North America Grain Seed Market is projected to register a CAGR of 3.58%
- Corn is the Largest Crop: The increase in the demand for corn is due to the high-value crop, high Return on Investment, and increase in the demand by the lubricants industry for biofuel production.
- United States is the Largest Country: The country is the second-largest producer of grains globally with corn and wheat being the major contributors. The country is the leading producer of biofuel globally.
- Sorghum is the Fastest-growing Crop: The market expansion for sorghum seeds is driven by the crop's ability to adapt to changing weather conditions, and an increase in the demand for animal feed by dairy farmers.
- Canada is the Fastest-growing Country: It is an emerging market for grain seeds due to an increase in the demand for corn flour and growing tortilla prices have led to an increase in the demand for grain seeds.
North America Grain Seed Market Trends
This section covers the major market trends shaping the North America Grain Seed Market according to our research experts:
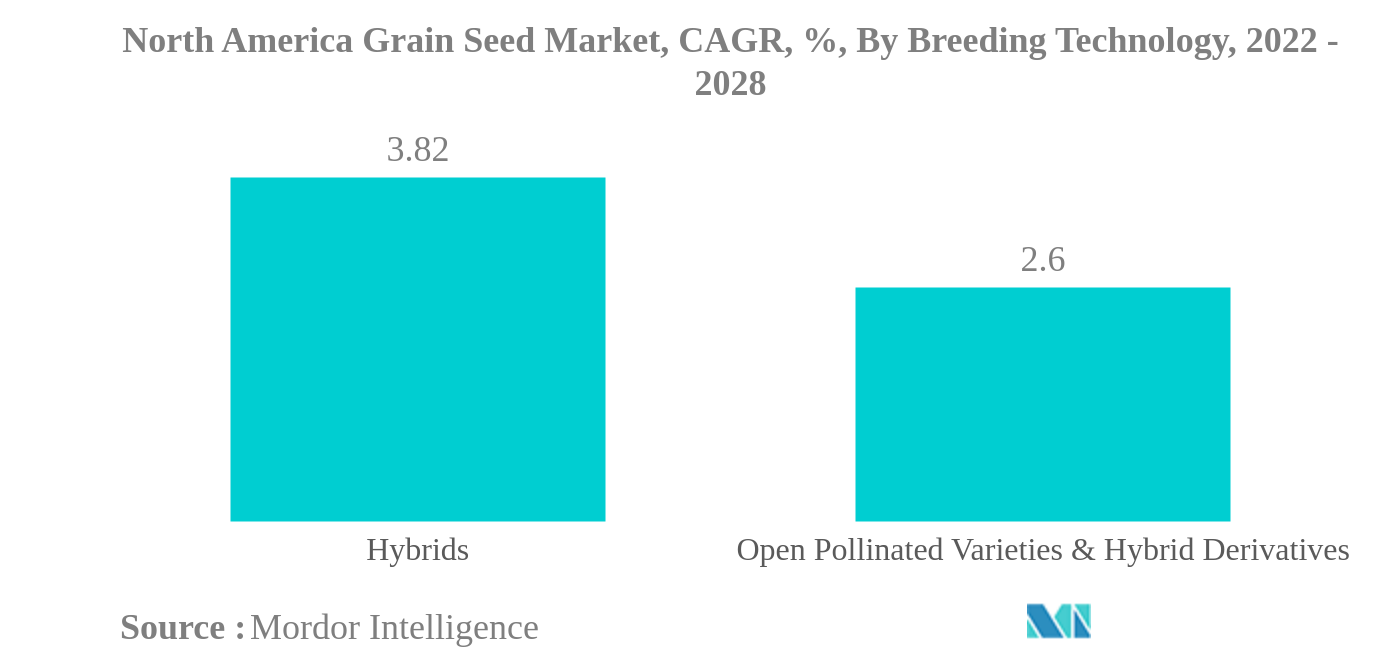
Hybrids is the largest Breeding Technology
- In North America, the hybrid seed segment dominated the markets in both volume and value. In 2022, Hybrid grain seeds accounted for 80.1% in terms of the value of row crops due to an increased demand for grains. Among hybrids, the major crop produced is corn, which accounted for about 94.4% of the grains in 2021.
- The growing demand for hybrid and open-pollinated seeds from organic growers, animal feed, food, and the biofuels industry is driving the market's growth. Due to the increasing crop yield, the demand for hybrid seeds witnessed major growth in countries such as Canada and Mexico.
- New plant breeding techniques are allowing the development of new plant varieties with desired traits by modifying the DNA of the seeds and plant cells. Innovations in plant breeding are helping address the challenges farmers face in the field every day.
- In the region, open-pollinated varieties are often used in grains and cereals crops such as wheat, millet, and other cereals due to high volume seed requirements.
- In the grains and cereals segment, wheat is the most cultivated crop, with the use of open-pollinated varieties accounting for 20.1% of total open-pollinated varieties and hybrid derivatives value share for grains and cereals in 2021.
- The adoption of improved open-pollinated varieties has many benefits, such as high yield, and is well-adapted to the local environment, allowing crops to grow stronger.
- There is an increasing demand for hybrid seeds due to the high yield and less production area required for the same output by open-pollinated varieties, which is expected to drive the growth of hybrid seeds in the market.
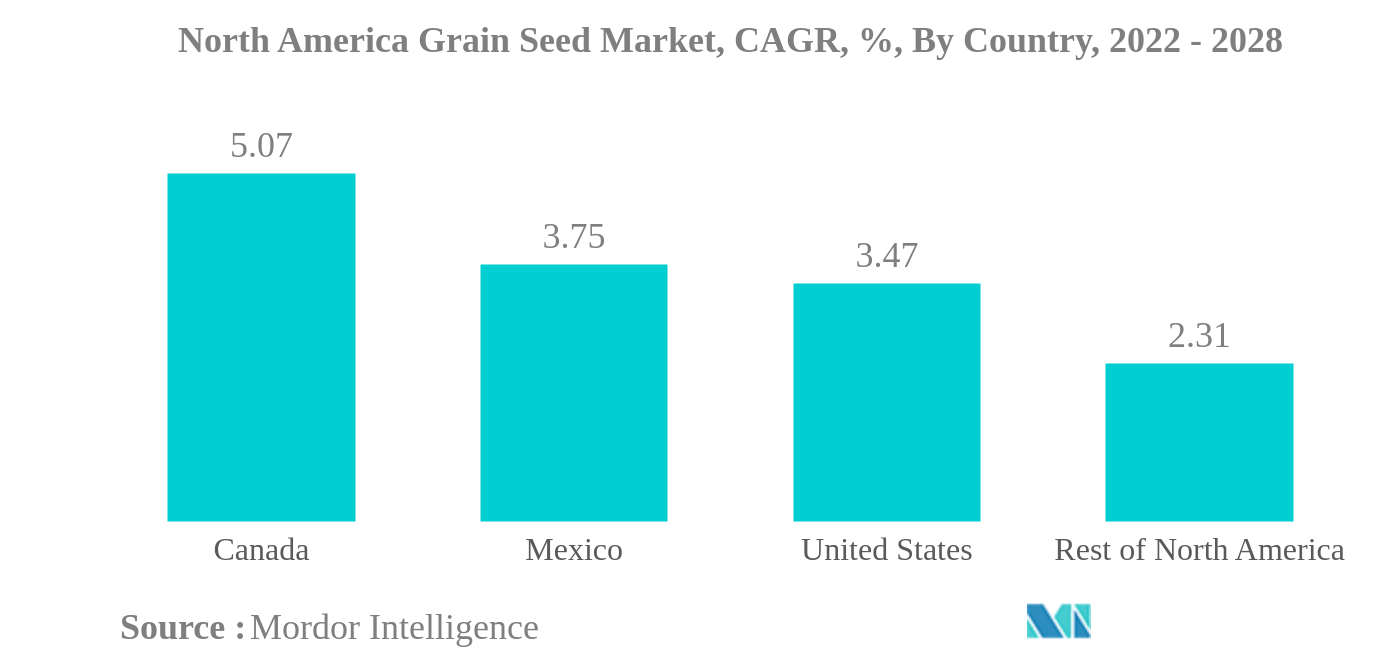
United States is the largest Country
- According to estimates, the total acreage under grains and cereals in North America in 2021 was 82.4 million hectares, which increased by 2.0% compared to the previous year due to an increase in the processing facilities and governments pushing the adoption of self-sufficiency as grains and cereals are the staple food in the diet.
- The total grains and cereals accounted for 59.6% of the total North American seed market in 2021 in terms of seed production value.
- The United States is the second-largest producer of grains and cereals in the world, with corn and wheat being the major contributors. The corn seed market in the United States contributes around 39.8% of the total United States seed market.
- Canada is the fifth-largest producer of wheat, producing more than the required for consumption. The increased consumption of fresh or processed grains and cereals and increased animal production and industrial utilization are increasing the acreage of grains and cereals in the country.
- Mexico is the leading producer of corn, with the increased usage of GM corn until 2020. In 2020, GM corn was banned, and the Mexican government wants to remove GMOs from the country by 2024. The acreage under corn has been reduced. The grains and cereals demand has been increasing as the majority of seeds used currently are imported from other countries.
- The total grains and cereals seed market of the Rest of North America accounted for 5.6% of the total North American grains and cereals seed market value in 2021.
- The increase in government support for lost resources during climate abnormalities, increased awareness to reduce imports, and continuous demand for staple foods, such as grains and cereals, are expected to boost the seed market in the region.
North America Grain Seed Industry Overview
The North America Grain Seed Market is moderately consolidated, with the top five companies occupying 61.25%. The major players in this market are BASF SE, Bayer AG, Corteva Agriscience, Land O’Lakes, Inc. and Syngenta Group (sorted alphabetically).
North America Grain Seed Market Leaders
BASF SE
Bayer AG
Corteva Agriscience
Land O’Lakes, Inc.
Syngenta Group
*Disclaimer: Major Players sorted in no particular order
North America Grain Seed Market News
- March 2022: Corteva Agriscience has launched its next generation of corn rootworm (CRW) trait technology, Vorceed Enlist corn. It will enable farmers to manage CRW acres with more options than any other seed corn product.
- March 2022: Corteva introduced Inzent trait sorghum variety under brand pioneer. The variety will provide control of yield-depleting annual grasses such as foxtail, barnyardgrass and panicum.
- February 2022: First CoAXium Soft White Winter Wheat Varieties have been launched by Limagrain Cereal Seeds.
North America Grain Seed Market Report - Table of Contents
EXECUTIVE SUMMARY & KEY FINDINGS
REPORT OFFERS
1. INTRODUCTION
1.1. Study Assumptions & Market Definition
1.2. Scope of the Study
1.3. Research Methodology
2. KEY INDUSTRY TRENDS
2.1. Area Under Cultivation
2.2. Most Popular Traits
2.3. Regulatory Framework
2.4. Value Chain & Distribution Channel Analysis
3. MARKET SEGMENTATION
3.1. Breeding Technology
3.1.1. Hybrids
3.1.1.1. Non-Transgenic Hybrids
3.1.1.2. Transgenic Hybrids
3.1.1.2.1. Herbicide Tolerant
3.1.1.2.2. Insect Resistant
3.1.1.2.3. Other Traits
3.1.2. Open Pollinated Varieties & Hybrid Derivatives
3.2. Crop
3.2.1. Corn
3.2.2. Rice
3.2.3. Sorghum
3.2.4. Wheat
3.2.5. Other Grains & Cereals
3.3. Country
3.3.1. Canada
3.3.2. Mexico
3.3.3. United States
3.3.4. Rest of North America
4. COMPETITIVE LANDSCAPE
4.1. Key Strategic Moves
4.2. Market Share Analysis
4.3. Company Landscape
4.4. Company Profiles
4.4.1. Advanta Seeds - UPL
4.4.2. BASF SE
4.4.3. Bayer AG
4.4.4. Corteva Agriscience
4.4.5. DLF
4.4.6. Groupe Limagrain
4.4.7. KWS SAAT SE & Co. KGaA
4.4.8. Land O’Lakes, Inc.
4.4.9. S & W Seed Co.
4.4.10. Syngenta Group
5. KEY STRATEGIC QUESTIONS FOR SEEDS CEOS
6. APPENDIX
6.1. Global Overview
6.1.1. Overview
6.1.2. Porter’s Five Forces Framework
6.1.3. Global Value Chain Analysis
6.1.4. Global Market Size and DROs
6.2. Sources & References
6.3. List of Tables & Figures
6.4. Primary Insights
6.5. Data Pack
6.6. Glossary of Terms
List of Tables & Figures
- Figure 1:
- NORTH AMERICA GRAIN SEED MARKET AREA UNDER CULTIVATION, HECTARE, 2016 - 2021
- Figure 2:
- NORTH AMERICA GRAIN SEED MARKET, MAJOR TRAITS VALUE SHARE(%), RICE, 2021
- Figure 3:
- NORTH AMERICA GRAIN SEED MARKET, MAJOR TRAITS VALUE SHARE(%), CORN, 2021
- Figure 4:
- NORTH AMERICA GRAIN SEED MARKET, VOLUME, METRIC TON, 2016 - 2028
- Figure 5:
- NORTH AMERICA GRAIN SEED MARKET, VALUE, USD, 2016 - 2028
- Figure 6:
- NORTH AMERICA GRAIN SEED MARKET, BY BREEDING TECHNOLOGY, VOLUME, METRIC TON, 2016 - 2028
- Figure 7:
- NORTH AMERICA GRAIN SEED MARKET, BY BREEDING TECHNOLOGY, VALUE, USD, 2016 - 2028
- Figure 8:
- NORTH AMERICA GRAIN SEED MARKET, SHARE(%), BY BREEDING TECHNOLOGY, VOLUME, METRIC TON, 2016 VS 2022 VS 2028
- Figure 9:
- NORTH AMERICA GRAIN SEED MARKET, SHARE(%), BY BREEDING TECHNOLOGY, VALUE, USD, 2016 VS 2022 VS 2028
- Figure 10:
- NORTH AMERICA GRAIN SEED MARKET, BY HYBRIDS, VOLUME, METRIC TON, 2016 - 2028
- Figure 11:
- NORTH AMERICA GRAIN SEED MARKET, BY HYBRIDS, VALUE, USD, 2016 - 2028
- Figure 12:
- NORTH AMERICA GRAIN SEED MARKET, SHARE(%), BY HYBRIDS, VOLUME, METRIC TON, 2016 VS 2022 VS 2028
- Figure 13:
- NORTH AMERICA GRAIN SEED MARKET, SHARE(%), BY HYBRIDS, VALUE, USD, 2016 VS 2022 VS 2028
- Figure 14:
- NORTH AMERICA GRAIN SEED MARKET, BY HYBRIDS, VOLUME, METRIC TON, 2016 - 2028
- Figure 15:
- NORTH AMERICA GRAIN SEED MARKET, BY HYBRIDS, VALUE, USD, 2016 - 2028
- Figure 16:
- NORTH AMERICA GRAIN SEED MARKET, SHARE(%), BY CROP, 2021 - 2028
- Figure 17:
- NORTH AMERICA GRAIN SEED MARKET, BY TRANSGENIC HYBRIDS, VOLUME, METRIC TON, 2016 - 2028
- Figure 18:
- NORTH AMERICA GRAIN SEED MARKET, BY TRANSGENIC HYBRIDS, VALUE, USD, 2016 - 2028
- Figure 19:
- NORTH AMERICA GRAIN SEED MARKET, SHARE(%), BY TRANSGENIC HYBRIDS, VOLUME, METRIC TON, 2016 VS 2022 VS 2028
- Figure 20:
- NORTH AMERICA GRAIN SEED MARKET, SHARE(%), BY TRANSGENIC HYBRIDS, VALUE, USD, 2016 VS 2022 VS 2028
- Figure 21:
- NORTH AMERICA GRAIN SEED MARKET, BY TRANSGENIC HYBRIDS, VOLUME, METRIC TON, 2016 - 2028
- Figure 22:
- NORTH AMERICA GRAIN SEED MARKET, BY TRANSGENIC HYBRIDS, VALUE, USD, 2016 - 2028
- Figure 23:
- NORTH AMERICA GRAIN SEED MARKET, SHARE(%), BY CROP, 2021 - 2028
- Figure 24:
- NORTH AMERICA GRAIN SEED MARKET, BY TRANSGENIC HYBRIDS, VOLUME, METRIC TON, 2016 - 2028
- Figure 25:
- NORTH AMERICA GRAIN SEED MARKET, BY TRANSGENIC HYBRIDS, VALUE, USD, 2016 - 2028
- Figure 26:
- NORTH AMERICA GRAIN SEED MARKET, SHARE(%), BY CROP, 2021 - 2028
- Figure 27:
- NORTH AMERICA GRAIN SEED MARKET, BY TRANSGENIC HYBRIDS, VOLUME, METRIC TON, 2016 - 2028
- Figure 28:
- NORTH AMERICA GRAIN SEED MARKET, BY TRANSGENIC HYBRIDS, VALUE, USD, 2016 - 2028
- Figure 29:
- NORTH AMERICA GRAIN SEED MARKET, SHARE(%), BY CROP, 2021 - 2028
- Figure 30:
- NORTH AMERICA GRAIN SEED MARKET, BY BREEDING TECHNOLOGY, VOLUME, METRIC TON, 2016 - 2028
- Figure 31:
- NORTH AMERICA GRAIN SEED MARKET, BY BREEDING TECHNOLOGY, VALUE, USD, 2016 - 2028
- Figure 32:
- NORTH AMERICA GRAIN SEED MARKET, SHARE(%), BY CROP, 2021 - 2028
- Figure 33:
- NORTH AMERICA GRAIN SEED MARKET, BY CROP, VOLUME, METRIC TON, 2016 - 2028
- Figure 34:
- NORTH AMERICA GRAIN SEED MARKET, BY CROP, VALUE, USD, 2016 - 2028
- Figure 35:
- NORTH AMERICA GRAIN SEED MARKET, SHARE(%), BY CROP, VOLUME, METRIC TON, 2016 VS 2022 VS 2028
- Figure 36:
- NORTH AMERICA GRAIN SEED MARKET, SHARE(%), BY CROP, VALUE, USD, 2016 VS 2022 VS 2028
- Figure 37:
- NORTH AMERICA GRAIN SEED MARKET, BY CROP, VOLUME, METRIC TON, 2016 - 2028
- Figure 38:
- NORTH AMERICA GRAIN SEED MARKET, BY CROP, VALUE, USD, 2016 - 2028
- Figure 39:
- NORTH AMERICA GRAIN SEED MARKET, SHARE(%), BY BREEDING TECHNOLOGY, 2021 - 2028
- Figure 40:
- NORTH AMERICA GRAIN SEED MARKET, BY CROP, VOLUME, METRIC TON, 2016 - 2028
- Figure 41:
- NORTH AMERICA GRAIN SEED MARKET, BY CROP, VALUE, USD, 2016 - 2028
- Figure 42:
- NORTH AMERICA GRAIN SEED MARKET, SHARE(%), BY BREEDING TECHNOLOGY, 2021 - 2028
- Figure 43:
- NORTH AMERICA GRAIN SEED MARKET, BY CROP, VOLUME, METRIC TON, 2016 - 2028
- Figure 44:
- NORTH AMERICA GRAIN SEED MARKET, BY CROP, VALUE, USD, 2016 - 2028
- Figure 45:
- NORTH AMERICA GRAIN SEED MARKET, SHARE(%), BY BREEDING TECHNOLOGY, 2021 - 2028
- Figure 46:
- NORTH AMERICA GRAIN SEED MARKET, BY CROP, VOLUME, METRIC TON, 2016 - 2028
- Figure 47:
- NORTH AMERICA GRAIN SEED MARKET, BY CROP, VALUE, USD, 2016 - 2028
- Figure 48:
- NORTH AMERICA GRAIN SEED MARKET, SHARE(%), BY BREEDING TECHNOLOGY, 2021 - 2028
- Figure 49:
- NORTH AMERICA GRAIN SEED MARKET, BY CROP, VOLUME, METRIC TON, 2016 - 2028
- Figure 50:
- NORTH AMERICA GRAIN SEED MARKET, BY CROP, VALUE, USD, 2016 - 2028
- Figure 51:
- NORTH AMERICA GRAIN SEED MARKET, SHARE(%), BY BREEDING TECHNOLOGY, 2021 - 2028
- Figure 52:
- NORTH AMERICA GRAIN SEED MARKET, BY COUNTRY, VOLUME, METRIC TON, 2016 - 2028
- Figure 53:
- NORTH AMERICA GRAIN SEED MARKET, BY COUNTRY, VALUE, USD, 2016 - 2028
- Figure 54:
- NORTH AMERICA GRAIN SEED MARKET, SHARE(%), BY COUNTRY, VOLUME, METRIC TON, 2016 VS 2022 VS 2028
- Figure 55:
- NORTH AMERICA GRAIN SEED MARKET, SHARE(%), BY COUNTRY, VALUE, USD, 2016 VS 2022 VS 2028
- Figure 56:
- NORTH AMERICA GRAIN SEED MARKET, BY COUNTRY, VOLUME, METRIC TON, 2016 - 2028
- Figure 57:
- NORTH AMERICA GRAIN SEED MARKET, BY COUNTRY, VALUE, USD, 2016 - 2028
- Figure 58:
- NORTH AMERICA GRAIN SEED MARKET, SHARE(%), BY CROP, 2021 - 2028
- Figure 59:
- NORTH AMERICA GRAIN SEED MARKET, BY COUNTRY, VOLUME, METRIC TON, 2016 - 2028
- Figure 60:
- NORTH AMERICA GRAIN SEED MARKET, BY COUNTRY, VALUE, USD, 2016 - 2028
- Figure 61:
- NORTH AMERICA GRAIN SEED MARKET, SHARE(%), BY CROP, 2021 - 2028
- Figure 62:
- NORTH AMERICA GRAIN SEED MARKET, BY COUNTRY, VOLUME, METRIC TON, 2016 - 2028
- Figure 63:
- NORTH AMERICA GRAIN SEED MARKET, BY COUNTRY, VALUE, USD, 2016 - 2028
- Figure 64:
- NORTH AMERICA GRAIN SEED MARKET, SHARE(%), BY CROP, 2021 - 2028
- Figure 65:
- NORTH AMERICA GRAIN SEED MARKET, BY COUNTRY, VOLUME, METRIC TON, 2016 - 2028
- Figure 66:
- NORTH AMERICA GRAIN SEED MARKET, BY COUNTRY, VALUE, USD, 2016 - 2028
- Figure 67:
- NORTH AMERICA GRAIN SEED MARKET, SHARE(%), BY CROP, 2021 - 2028
- Figure 68:
- NORTH AMERICA GRAIN SEED MARKET, MOST ACTIVE COMPANIES, BY NUMBER OF STRATEGIC MOVES, 2016 - 2021
- Figure 69:
- NORTH AMERICA GRAIN SEED MARKET, MOST ADOPTED STRATEGIES, 2018 - 2021
- Figure 70:
- NORTH AMERICA GRAIN SEED MARKET SHARE(%), BY MAJOR PLAYERS, 2021
North America Grain Seed Industry Segmentation
Hybrids, Open Pollinated Varieties & Hybrid Derivatives are covered as segments by Breeding Technology. Corn, Rice, Sorghum, Wheat are covered as segments by Crop. Canada, Mexico, United States are covered as segments by Country.| Breeding Technology | ||||||||
| ||||||||
| Open Pollinated Varieties & Hybrid Derivatives |
| Crop | |
| Corn | |
| Rice | |
| Sorghum | |
| Wheat | |
| Other Grains & Cereals |
| Country | |
| Canada | |
| Mexico | |
| United States | |
| Rest of North America |
Market Definition
- Commercial Seed - For the purpose of this study, only commercial seeds have been included as part of the scope. Farm-saved Seeds, which are not commercially labeled are excluded from scope, even though a minor percentage of farm-saved seeds are exchanged commercially among farmers. The scope also excludes vegetatively reproduced crops and plant parts, which may be commercially sold in the market.
- Crop Acreage - While calculating the acreage under different crops, the Gross Cropped Area has been considered. Also known as Area Harvested, according to the Food & Agricultural Organization (FAO), this includes the total area cultivated under a particular crop across seasons.
- Seed Replacement Rate - Seed Replacement Rate is the percentage of area sown out of the total area of crop planted in the season by using certified/quality seeds other than the farm-saved seed.
- Protected Cultivation - The report defines protected cultivation as the process of growing crops in a controlled environment. This includes greenhouses, glasshouses, hydroponics, aeroponics, or any other cultivation system that protects the crop against any abiotic stress. However, cultivation in an open field using plastic mulch is excluded from this definition and is included under open field.
Research Methodology
Mordor Intelligence follows a four-step methodology in all our reports.
- Step-1: IDENTIFY KEY VARIABLES: In order to build a robust forecasting methodology, the variables and factors identified in Step-1 are tested against available historical market numbers. Through an iterative process, the variables required for market forecast are set and the model is built on the basis of these variables.
- Step-2: Build a Market Model: Market-size estimations for the forecast years are in nominal terms. Inflation is not a part of the pricing, and the average selling price (ASP) is kept constant throughout the forecast period.
- Step-3: Validate and Finalize: In this important step, all market numbers, variables and analyst calls are validated through an extensive network of primary research experts from the market studied. The respondents are selected across levels and functions to generate a holistic picture of the market studied.
- Step-4: Research Outputs: Syndicated Reports, Custom Consulting Assignments, Databases & Subscription Platforms


