North America Processed Meat Market Size

| Icons | Lable | Value |
|---|---|---|
|
|
Study Period | 2016 - 2028 |
|
|
Base Year For Estimation | 2021 |
|
|
CAGR | 2.27 % |
|
|
Largest Share by Type | Pork |
|
|
Largest Share by Country | United States |
|
|
Market Concentration | High |
Major Players |
||
|
|
||
|
*Disclaimer: Major Players sorted in no particular order |
North America Processed Meat Market Analysis
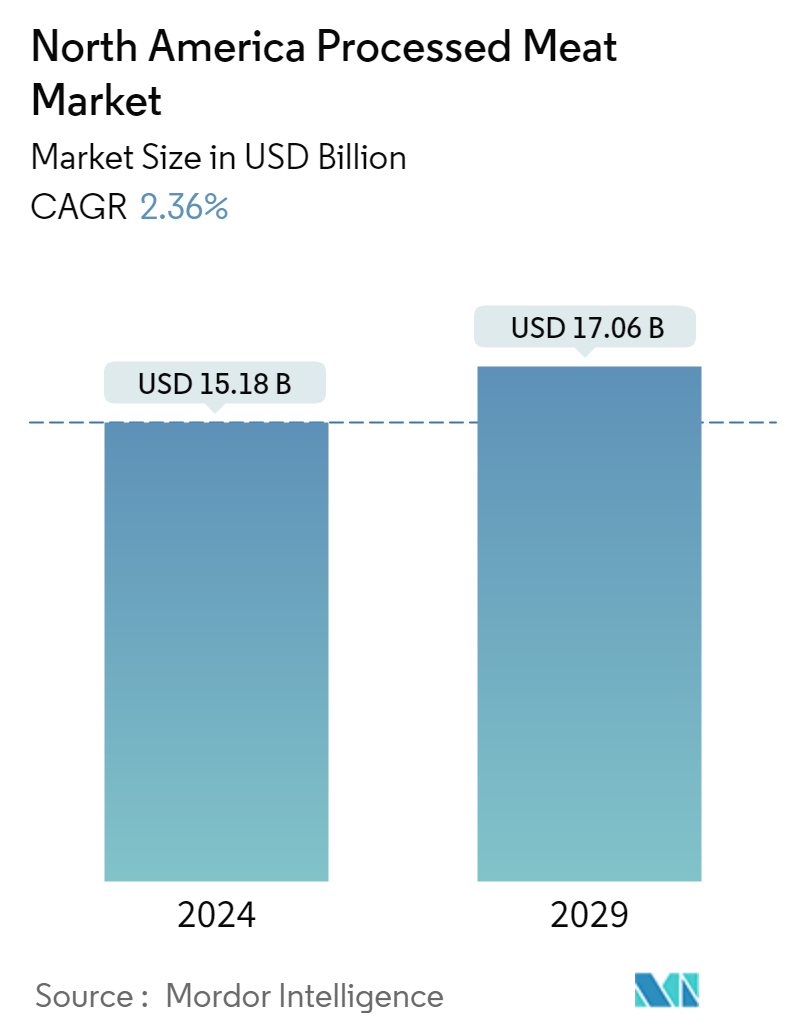
The North America Processed Meat Market is projected to register a CAGR of 2.27%
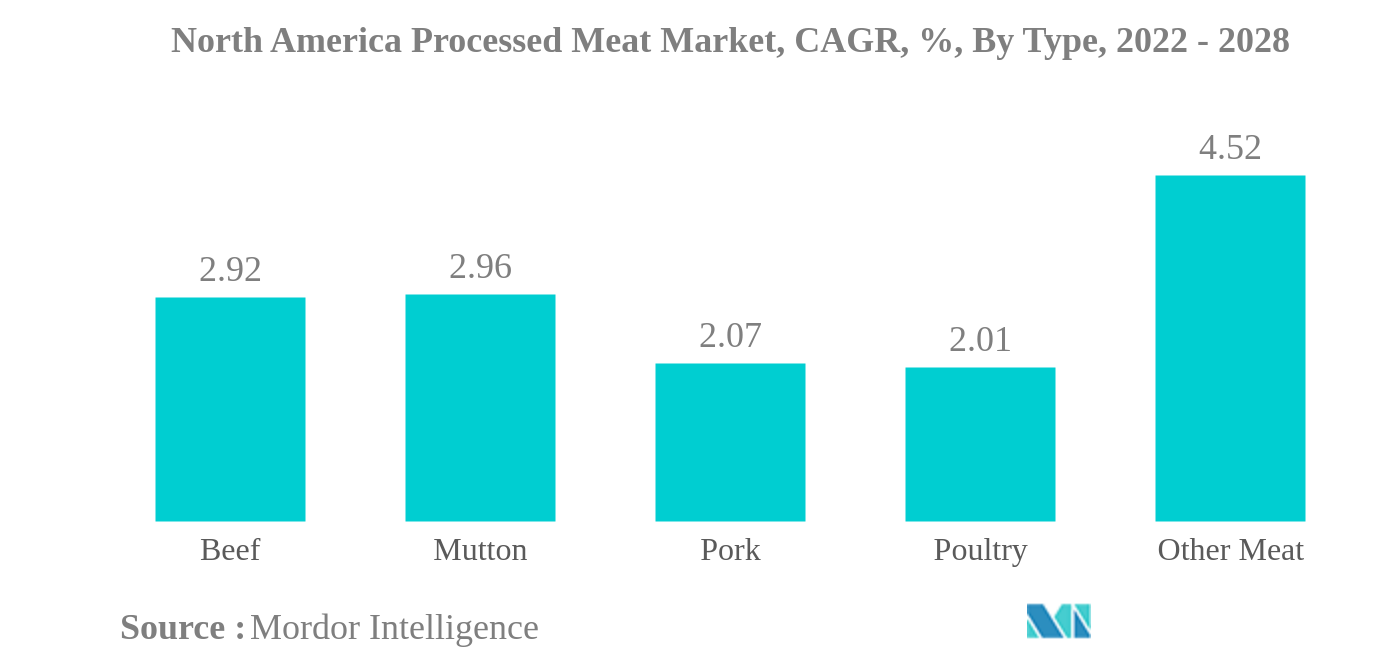
- Pork is the Largest Type : Products such as bacon, sausages, and ham have boosted the demand for processed pork items in the North American region as they are majorly consumed for breakfast and lunch.
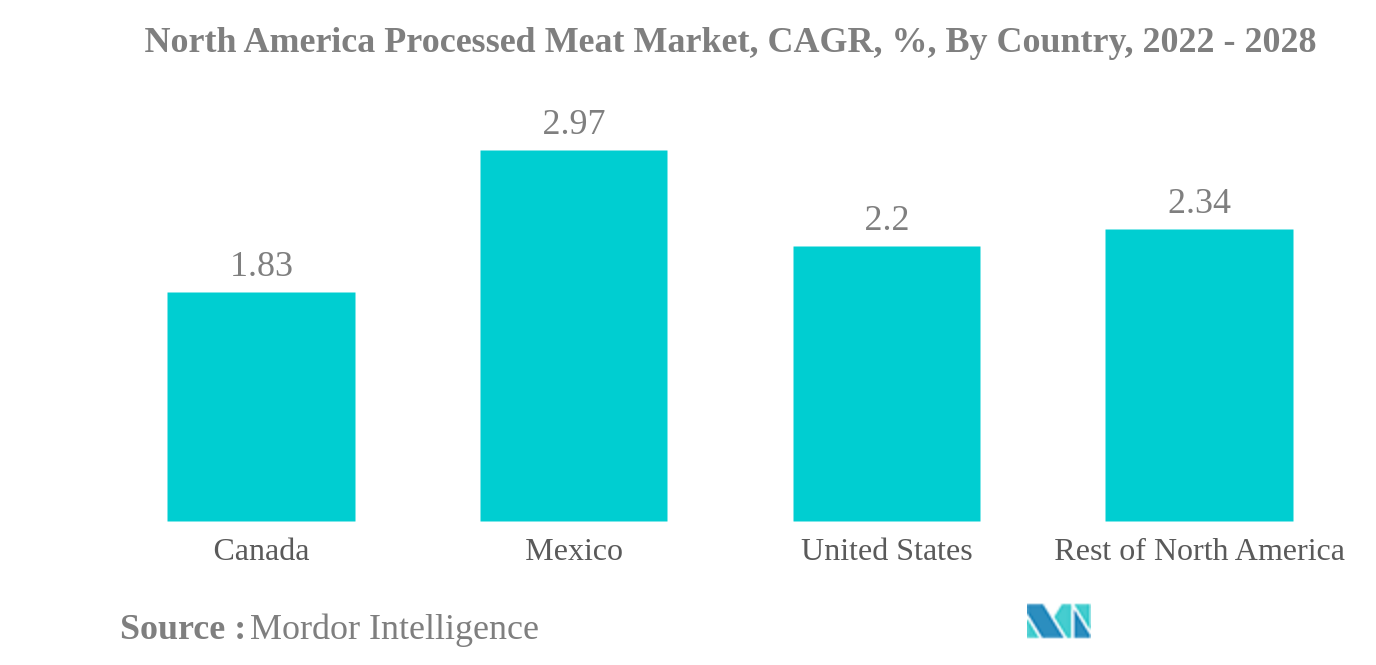
- United States is the Largest Country : Higher purchasing power and busy schedules of the consumers and the high rate of production due to feed availability are some of the major factors driving the US market.
- Mutton is the Fastest-growing Type : Demand for processed mutton and frozen lamb products is increasing as African and Middle Eastern populations, among whom these meats are popular, are growing in the region.
- Mexico is the Fastest-growing Country : The Mexican market is led by the increasing demand for processed beef and mutton. The booming online distribution offering these products is expected to drive the market.
North America Processed Meat Market Trends
This section covers the major market trends shaping the North America Processed Meat Market according to our research experts:
Pork is the largest Type
- The North American processed other meat segment includes lobsters, crabs, and oysters. It is projected to record the fastest revenue-based CAGR of 4.52% over the forecast period. With the increasing demand for quick-to-eat meals and the growing meat manufacturing industry, the market is projected to expand in the coming years. For instance, in Cuba, the on-trade channel records high sales of lobsters, as the channel offers a buy 1 get 1 scheme for lobster dishes. The increasing number of tourists, especially in Havana, is boosting the channel.
- The processed beef segment held the largest revenue share of 65% in 2021, owing to the increasing consumption of processed beef meat, at 25.53 kg/capita, in the year. Over the forecast period, the market growth is likely to be driven by organic feed used by farmers. Increased consumer disposable income and the number of working professionals, which increased by 34% in 2021, may drive the market.
- In 2020, processed items accounted for more than 63% of the total revenue of the meat market. Companies are innovating their products to gain consumers' interest. They are also expanding the supply of meat products in the market for items like sausages, salami, hot dogs, ham, bacon, and corned beef, which are frequently preserved to maintain quality.
- In July 2021, the USDA announced its intent to invest USD 500 million in the American Rescue Plan funds to expand the capacities of processed meat and poultry. With this investment, the market is likely to observe a constant Y-o-Y growth rate of 2% during the forecast period. The USDA is also issuing new rules on "Product of the USA” labels, which may further drive the processed meat market.
United States is the largest Country
- In North America, the overall sales by value for processed meat increased by 33% in 2020 from 2016. There is an increasing demand for ready-to-eat or ready-to-cook meat among consumers across the region, owing to their busy lifestyles. Factors such as long shelf life and hygienically processed and stored meat are boosting the growth of the North American processed meat market.
- The United States is a major country that consumes processed meat in the North American region. The overall sales value for processed meat increased by 40% in 2021 since 2016. Of all processed meat, processed pork is the most consumed in the United States and accounts for the major share of 47%, followed by processed poultry with 28%. Processed meat has wide availability in supermarkets, convenience stores, departmental stores, and vending machines, further driving the market's growth in the United States.
- Mexico is expected to be the fastest-growing country to consume processed meat in North America and is projected to register a CAGR of 3.34% during the forecast period. Mexicans usually prefer to consume processed meat, especially poultry. Due to this, Mexican animal health authorities are keen to gain recognition of avian influenza disease-free zones in the future, which is expected to further drive the market's growth.
- Moreover, government bodies in the United States are investing in processing facilities to benefit American farmers. For instance, in July 2021, USDA invested USD 500 million in meat and poultry processing facilities to increase the capacity and make agricultural markets more accessible. It also announced more than USD 150 million for the existing small processing facilities to compete in the market and increase the consumer base.
North America Processed Meat Industry Overview
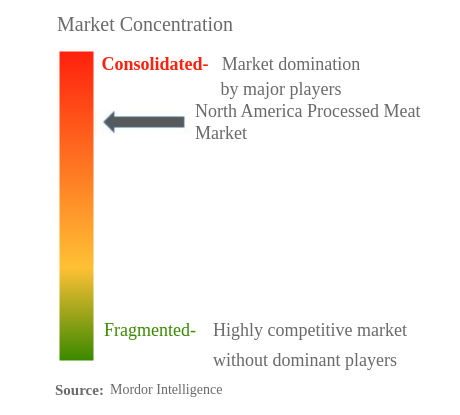
The North America Processed Meat Market is fairly consolidated, with the top five companies occupying 79.17%. The major players in this market are Hormel Foods Corporation, Marfrig Global Foods SA, Sysco Corporation, Tyson Foods, Inc. and WH Group Limited (sorted alphabetically).
North America Processed Meat Market Leaders
Hormel Foods Corporation
Marfrig Global Foods SA
Sysco Corporation
Tyson Foods, Inc.
WH Group Limited
*Disclaimer: Major Players sorted in no particular order
North America Processed Meat Market News
- August 2022: Tyson Foods has announced the expansion of its Caseyville Prepared Foods Facility. The USD180 million investment project will help meet the growing demand for Tyson Foods’ iconic Hillshire Farm® and Jimmy Dean® branded products. The first line is expected to begin production this fall with the expansion set to be completed in the summer of 2023. The Caseyville plant currently produces Hillshire Farm® and Jimmy Dean® products and the 170,000 square foot expansion will specifically allow a larger production of grab-n-go snacking and breakfast items.
- July 2022: Continental Grain Company and Cargill Inc. completed acquisition of Sanderson Farms, Inc and have combined Sanderson Farms with Wayne Farms naming Wayne-Sanderson Farms.
- June 2022: Hormel foods launched newest product i.e HORMEL® NATURAL CHOICE® Sandwich Pepperoni. The product is free from preservatives, nitrites or nitrates.
North America Processed Meat Market Report - Table of Contents
1. INTRODUCTION
1.1. Study Assumptions & Market Definition
1.2. Scope of the Study
1.3. Research Methodology
2. KEY INDUSTRY TRENDS
2.1. Price Trends
2.2. Production Trends
2.3. Regulatory Framework
2.4. Value Chain & Distribution Channel Analysis
3. MARKET SEGMENTATION
3.1. Type
3.1.1. Beef
3.1.2. Mutton
3.1.3. Pork
3.1.4. Poultry
3.1.5. Other Meat
3.2. Distribution Channel
3.2.1. Off-Trade
3.2.1.1. Convenience Stores
3.2.1.2. Online Channel
3.2.1.3. Supermarkets And Hypermarkets
3.2.1.4. Others
3.2.2. On-Trade
3.3. Country
3.3.1. Canada
3.3.2. Mexico
3.3.3. United States
3.3.4. Rest Of North America
4. COMPETITIVE LANDSCAPE
4.1. Key Strategic Moves
4.2. Market Share Analysis
4.3. Company Landscape
4.4. Company Profiles
4.4.1. BRF S.A
4.4.2. Continental Grain Company
4.4.3. Hormel Foods Corporation
4.4.4. Industrias Bachoco SA de CV
4.4.5. JBS SA
4.4.6. Maple Leaf Foods
4.4.7. Marfrig Global Foods SA
4.4.8. OSI Group
4.4.9. Sysco Corporation
4.4.10. Tyson Foods, Inc.
4.4.11. WH Group Limited
5. KEY STRATEGIC QUESTIONS FOR MEAT INDUSTRY CEOS
6. APPENDIX
6.1. Global Overview
6.1.1. Overview
6.1.2. Porter’s Five Forces Framework
6.1.3. Global Value Chain Analysis
6.1.4. Market Dynamics (DROs)
6.2. Sources & References
6.3. List of Tables & Figures
6.4. Primary Insights
6.5. Data Pack
6.6. Glossary of Terms
List of Tables & Figures
- Figure 1:
- NORTH AMERICA PROCESSED MEAT MARKET, BEEF, PRICE IN USD/METRIC TONNES, 2016 - 2022
- Figure 2:
- NORTH AMERICA PROCESSED MEAT MARKET, MUTTON, PRICE IN USD/METRIC TONNES, 2016 - 2022
- Figure 3:
- NORTH AMERICA PROCESSED MEAT MARKET, PORK, PRICE IN USD/METRIC TONNES, 2016 - 2022
- Figure 4:
- NORTH AMERICA PROCESSED MEAT MARKET, POULTRY, PRICE IN USD/METRIC TONNES, 2016 - 2022
- Figure 5:
- NORTH AMERICA PROCESSED MEAT MARKET, BEEF, PRODUCTION IN METRIC TONNES, 2016 - 2028
- Figure 6:
- NORTH AMERICA PROCESSED MEAT MARKET, MUTTON, PRODUCTION IN METRIC TONNES, 2016 - 2028
- Figure 7:
- NORTH AMERICA PROCESSED MEAT MARKET, PORK, PRODUCTION IN METRIC TONNES, 2016 - 2028
- Figure 8:
- NORTH AMERICA PROCESSED MEAT MARKET, POULTRY, PRODUCTION IN METRIC TONNES, 2016 - 2028
- Figure 9:
- NORTH AMERICA PROCESSED MEAT MARKET, VOLUME, METRIC TONNES, 2016 - 2028
- Figure 10:
- NORTH AMERICA PROCESSED MEAT MARKET, VALUE, USD, 2016 - 2028
- Figure 11:
- NORTH AMERICA PROCESSED MEAT MARKET, VOLUME IN METRIC TONNES, BY TYPE, 2016 - 2028
- Figure 12:
- NORTH AMERICA PROCESSED MEAT MARKET, VALUE IN USD, BY TYPE, 2016 - 2028
- Figure 13:
- NORTH AMERICA PROCESSED MEAT MARKET, VOLUME SHARE (%), BY TYPE, 2016 VS 2022 VS 2028
- Figure 14:
- NORTH AMERICA PROCESSED MEAT MARKET, VALUE SHARE (%), BY TYPE, 2016 VS 2022 VS 2028
- Figure 15:
- NORTH AMERICA PROCESSED MEAT MARKET, VOLUME IN METRIC TONNES, BEEF, 2016 - 2028
- Figure 16:
- NORTH AMERICA PROCESSED MEAT MARKET, VALUE IN USD, BEEF, 2016 - 2028
- Figure 17:
- NORTH AMERICA PROCESSED MEAT MARKET, BEEF, VALUE SHARE (%), BY DISTRIBUTION CHANNEL, 2021 VS 2028
- Figure 18:
- NORTH AMERICA PROCESSED MEAT MARKET, VOLUME IN METRIC TONNES, MUTTON, 2016 - 2028
- Figure 19:
- NORTH AMERICA PROCESSED MEAT MARKET, VALUE IN USD, MUTTON, 2016 - 2028
- Figure 20:
- NORTH AMERICA PROCESSED MEAT MARKET, MUTTON, VALUE SHARE (%), BY DISTRIBUTION CHANNEL, 2021 VS 2028
- Figure 21:
- NORTH AMERICA PROCESSED MEAT MARKET, VOLUME IN METRIC TONNES, PORK, 2016 - 2028
- Figure 22:
- NORTH AMERICA PROCESSED MEAT MARKET, VALUE IN USD, PORK, 2016 - 2028
- Figure 23:
- NORTH AMERICA PROCESSED MEAT MARKET, PORK, VALUE SHARE (%), BY DISTRIBUTION CHANNEL, 2021 VS 2028
- Figure 24:
- NORTH AMERICA PROCESSED MEAT MARKET, VOLUME IN METRIC TONNES, POULTRY, 2016 - 2028
- Figure 25:
- NORTH AMERICA PROCESSED MEAT MARKET, VALUE IN USD, POULTRY, 2016 - 2028
- Figure 26:
- NORTH AMERICA PROCESSED MEAT MARKET, POULTRY, VALUE SHARE (%), BY DISTRIBUTION CHANNEL, 2021 VS 2028
- Figure 27:
- NORTH AMERICA PROCESSED MEAT MARKET, VOLUME IN METRIC TONNES, OTHER MEAT, 2016 - 2028
- Figure 28:
- NORTH AMERICA PROCESSED MEAT MARKET, VALUE IN USD, OTHER MEAT, 2016 - 2028
- Figure 29:
- NORTH AMERICA PROCESSED MEAT MARKET, OTHER MEAT, VALUE SHARE (%), BY DISTRIBUTION CHANNEL, 2021 VS 2028
- Figure 30:
- NORTH AMERICA PROCESSED MEAT MARKET, VOLUME IN METRIC TONNES, BY DISTRIBUTION CHANNEL, 2016 - 2028
- Figure 31:
- NORTH AMERICA PROCESSED MEAT MARKET, VALUE IN USD, BY DISTRIBUTION CHANNEL, 2016 - 2028
- Figure 32:
- NORTH AMERICA PROCESSED MEAT MARKET, VOLUME SHARE (%), BY DISTRIBUTION CHANNEL, 2016 VS 2022 VS 2028
- Figure 33:
- NORTH AMERICA PROCESSED MEAT MARKET, VALUE SHARE (%), BY DISTRIBUTION CHANNEL, 2016 VS 2022 VS 2028
- Figure 34:
- NORTH AMERICA PROCESSED MEAT MARKET, VOLUME IN METRIC TONNES, BY OFF-TRADE, 2016 - 2028
- Figure 35:
- NORTH AMERICA PROCESSED MEAT MARKET, VALUE IN USD, BY OFF-TRADE, 2016 - 2028
- Figure 36:
- NORTH AMERICA PROCESSED MEAT MARKET, VOLUME SHARE (%), BY OFF-TRADE, 2016 VS 2022 VS 2028
- Figure 37:
- NORTH AMERICA PROCESSED MEAT MARKET, VALUE SHARE (%), BY OFF-TRADE, 2016 VS 2022 VS 2028
- Figure 38:
- NORTH AMERICA PROCESSED MEAT MARKET, VOLUME IN METRIC TONNES, CONVENIENCE STORES, 2016 - 2028
- Figure 39:
- NORTH AMERICA PROCESSED MEAT MARKET, VALUE IN USD, CONVENIENCE STORES, 2016 - 2028
- Figure 40:
- NORTH AMERICA PROCESSED MEAT MARKET, CONVENIENCE STORES, VALUE SHARE (%), BY TYPE, 2021 VS 2028
- Figure 41:
- NORTH AMERICA PROCESSED MEAT MARKET, VOLUME IN METRIC TONNES, ONLINE CHANNEL, 2016 - 2028
- Figure 42:
- NORTH AMERICA PROCESSED MEAT MARKET, VALUE IN USD, ONLINE CHANNEL, 2016 - 2028
- Figure 43:
- NORTH AMERICA PROCESSED MEAT MARKET, ONLINE CHANNEL, VALUE SHARE (%), BY TYPE, 2021 VS 2028
- Figure 44:
- NORTH AMERICA PROCESSED MEAT MARKET, VOLUME IN METRIC TONNES, SUPERMARKETS AND HYPERMARKETS, 2016 - 2028
- Figure 45:
- NORTH AMERICA PROCESSED MEAT MARKET, VALUE IN USD, SUPERMARKETS AND HYPERMARKETS, 2016 - 2028
- Figure 46:
- NORTH AMERICA PROCESSED MEAT MARKET, SUPERMARKETS AND HYPERMARKETS, VALUE SHARE (%), BY TYPE, 2021 VS 2028
- Figure 47:
- NORTH AMERICA PROCESSED MEAT MARKET, VOLUME IN METRIC TONNES, OTHERS, 2016 - 2028
- Figure 48:
- NORTH AMERICA PROCESSED MEAT MARKET, VALUE IN USD, OTHERS, 2016 - 2028
- Figure 49:
- NORTH AMERICA PROCESSED MEAT MARKET, OTHERS, VALUE SHARE (%), BY TYPE, 2021 VS 2028
- Figure 50:
- NORTH AMERICA PROCESSED MEAT MARKET, VOLUME IN METRIC TONNES, ON-TRADE, 2016 - 2028
- Figure 51:
- NORTH AMERICA PROCESSED MEAT MARKET, VALUE IN USD, ON-TRADE, 2016 - 2028
- Figure 52:
- NORTH AMERICA PROCESSED MEAT MARKET, VOLUME IN METRIC TONNES, BY COUNTRY, 2016 - 2028
- Figure 53:
- NORTH AMERICA PROCESSED MEAT MARKET, VALUE IN USD, BY COUNTRY, 2016 - 2028
- Figure 54:
- NORTH AMERICA PROCESSED MEAT MARKET, VOLUME SHARE (%), BY COUNTRY, 2016 VS 2022 VS 2028
- Figure 55:
- NORTH AMERICA PROCESSED MEAT MARKET, VOLUME SHARE (%), BY COUNTRY, 2016 VS 2022 VS 2028
- Figure 56:
- NORTH AMERICA PROCESSED MEAT MARKET, VOLUME IN METRIC TONNES, CANADA, 2016 - 2028
- Figure 57:
- NORTH AMERICA PROCESSED MEAT MARKET, VALUE IN USD, CANADA, 2016 - 2028
- Figure 58:
- NORTH AMERICA PROCESSED MEAT MARKET, CANADA, VALUE SHARE (%), BY DISTRIBUTION CHANNEL, 2021 VS 2028
- Figure 59:
- NORTH AMERICA PROCESSED MEAT MARKET, VOLUME IN METRIC TONNES, MEXICO, 2016 - 2028
- Figure 60:
- NORTH AMERICA PROCESSED MEAT MARKET, VALUE IN USD, MEXICO, 2016 - 2028
- Figure 61:
- NORTH AMERICA PROCESSED MEAT MARKET, MEXICO, VALUE SHARE (%), BY DISTRIBUTION CHANNEL, 2021 VS 2028
- Figure 62:
- NORTH AMERICA PROCESSED MEAT MARKET, VOLUME IN METRIC TONNES, UNITED STATES, 2016 - 2028
- Figure 63:
- NORTH AMERICA PROCESSED MEAT MARKET, VALUE IN USD, UNITED STATES, 2016 - 2028
- Figure 64:
- NORTH AMERICA PROCESSED MEAT MARKET, UNITED STATES, VALUE SHARE (%), BY DISTRIBUTION CHANNEL, 2021 VS 2028
- Figure 65:
- NORTH AMERICA PROCESSED MEAT MARKET, VOLUME IN METRIC TONNES, REST OF NORTH AMERICA, 2016 - 2028
- Figure 66:
- NORTH AMERICA PROCESSED MEAT MARKET, VALUE IN USD, REST OF NORTH AMERICA, 2016 - 2028
- Figure 67:
- NORTH AMERICA PROCESSED MEAT MARKET, REST OF NORTH AMERICA, VALUE SHARE (%), BY DISTRIBUTION CHANNEL, 2021 VS 2028
- Figure 68:
- NORTH AMERICA PROCESSED MEAT MARKET, MOST ACTIVE COMPANIES, BY NUMBER OF STRATEGIC MOVES, 2017 - 2022
- Figure 69:
- NORTH AMERICA PROCESSED MEAT MARKET, TOTAL NUMBER OF STRATEGIC MOVES, 2017 - 2022
- Figure 70:
- NORTH AMERICA PROCESSED MEAT MARKET SHARE(%), BY KEY PLAYERS, 2021
North America Processed Meat Industry Segmentation
Beef, Mutton, Pork, Poultry are covered as segments by Type. Off-Trade, On-Trade are covered as segments by Distribution Channel. Canada, Mexico, United States are covered as segments by Country.| Type | |
| Beef | |
| Mutton | |
| Pork | |
| Poultry | |
| Other Meat |
| Distribution Channel | ||||||
| ||||||
| On-Trade |
| Country | |
| Canada | |
| Mexico | |
| United States | |
| Rest Of North America |
Market Definition
- Meat - Meat is defined as the flesh or other edible parts of an animal used for food. The end use of the meat industry consists of only human consumption. Meat is generally purchased from retail outlets for home cooking and consumption. For the market studied, only uncooked meat has been considered. This could be processed in various forms, which have been covered under the “Processed” form. The other purchases of meat happen through the consumption of meat at foodservice outlets (restaurants, hotels, catering, etc.).
- Other Meats - The other meat segment includes the meat of camel, horse, rabbit, etc. These are not so commonly consumed meat types but still, have a presence in distinct parts of the world. Regardless of it being part of red meat, we have considered these meat types separately for a better understanding of the market.
- Poultry Meat - Poultry meat also called white meat, comes from birds raised commercially or domestically for human consumption. This includes chicken, turkey, ducks, and geese.
- Red Meat - Red meat typically has a red color when raw and a dark color when cooked. It includes any meat that comes from mammals, such as beef, lamb, pork, goat, veal, and mutton.
Research Methodology
Mordor Intelligence follows a four-step methodology in all our reports.
- Step-1: Identify Key Variables: In order to build a robust forecasting methodology, the variables and factors identified in Step 1 are tested against available historical market numbers. Through an iterative process, the variables required for market forecast are set, and the model is built on the basis of these variables.
- Step-2: Build a Market Model: Market-size estimations for the forecast years are in nominal terms. Inflation is not a part of the pricing, and the average selling price (ASP) is kept constant throughout the forecast period for each country.
- Step-3: Validate and Finalize: In this important step, all market numbers, variables, and analyst calls are validated through an extensive network of primary research experts from the market studied. The respondents are selected across levels and functions to generate a holistic picture of the market studied.
- Step-4: Research Outputs: Syndicated Reports, Custom Consulting Assignments, Databases & Subscription Platforms


