North America Road Freight Transport Market Size

| Icons | Lable | Value |
|---|---|---|
|
|
Study Period | 2016 - 2028 |
|
|
Base Year For Estimation | 2021 |
|
|
CAGR | 3.92 % |
|
|
Largest Share by End User | Manufacturing |
|
|
Largest Share by Country | United States |
|
|
Market Concentration | High |
Major Players |
||
|
|
||
|
*Disclaimer: Major Players sorted in no particular order |
North America Road Freight Transport Market Analysis
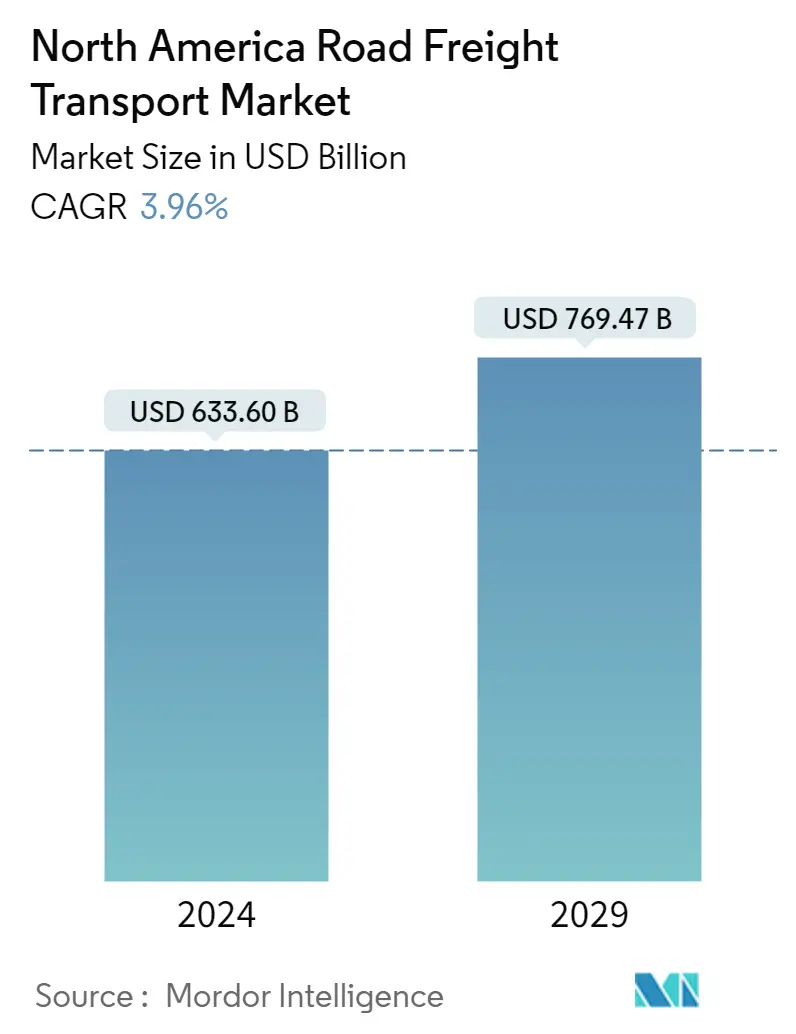
The North America Road Freight Transport Market is projected to register a CAGR of 3.92%
- Largest Segment by Distance - Long Haul : Long-haul trucking accounts for the highest market share in the North America road freight transport market owing to the initiatives taken by the government to increase infrastructure developments that facilitated the growth of cross-border trades.
- Largest Segment by Product Type - Solid Goods : Solid goods dominate the product type segment over liquid goods in North America, as most of the goods transported within the solid goods segment also broadly contribute to the region's value-added output.
- Largest Segment by End User - Manufacturing : The Manufacturing sector is the largest segment among end-user industries. The industry contributed around 11.2% towards GDP of the country.
- Fastest Growing Segment by TruckLoad Specification - Full Truckload : The full truckload segment is the fastest-growing segment in North America. The rising popularity of Radio Frequency Identification (RFID) tags is one of the key trends that is expected to contribute to the market's growth.
North America Road Freight Transport Market Trends
This section covers the major market trends shaping the North America Road Freight Transport Market according to our research experts:
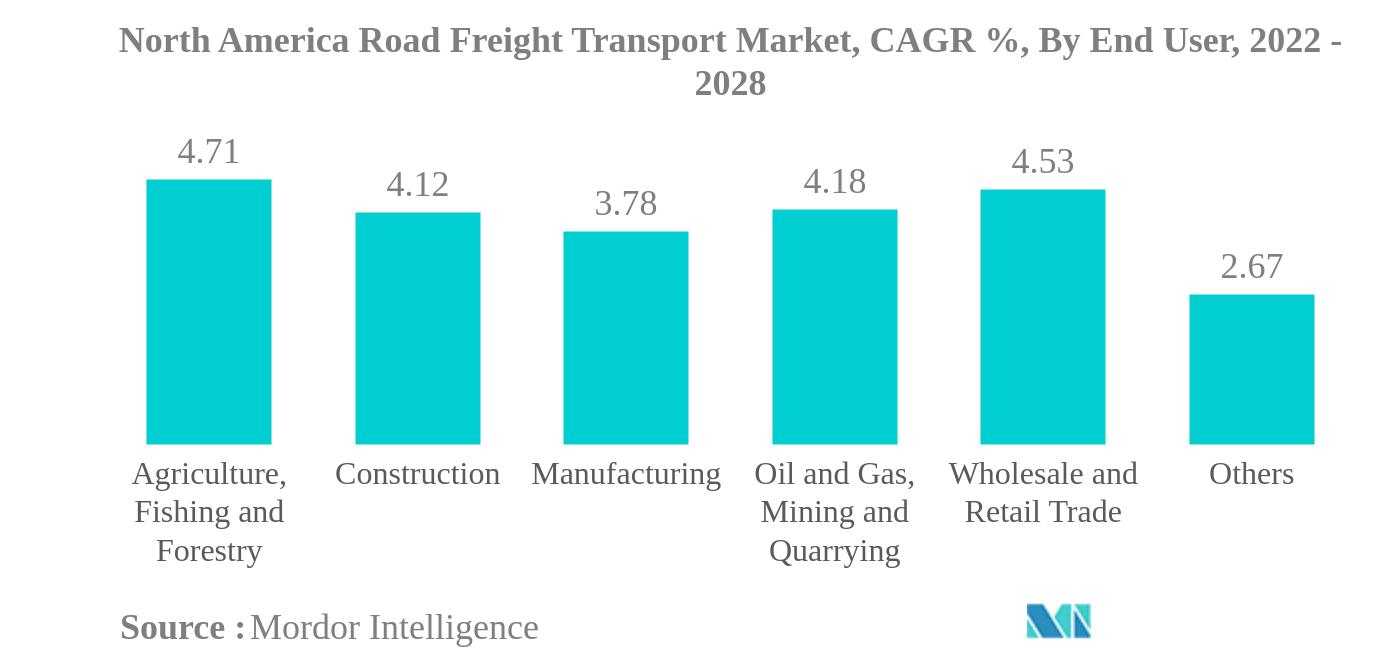
Manufacturing is the largest segment by End User.
- In 2020, the manufacturing sector was the largest contributing sector in the road freight transport market, with a share of 29.45%, followed by the wholesale and retail trade sector with a share of 29.10%. Also, these two sectors were the major contributors to North America's GDP, with a share of 12.2% for wholesale and retail trade and 11.2% for the manufacturing sector in 2021.
- The end-user segment of road freight transportation experienced a decline of 2.70% YoY in 2018, followed by a decline of 0.38% YoY in 2019 in volume terms due to the decreased trade patterns of the United States caused by the US-China trade war. The oil and gas, mining, and quarrying segment witnessed a maximum decline of 5.37% YoY in 2019, owing to the decline in drilling activity related to natural gas and oil.
- The agriculture, fishing, and forestry sector in North America has been experiencing the highest CAGR of 6.8% over the past five years. Thus, the scope in this segment is anticipated to be paramount in terms of growth. However, during the forecast period (2022-2028), within the end-user segment of the road freight transport market, the oil and gas, mining, and quarrying sector is expected to register the highest CAGR of 4.98%, followed by the agriculture, fishing, and forestry segment with CAGR of 4.45%.
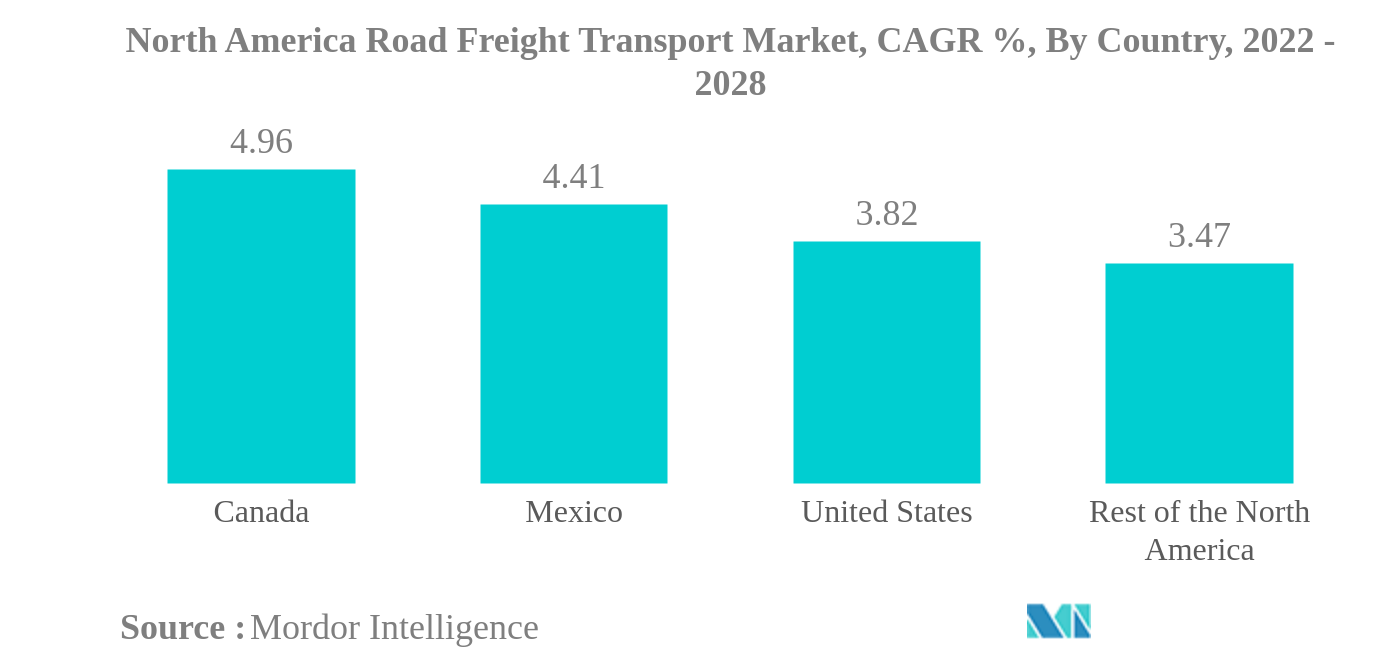
United States is the largest segment by Country.
- The United States dominated the North American road freight transport market in 2020 and captured a market share of 84.86%, followed by Mexico and Canada, which captured a share of 7.30% and 5.08%, respectively. Although Canada is a larger economy than Mexico, the Mexican road freight transport market is around 3% larger than Canada's.
- In 2018, the impact of the recession due to the US-China trade war on the US trucking industry led to a 2.70% YoY decline in the North American road freight transport market, followed by a decline of 0.38% YoY in 2019 in terms of volume. One of the reasons for the decline was a decrease in the imports and exports of goods by 1.70% YoY (USD 3349.8 billion) and 0.54% YoY (USD 2344.6 billion), respectively, in North America during 2019.
- In 2020, as the pandemic hit the world, the North American road freight market witnessed a declining growth of 0.55% YoY and reached 4042.8 billion ton-km in volume. The US, Canada, and Mexico's major industries that contributed to the countries' growth were disrupted when the lockdowns were imposed. However, the North American road freight market was resilient enough to recover in 2021, with a growth rate of 4.91% YoY in volume as the internal industries recovered and the imports and exports increased by 22.56% YoY and 22.14% YoY, respectively, in the region. Canada is anticipated to experience maximum growth during the forecast period, recording the highest CAGR of 4.96% from 2022 to 2028.
North America Road Freight Transport Industry Overview
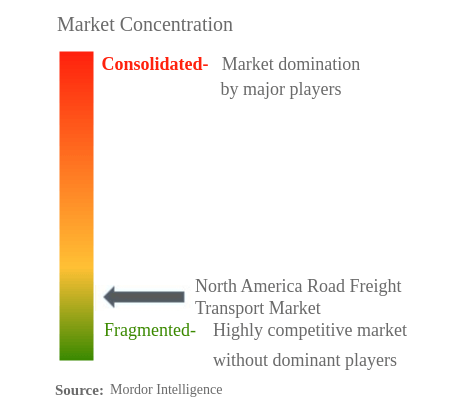
The North America Road Freight Transport Market is fragmented, with the top five companies occupying 21.32%. The major players in this market are C.H. Robinson, FedEx, J.B. Hunt Transport Services Inc., Ryder System and United Parcel Service (UPS) (sorted alphabetically).
North America Road Freight Transport Market Leaders
C.H. Robinson
FedEx
J.B. Hunt Transport Services Inc.
Ryder System
United Parcel Service (UPS)
*Disclaimer: Major Players sorted in no particular order
North America Road Freight Transport Market News
- May 2022: In September 2021, FedEx collaborated with Aurora and Paccar to test autonomous linehaul technology. Following this collaboration, in May 2022, Aurora expanded the autonomous freight pilot with FedEx in Texas.
- May 2022: Landstar System provides Landstar Clarity™, a new freight-tracking exception-management tool. With this tool, location data from trucks can be updated every 15 minutes, and it also has many more features for problem-solving along the supply chain.
- May 2022: Maersk completed the acquisition of Pilot Freight Services, a US-based international and domestic supply chain provider with cross-border solutions, in Canada and Mexico.
North America Road Freight Transport Market Report - Table of Contents
1. EXECUTIVE SUMMARY & KEY FINDINGS
2. REPORT OFFERS
3. INTRODUCTION
3.1. Study Assumptions & Market Definition
3.2. Scope of the Study
3.3. Research Methodology
4. KEY INDUSTRY TRENDS
4.1. GDP Distribution By Economic Activity
4.2. GDP Growth By Economic Activity
4.3. Wholesale Price Inflation
4.4. Economic Performance And Profile
4.5. Transport And Storage Sector GDP
4.6. Logistics Performance
4.7. Modal Share Of Freight Transport Sector
4.8. Length Of Roads
4.9. Export Trends
4.10. Import Trends
4.11. Fuel Pricing Trends
4.12. Trucking Operational Costs
4.13. Trucking Fleet Size By Type
4.14. Major Truck Suppliers
4.15. Road Freight Tonnage Trends
4.16. Road Freight Pricing Trends
4.17. Regulatory Framework
4.18. Value Chain & Distribution Channel Analysis
5. MARKET SEGMENTATION
5.1. End User
5.1.1. Agriculture, Fishing And Forestry
5.1.2. Construction
5.1.3. Manufacturing
5.1.4. Oil And Gas, Mining And Quarrying
5.1.5. Wholesale And Retail Trade
5.1.6. Others
5.2. Destination
5.2.1. Domestic
5.2.2. International
5.3. Truckload Specification
5.3.1. Full Truckload
5.3.2. Less Than Truckload
5.4. Containerization
5.4.1. Containerized
5.4.2. Non- Containerized
5.5. Distance
5.5.1. Long Haul
5.5.2. Short Haul
5.6. Product Type
5.6.1. Liquid Goods
5.6.2. Solid Goods
5.7. Temperature Control
5.7.1. Controlled
5.7.2. Non-Controlled
5.8. Country
5.8.1. Canada
5.8.2. Mexico
5.8.3. United States
5.8.4. Rest Of The North America
6. COMPETITIVE LANDSCAPE
6.1. Key Strategic Moves
6.2. Market Share Analysis
6.3. Company Landscape
6.4. Company Profiles
6.4.1. ArcBest
6.4.2. C.H. Robinson
6.4.3. Ceva Logistics
6.4.4. Deutsche Post DHL Group
6.4.5. DSV
6.4.6. FedEx
6.4.7. J.B. Hunt Transport Services Inc.
6.4.8. Knight-Swift Transportation
6.4.9. Landstar System Inc.
6.4.10. Maersk
6.4.11. Old Dominion Freight Line
6.4.12. Ryder System
6.4.13. Schneider
6.4.14. United Parcel Service (UPS)
6.4.15. Werner Enterprises Inc.
6.4.16. XPO Logistics Inc.
6.4.17. Yellow Corporation
7. KEY STRATEGIC QUESTIONS FOR ROAD FREIGHT CEOS
8. APPENDIX
8.1. Global Logistics Market Overview
8.1.1. Overview
8.1.2. Porter’s Five Forces Framework
8.1.3. Global Value Chain Analysis
8.1.4. Market Dynamics (Market Drivers, Restraints & Opportunities)
8.2. Sources & References
8.3. List of Tables & Figures
8.4. Primary Insights
8.5. Data Pack
8.6. Glossary of Terms
8.7. Currency Exchange Rate
List of Tables & Figures
- Figure 1:
- DISTRIBUTION OF GROSS DOMESTIC PRODUCT BY ECONOMIC ACTIVITY, NORTH AMERICA, SHARE %, 2021
- Figure 2:
- GROWTH OF GROSS DOMESTIC PRODUCT BY ECONOMIC ACTIVITY, NORTH AMERICA, CAGR %, 2016 – 2021
- Figure 3:
- WHOLESALE PRICE INFLATION RATE, CANADA, PERCENTAGE (%), 2016 – 2021
- Figure 4:
- WHOLESALE PRICE INFLATION RATE, MEXICO, PERCENTAGE (%), 2016 – 2021
- Figure 5:
- WHOLESALE PRICE INFLATION RATE, UNITED STATES, PERCENTAGE (%), 2016 – 2021
- Figure 6:
- TRENDS IN E-COMMERCE INDUSTRY, NORTH AMERICA, VALUE, USD, 2016 – 2021
- Figure 7:
- TRENDS IN E-COMMERCE INDUSTRY BY SECTOR, NORTH AMERICA, SHARE %, 2021
- Figure 8:
- TRENDS IN MANUFACTURING INDUSTRY, NORTH AMERICA, VALUE, USD, 2016 – 2021
- Figure 9:
- TRENDS IN MANUFACTURING INDUSTRY BY SECTOR, NORTH AMERICA, SHARE %, 2021
- Figure 10:
- TRANSPORT AND STORAGE SECTOR GROSS DOMESTIC PRODUCT, NORTH AMERICA, VALUE, USD, 2016 – 2021
- Figure 11:
- TRANSPORT AND STORAGE SECTOR GROSS DOMESTIC PRODUCT, NORTH AMERICA, SHARE %, 2016 – 2021
- Figure 12:
- LOGISTICS PERFORMANCE, CANADA, RANK, 2010 – 2018
- Figure 13:
- LOGISTICS PERFORMANCE, MEXICO, RANK, 2010 – 2018
- Figure 14:
- LOGISTICS PERFORMANCE, UNITED STATES, RANK, 2010 – 2018
- Figure 15:
- MODAL SHARE OF FREIGHT TRANSPORT SECTOR, NORTH AMERICA, SHARE %, BY VOLUME (TONS), SHARE%, 2021
- Figure 16:
- LENGTH OF ROADS BY TYPE OF SURFACE, NORTH AMERICA, SHARE %, 2021
- Figure 17:
- LENGTH OF ROADS BY TYPE OF ROAD, NORTH AMERICA, SHARE %, 2021
- Figure 18:
- VALUE OF EXPORTS, NORTH AMERICA, USD, 2016-2021
- Figure 19:
- VALUE OF IMPORTS, NORTH AMERICA, USD, 2016-2021
- Figure 20:
- FUEL PRICE BY TYPE OF FUEL, NORTH AMERICA, USD PER LITRE, 2016-2021
- Figure 21:
- TRUCKING OPERATIONAL COSTS, NORTH AMERICA, SHARE %, 2021
- Figure 22:
- TRUCKING FLEET SIZE BY TYPE, NORTH AMERICA, SHARE %, 2021
- Figure 23:
- MAJOR TRUCK SUPPLIER BRANDS, NORTH AMERICA, SHARE %, 2021
- Figure 24:
- ROAD FREIGHT TRANSPORT LOAD PICKED, NORTH AMERICA, TONS, 2016-2028
- Figure 25:
- ROAD FREIGHT TRANSPORT RATES, NORTH AMERICA, USD/TON-KM, 2016-2021
- Figure 26:
- NORTH AMERICA ROAD FREIGHT TRANSPORT MARKET, VOLUME, TON-KM, 2016 - 2028
- Figure 27:
- NORTH AMERICA ROAD FREIGHT TRANSPORT MARKET, VALUE, USD, 2016 - 2028
- Figure 28:
- NORTH AMERICA ROAD FREIGHT TRANSPORT MARKET, BY END USER, VOLUME, TON-KM, 2016 - 2028
- Figure 29:
- NORTH AMERICA ROAD FREIGHT TRANSPORT MARKET, BY END USER, VALUE, USD, 2016 - 2028
- Figure 30:
- NORTH AMERICA ROAD FREIGHT TRANSPORT MARKET, SHARE(%), VALUE, BY END USER, 2016 - 2028
- Figure 31:
- NORTH AMERICA ROAD FREIGHT TRANSPORT MARKET, AGRICULTURE, FISHING AND FORESTRY, VOLUME, TON-KM, 2016 - 2028
- Figure 32:
- NORTH AMERICA ROAD FREIGHT TRANSPORT MARKET, AGRICULTURE, FISHING AND FORESTRY, VALUE, USD, 2016 - 2028
- Figure 33:
- NORTH AMERICA ROAD FREIGHT TRANSPORT MARKET, SHARE(%), BY DESTINATION, 2021 - 2028
- Figure 34:
- NORTH AMERICA ROAD FREIGHT TRANSPORT MARKET, CONSTRUCTION, VOLUME, TON-KM, 2016 - 2028
- Figure 35:
- NORTH AMERICA ROAD FREIGHT TRANSPORT MARKET, CONSTRUCTION, VALUE, USD, 2016 - 2028
- Figure 36:
- NORTH AMERICA ROAD FREIGHT TRANSPORT MARKET, SHARE(%), BY DESTINATION, 2021 - 2028
- Figure 37:
- NORTH AMERICA ROAD FREIGHT TRANSPORT MARKET, MANUFACTURING, VOLUME, TON-KM, 2016 - 2028
- Figure 38:
- NORTH AMERICA ROAD FREIGHT TRANSPORT MARKET, MANUFACTURING, VALUE, USD, 2016 - 2028
- Figure 39:
- NORTH AMERICA ROAD FREIGHT TRANSPORT MARKET, SHARE(%), BY DESTINATION, 2021 - 2028
- Figure 40:
- NORTH AMERICA ROAD FREIGHT TRANSPORT MARKET, OIL AND GAS, MINING AND QUARRYING, VOLUME, TON-KM, 2016 - 2028
- Figure 41:
- NORTH AMERICA ROAD FREIGHT TRANSPORT MARKET, OIL AND GAS, MINING AND QUARRYING, VALUE, USD, 2016 - 2028
- Figure 42:
- NORTH AMERICA ROAD FREIGHT TRANSPORT MARKET, SHARE(%), BY DESTINATION, 2021 - 2028
- Figure 43:
- NORTH AMERICA ROAD FREIGHT TRANSPORT MARKET, WHOLESALE AND RETAIL TRADE, VOLUME, TON-KM, 2016 - 2028
- Figure 44:
- NORTH AMERICA ROAD FREIGHT TRANSPORT MARKET, WHOLESALE AND RETAIL TRADE, VALUE, USD, 2016 - 2028
- Figure 45:
- NORTH AMERICA ROAD FREIGHT TRANSPORT MARKET, SHARE(%), BY DESTINATION, 2021 - 2028
- Figure 46:
- NORTH AMERICA ROAD FREIGHT TRANSPORT MARKET, OTHERS, VOLUME, TON-KM, 2016 - 2028
- Figure 47:
- NORTH AMERICA ROAD FREIGHT TRANSPORT MARKET, OTHERS, VALUE, USD, 2016 - 2028
- Figure 48:
- NORTH AMERICA ROAD FREIGHT TRANSPORT MARKET, SHARE(%), BY DESTINATION, 2021 - 2028
- Figure 49:
- NORTH AMERICA ROAD FREIGHT TRANSPORT MARKET, BY DESTINATION, VOLUME, TON-KM, 2016 - 2028
- Figure 50:
- NORTH AMERICA ROAD FREIGHT TRANSPORT MARKET, BY DESTINATION, VALUE, USD, 2016 - 2028
- Figure 51:
- NORTH AMERICA ROAD FREIGHT TRANSPORT MARKET, SHARE(%), VALUE, BY DESTINATION, 2016 - 2028
- Figure 52:
- NORTH AMERICA ROAD FREIGHT TRANSPORT MARKET, DOMESTIC, VOLUME, TON-KM, 2016 - 2028
- Figure 53:
- NORTH AMERICA ROAD FREIGHT TRANSPORT MARKET, DOMESTIC, VALUE, USD, 2016 - 2028
- Figure 54:
- NORTH AMERICA ROAD FREIGHT TRANSPORT MARKET, SHARE(%), BY END USER, 2021 - 2028
- Figure 55:
- NORTH AMERICA ROAD FREIGHT TRANSPORT MARKET, INTERNATIONAL, VOLUME, TON-KM, 2016 - 2028
- Figure 56:
- NORTH AMERICA ROAD FREIGHT TRANSPORT MARKET, INTERNATIONAL, VALUE, USD, 2016 - 2028
- Figure 57:
- NORTH AMERICA ROAD FREIGHT TRANSPORT MARKET, SHARE(%), BY END USER, 2021 - 2028
- Figure 58:
- NORTH AMERICA ROAD FREIGHT TRANSPORT MARKET, BY TRUCKLOAD SPECIFICATION, VALUE, USD, 2016 - 2028
- Figure 59:
- NORTH AMERICA ROAD FREIGHT TRANSPORT MARKET, SHARE(%), VALUE, BY TRUCKLOAD SPECIFICATION, 2016 - 2028
- Figure 60:
- NORTH AMERICA ROAD FREIGHT TRANSPORT MARKET, FULL TRUCKLOAD, VALUE, USD, 2016 - 2028
- Figure 61:
- NORTH AMERICA ROAD FREIGHT TRANSPORT MARKET, GROWTH (2016-2021) AND FORECASTS (2022-2028), CAGR %
- Figure 62:
- NORTH AMERICA ROAD FREIGHT TRANSPORT MARKET, LESS THAN TRUCKLOAD, VALUE, USD, 2016 - 2028
- Figure 63:
- NORTH AMERICA ROAD FREIGHT TRANSPORT MARKET, GROWTH (2016-2021) AND FORECASTS (2022-2028), CAGR %
- Figure 64:
- NORTH AMERICA ROAD FREIGHT TRANSPORT MARKET, BY CONTAINERIZATION, VALUE, USD, 2016 - 2028
- Figure 65:
- NORTH AMERICA ROAD FREIGHT TRANSPORT MARKET, SHARE(%), VALUE, BY CONTAINERIZATION, 2016 - 2028
- Figure 66:
- NORTH AMERICA ROAD FREIGHT TRANSPORT MARKET, CONTAINERIZED, VALUE, USD, 2016 - 2028
- Figure 67:
- NORTH AMERICA ROAD FREIGHT TRANSPORT MARKET, GROWTH (2016-2021) AND FORECASTS (2022-2028), CAGR %
- Figure 68:
- NORTH AMERICA ROAD FREIGHT TRANSPORT MARKET, NON- CONTAINERIZED, VALUE, USD, 2016 - 2028
- Figure 69:
- NORTH AMERICA ROAD FREIGHT TRANSPORT MARKET, GROWTH (2016-2021) AND FORECASTS (2022-2028), CAGR %
- Figure 70:
- NORTH AMERICA ROAD FREIGHT TRANSPORT MARKET, BY DISTANCE, VALUE, USD, 2016 - 2028
- Figure 71:
- NORTH AMERICA ROAD FREIGHT TRANSPORT MARKET, SHARE(%), VALUE, BY DISTANCE, 2016 - 2028
- Figure 72:
- NORTH AMERICA ROAD FREIGHT TRANSPORT MARKET, LONG HAUL, VALUE, USD, 2016 - 2028
- Figure 73:
- NORTH AMERICA ROAD FREIGHT TRANSPORT MARKET, GROWTH (2016-2021) AND FORECASTS (2022-2028), CAGR %
- Figure 74:
- NORTH AMERICA ROAD FREIGHT TRANSPORT MARKET, SHORT HAUL, VALUE, USD, 2016 - 2028
- Figure 75:
- NORTH AMERICA ROAD FREIGHT TRANSPORT MARKET, GROWTH (2016-2021) AND FORECASTS (2022-2028), CAGR %
- Figure 76:
- NORTH AMERICA ROAD FREIGHT TRANSPORT MARKET, BY PRODUCT TYPE, VALUE, USD, 2016 - 2028
- Figure 77:
- NORTH AMERICA ROAD FREIGHT TRANSPORT MARKET, SHARE(%), VALUE, BY PRODUCT TYPE, 2016 - 2028
- Figure 78:
- NORTH AMERICA ROAD FREIGHT TRANSPORT MARKET, LIQUID GOODS, VALUE, USD, 2016 - 2028
- Figure 79:
- NORTH AMERICA ROAD FREIGHT TRANSPORT MARKET, GROWTH (2016-2021) AND FORECASTS (2022-2028), CAGR %
- Figure 80:
- NORTH AMERICA ROAD FREIGHT TRANSPORT MARKET, SOLID GOODS, VALUE, USD, 2016 - 2028
- Figure 81:
- NORTH AMERICA ROAD FREIGHT TRANSPORT MARKET, GROWTH (2016-2021) AND FORECASTS (2022-2028), CAGR %
- Figure 82:
- NORTH AMERICA ROAD FREIGHT TRANSPORT MARKET, BY TEMPERATURE CONTROL, VALUE, USD, 2016 - 2028
- Figure 83:
- NORTH AMERICA ROAD FREIGHT TRANSPORT MARKET, SHARE(%), VALUE, BY TEMPERATURE CONTROL, 2016 - 2028
- Figure 84:
- NORTH AMERICA ROAD FREIGHT TRANSPORT MARKET, CONTROLLED, VALUE, USD, 2016 - 2028
- Figure 85:
- NORTH AMERICA ROAD FREIGHT TRANSPORT MARKET, GROWTH (2016-2021) AND FORECASTS (2022-2028), CAGR %
- Figure 86:
- NORTH AMERICA ROAD FREIGHT TRANSPORT MARKET, NON-CONTROLLED, VALUE, USD, 2016 - 2028
- Figure 87:
- NORTH AMERICA ROAD FREIGHT TRANSPORT MARKET, GROWTH (2016-2021) AND FORECASTS (2022-2028), CAGR %
- Figure 88:
- NORTH AMERICA ROAD FREIGHT TRANSPORT MARKET, MEXICO, VALUE, USD, 2016 - 2028
- Figure 89:
- NORTH AMERICA ROAD FREIGHT TRANSPORT MARKET, GROWTH (2016-2021) AND FORECASTS (2022-2028), CAGR %
- Figure 90:
- NORTH AMERICA ROAD FREIGHT TRANSPORT MARKET, UNITED STATES, VALUE, USD, 2016 - 2028
- Figure 91:
- NORTH AMERICA ROAD FREIGHT TRANSPORT MARKET, GROWTH (2016-2021) AND FORECASTS (2022-2028), CAGR %
- Figure 92:
- NORTH AMERICA ROAD FREIGHT TRANSPORT MARKET, REST OF THE NORTH AMERICA, VALUE, USD, 2016 - 2028
- Figure 93:
- NORTH AMERICA ROAD FREIGHT TRANSPORT MARKET, GROWTH (2016-2021) AND FORECASTS (2022-2028), CAGR %
- Figure 94:
- NORTH AMERICA ROAD FREIGHT TRANSPORT MARKET, MOST ACTIVE COMPANIES, BY NUMBER OF STRATEGIC MOVES, 2018 - 2021
- Figure 95:
- NORTH AMERICA ROAD FREIGHT TRANSPORT MARKET, MOST ADOPTED STRATEGIES, 2018 - 2021
- Figure 96:
- NORTH AMERICA ROAD FREIGHT TRANSPORT MARKET SHARE(%), BY MAJOR PLAYERS, 2021
North America Road Freight Transport Industry Segmentation
Agriculture, Fishing And Forestry, Construction, Manufacturing, Oil And Gas, Mining And Quarrying, Wholesale And Retail Trade, Others are covered as segments by End User. Domestic, International are covered as segments by Destination. Full Truckload, Less Than Truckload are covered as segments by Truckload Specification. Containerized, Non- Containerized are covered as segments by Containerization. Long Haul, Short Haul are covered as segments by Distance. Liquid Goods, Solid Goods are covered as segments by Product Type. Controlled, Non-Controlled are covered as segments by Temperature Control. Canada, Mexico, United States are covered as segments by Country.| End User | |
| Agriculture, Fishing And Forestry | |
| Construction | |
| Manufacturing | |
| Oil And Gas, Mining And Quarrying | |
| Wholesale And Retail Trade | |
| Others |
| Destination | |
| Domestic | |
| International |
| Truckload Specification | |
| Full Truckload | |
| Less Than Truckload |
| Containerization | |
| Containerized | |
| Non- Containerized |
| Distance | |
| Long Haul | |
| Short Haul |
| Product Type | |
| Liquid Goods | |
| Solid Goods |
| Temperature Control | |
| Controlled | |
| Non-Controlled |
| Country | |
| Canada | |
| Mexico | |
| United States | |
| Rest Of The North America |
Market Definition
- Vehicle Types - Passenger Vehicles, Commercial Vehicles and Motorcycles are the vehicle types considered under the automotive lubricants market.
- Product Types - For the purpose of this study, lubricant products such as engine oils, transmission oils, greases and hydraulic fluids are taken into consideration.
- Service Refill - Service refill is the primary factor considered while accounting the lubricant consumption for each of the vehicle segments, under the study.
- Factory Fill - First lubricant fill-ups for newly produced vehicles are considered.
Research Methodology
Mordor Intelligence follows a four-step methodology in all our reports.
- Step-1: Identify Key Variables: In order to build a robust forecasting methodology, the variables and factors identified in Step-1 are tested against available historical market numbers. Through an iterative process, the variables required for market forecast are set and the model is built on the basis of these variables.
- Step-2: Build a Market Model: Market-size estimations for the forecast years are in nominal terms. Inflation is not a part of the pricing, and the average selling price (ASP) is kept constant throughout the forecast period for each country.
- Step-3: Validate and Finalize: In this important step, all market numbers, variables and analyst calls are validated through an extensive network of primary research experts from the market studied. The respondents are selected across levels and functions to generate a holistic picture of the market studied.
- Step-4: Research Outputs: Syndicated Reports, Custom Consulting Assignments, Databases & Subscription Platforms


