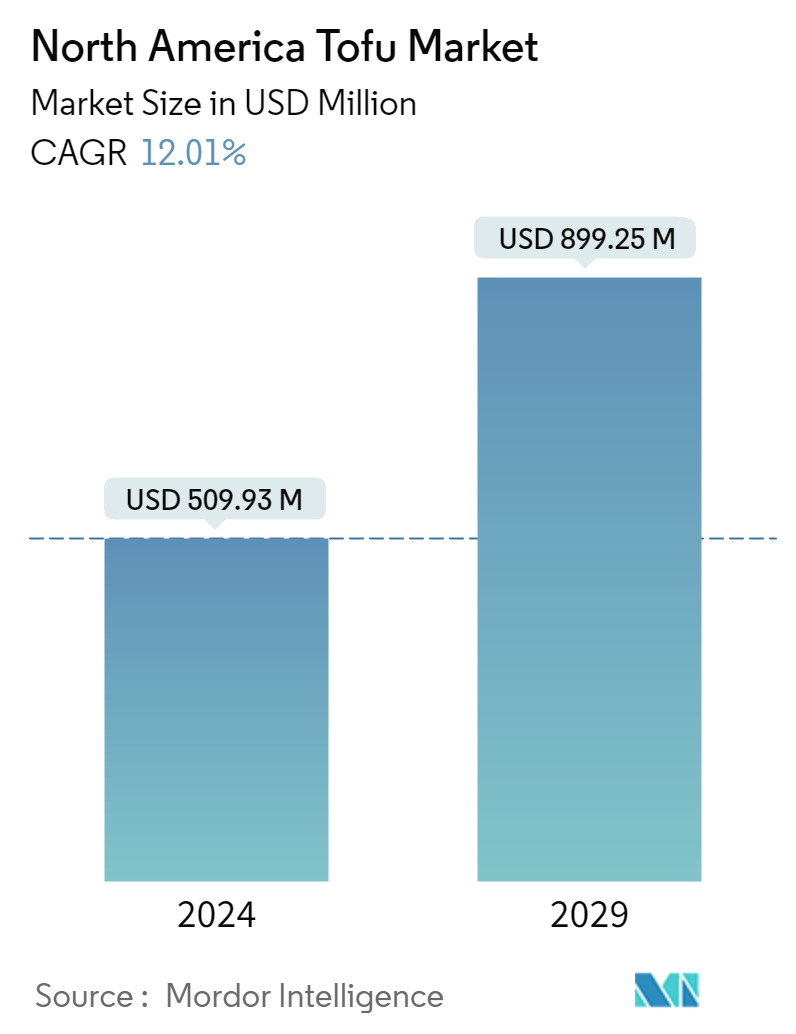
North America Tofu Market Size

| Icons | Lable | Value |
|---|---|---|
|
|
Study Period | 2016 - 2028 |
|
|
Base Year For Estimation | 2021 |
|
|
CAGR | 10.81 % |
|
|
Largest Share by Distribution Channel | Off-Trade |
|
|
Largest Share by Country | United States |
|
|
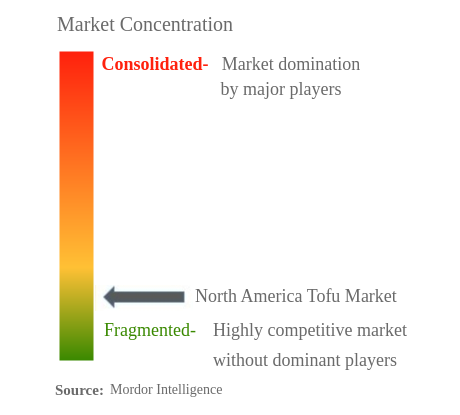
Market Concentration | High |
Major Players |
||
|
|
||
|
*Disclaimer: Major Players sorted in no particular order |
North America Tofu Market Analysis
The North America Tofu Market is projected to register a CAGR of 10.81%
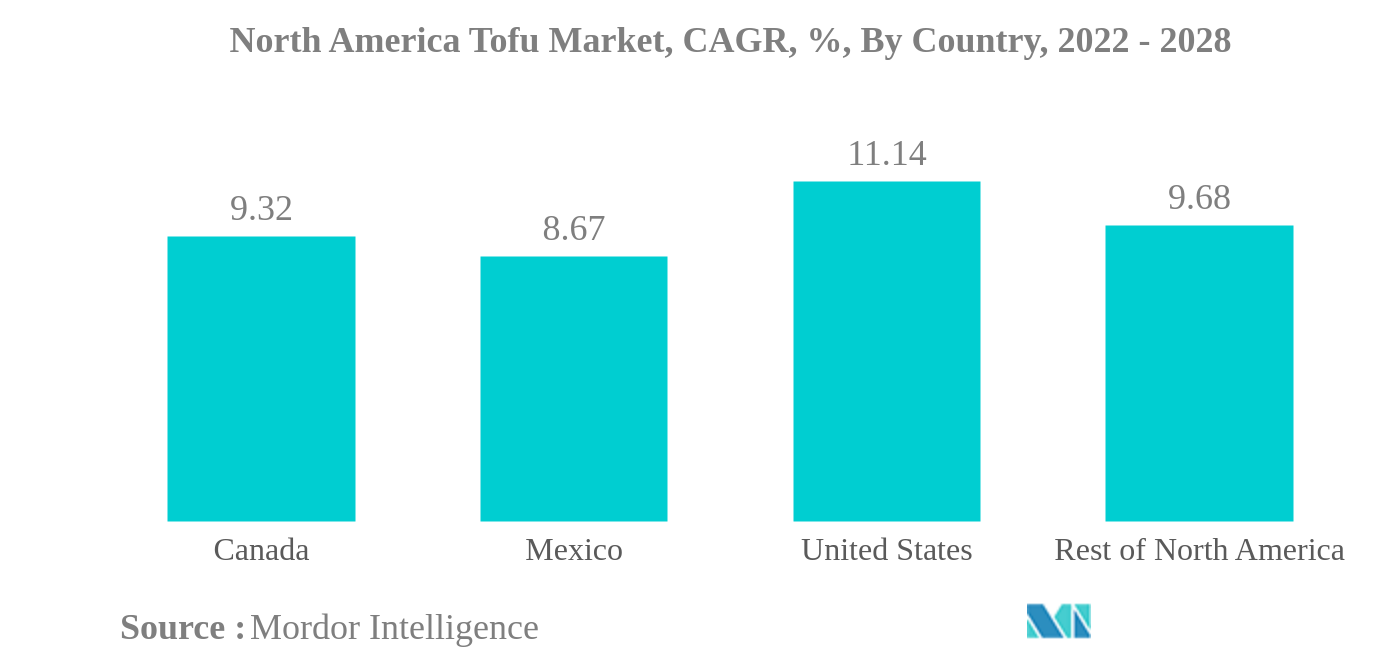
- United States is the Largest Country : The increasing vegan population in the country seeking proteins from healthy meat alternatives like tofu and its variants is driving the segmental growth in the United States.
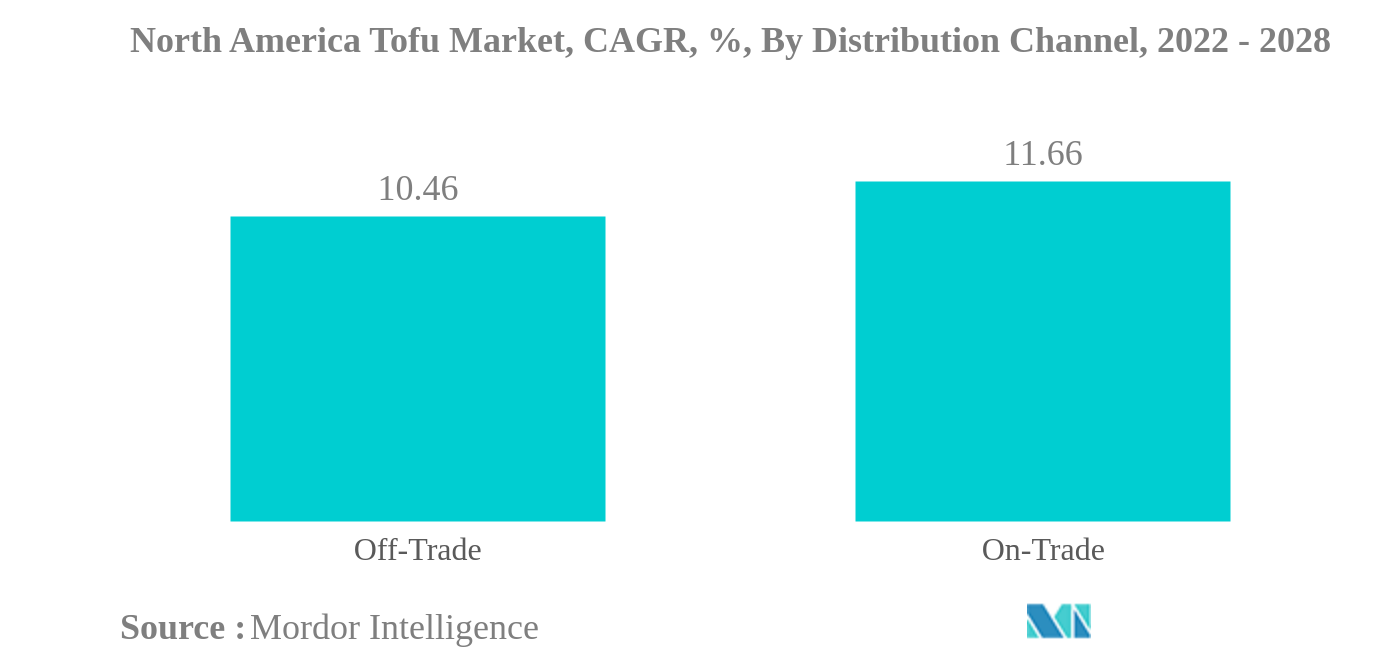
- Off-Trade is the Largest Distribution Channel : Consumers purchasing from supermarkets and hypermarkets is increasing with the wide offerings in the store and the expansion of shelf space for meat substitutes like tofu.
- United States is the Fastest-growing Country : The segment is largely driven by local consumers switching to tofu due to environmental and animal welfare concerns. This led to major growth in the US vegan population.
- On-Trade is the Fastest-growing Distribution Channel : On-trade distribution channel sales of tofu are associated with the region's growing foodservice sector, including vegan restaurants, impacting its bulk purchases.
North America Tofu Market Trends
This section covers the major market trends shaping the North America Tofu Market according to our research experts:
Off-Trade is the largest Distribution Channel
- The off-trade segment dominates the distribution channels of the North American tofu market. In the off-trade segment, the online channel sub-segment is the fastest-growing one, projected to record a CAGR of 11.31% over the forecast period. The growth of e-commerce has allowed businesses to satisfy their customer needs more conveniently and reach a larger addressable market. Customers were buying food and beverage products online due to the pandemic and subsequent nationwide lockdown. The four main e-commerce channels for tofu are direct-to-consumer, click-and-collect, retail grocery delivery, and concierge services.
- The on-trade segment is primarily composed of Asian restaurants and foodservice operators, as well as Asian markets. There are many dishes and preparations in Asian cuisine that include tofu. Asian cuisine is reportedly one of the fastest-growing food trends in the region. So far, in 2022, there are over 68,000 East Asian and Southeast Asian-themed restaurants in the United States. Moreover, a significant number of Asian immigrants reside in North America.
- The on-trade channel is the overall fastest-growing segment, which is projected to record a CAGR of 10.22% from 2022 to 2028. Restaurants and foodservice operators have adapted to include tofu in their offerings, as it is an ideal substitute for meat. Tofu is a very good source of protein, providing a cruelty-free and more eco-friendly option to diet-conscious individuals. The pandemic also caused a decrease in the supply of meat and meat products in retail stores following the closure of numerous abattoirs due to significant COVID-19 outbreaks among personnel. As a result, tofu has become more popular among customers as an adequate substitute and impulse-buy option.
United States is the largest Country
- By country, the United States is the leading market for tofu in the region and is projected to register the fastest CAGR of 12.93% by value during the forecast period. The higher demand is due to higher purchasing power and surging health and environmental awareness. Constant product launches are the key factor promoting the sales of tofu in the country because American consumers are highly open to trying new products.
- The introduction of chickpea-based tofu is trending in the market. Manufacturers like Chikfu and Franklin Farms released chickpea-based tofu in the country in 2020 and 2021, respectively. The launch was made to appeal to consumers who are curious about trying new products, as well as soy-allergic consumers. In the United States, soy-allergic consumers make up less than 0.5% of the general population. These products also come with claims like GMO-free, low-fat, and allergen-free, giving consumers more plant-based options to diversify their diets.
- During the COVID-19 outbreak, due to meat shortage, supermarkets imposed limits on meat purchases. It insisted US consumers explore alternative proteins, such as tofu. Thereby, the sales of tofu in the United States inclined by 11.23% in 2020.
- Canada is the second-leading market for tofu. Governmental support is the primary factor boosting the sales of tofu in the country. The Canadian government has identified plant-based foods as an important and growing industry. Accordingly, in 2018, the government included the plant protein industry in its Supercluster Initiative and made a USD 150 million investment in its development. In 2021, an investment of USD 173 million was made for the same. Thus, the Canadian tofu market is projected to grow with a CAGR of 11.08% during the forecast period.
North America Tofu Industry Overview
The North America Tofu Market is fragmented, with the top five companies occupying 22.16%. The major players in this market are House Foods Group Inc., Keystone Natural Holdings LLC, Morinaga Milk Industry Co. Ltd, Pulmuone Foods USA Inc. and The Hain Celestial Group, Inc. (sorted alphabetically).
North America Tofu Market Leaders
House Foods Group Inc.
Keystone Natural Holdings LLC
Morinaga Milk Industry Co. Ltd
Pulmuone Foods USA Inc.
The Hain Celestial Group, Inc.
*Disclaimer: Major Players sorted in no particular order
North America Tofu Market News
- March 2022: Morinaga Nutritional Foods launched Mori-Nu Yuzu Flavored Silken Tofu, known for its velvety smooth texture. The product has a firm texture, is versatile, and can be added to desserts or blended for preparation.
- November 2021: Morinaga Nutritional Foods Inc. introduced a new product Mori-Nu Plus, which is fortified tofu with added protein, vitamin D, and calcium. It is available through direct-to-consumer channels.
- July 2021: Pulmoune Foods launched its hot-selling "Tofu Noodles" in Singapore, Australia, and New Zealand.
North America Tofu Market Report - Table of Contents
1. INTRODUCTION
1.1. Study Assumptions & Market Definition
1.2. Scope of the Study
1.3. Research Methodology
2. KEY INDUSTRY TRENDS
2.1. Price Trends
2.2. Regulatory Framework
2.3. Value Chain & Distribution Channel Analysis
3. MARKET SEGMENTATION
3.1. Distribution Channel
3.1.1. Off-Trade
3.1.1.1. Convenience Stores
3.1.1.2. Online Channel
3.1.1.3. Supermarkets And Hypermarkets
3.1.1.4. Others
3.1.2. On-Trade
3.2. Country
3.2.1. Canada
3.2.2. Mexico
3.2.3. United States
3.2.4. Rest Of North America
4. COMPETITIVE LANDSCAPE
4.1. Key Strategic Moves
4.2. Market Share Analysis
4.3. Company Landscape
4.4. Company Profiles
4.4.1. AFC American Food Company
4.4.2. House Foods Group Inc.
4.4.3. Keystone Natural Holdings LLC
4.4.4. Morinaga Milk Industry Co. Ltd
4.4.5. Pulmuone Foods USA Inc.
4.4.6. The Hain Celestial Group, Inc.
4.4.7. Turtle Island Foods Inc.
5. KEY STRATEGIC QUESTIONS FOR MEAT SUBSTITUTES INDUSTRY CEOS
6. APPENDIX
6.1. Global Overview
6.1.1. Overview
6.1.2. Porter’s Five Forces Framework
6.1.3. Global Value Chain Analysis
6.1.4. Market Dynamics (DROs)
6.2. Sources & References
6.3. List of Tables & Figures
6.4. Primary Insights
6.5. Data Pack
6.6. Glossary of Terms
List of Tables & Figures
- Figure 1:
- NORTH AMERICA TOFU MARKET, TOFU, PRICE IN USD/METRIC TONNES, 2016 - 2022
- Figure 2:
- NORTH AMERICA TOFU MARKET, VOLUME, METRIC TONNES, 2016 - 2028
- Figure 3:
- NORTH AMERICA TOFU MARKET, VALUE, USD, 2016 - 2028
- Figure 4:
- NORTH AMERICA TOFU MARKET, VOLUME IN METRIC TONNES, BY DISTRIBUTION CHANNEL, 2016 - 2028
- Figure 5:
- NORTH AMERICA TOFU MARKET, VALUE IN USD, BY DISTRIBUTION CHANNEL, 2016 - 2028
- Figure 6:
- NORTH AMERICA TOFU MARKET, VOLUME SHARE (%), BY DISTRIBUTION CHANNEL, 2016 VS 2022 VS 2028
- Figure 7:
- NORTH AMERICA TOFU MARKET, VALUE SHARE (%), BY DISTRIBUTION CHANNEL, 2016 VS 2022 VS 2028
- Figure 8:
- NORTH AMERICA TOFU MARKET, VOLUME IN METRIC TONNES, BY OFF-TRADE, 2016 - 2028
- Figure 9:
- NORTH AMERICA TOFU MARKET, VALUE IN USD, BY OFF-TRADE, 2016 - 2028
- Figure 10:
- NORTH AMERICA TOFU MARKET, VOLUME SHARE (%), BY OFF-TRADE, 2016 VS 2022 VS 2028
- Figure 11:
- NORTH AMERICA TOFU MARKET, VALUE SHARE (%), BY OFF-TRADE, 2016 VS 2022 VS 2028
- Figure 12:
- NORTH AMERICA TOFU MARKET, VOLUME IN METRIC TONNES, CONVENIENCE STORES, 2016 - 2028
- Figure 13:
- NORTH AMERICA TOFU MARKET, VALUE IN USD, CONVENIENCE STORES, 2016 - 2028
- Figure 14:
- NORTH AMERICA TOFU MARKET, CONVENIENCE STORES, VALUE SHARE (%), BY COUNTRY, 2021 VS 2028
- Figure 15:
- NORTH AMERICA TOFU MARKET, VOLUME IN METRIC TONNES, ONLINE CHANNEL, 2016 - 2028
- Figure 16:
- NORTH AMERICA TOFU MARKET, VALUE IN USD, ONLINE CHANNEL, 2016 - 2028
- Figure 17:
- NORTH AMERICA TOFU MARKET, ONLINE CHANNEL, VALUE SHARE (%), BY COUNTRY, 2021 VS 2028
- Figure 18:
- NORTH AMERICA TOFU MARKET, VOLUME IN METRIC TONNES, SUPERMARKETS AND HYPERMARKETS, 2016 - 2028
- Figure 19:
- NORTH AMERICA TOFU MARKET, VALUE IN USD, SUPERMARKETS AND HYPERMARKETS, 2016 - 2028
- Figure 20:
- NORTH AMERICA TOFU MARKET, SUPERMARKETS AND HYPERMARKETS, VALUE SHARE (%), BY COUNTRY, 2021 VS 2028
- Figure 21:
- NORTH AMERICA TOFU MARKET, VOLUME IN METRIC TONNES, OTHERS, 2016 - 2028
- Figure 22:
- NORTH AMERICA TOFU MARKET, VALUE IN USD, OTHERS, 2016 - 2028
- Figure 23:
- NORTH AMERICA TOFU MARKET, OTHERS, VALUE SHARE (%), BY COUNTRY, 2021 VS 2028
- Figure 24:
- NORTH AMERICA TOFU MARKET, VOLUME IN METRIC TONNES, ON-TRADE, 2016 - 2028
- Figure 25:
- NORTH AMERICA TOFU MARKET, VALUE IN USD, ON-TRADE, 2016 - 2028
- Figure 26:
- NORTH AMERICA TOFU MARKET, VOLUME IN METRIC TONNES, BY COUNTRY, 2016 - 2028
- Figure 27:
- NORTH AMERICA TOFU MARKET, VALUE IN USD, BY COUNTRY, 2016 - 2028
- Figure 28:
- NORTH AMERICA TOFU MARKET, VOLUME SHARE (%), BY COUNTRY, 2016 VS 2022 VS 2028
- Figure 29:
- NORTH AMERICA TOFU MARKET, VOLUME SHARE (%), BY COUNTRY, 2016 VS 2022 VS 2028
- Figure 30:
- NORTH AMERICA TOFU MARKET, VOLUME IN METRIC TONNES, CANADA, 2016 - 2028
- Figure 31:
- NORTH AMERICA TOFU MARKET, VALUE IN USD, CANADA, 2016 - 2028
- Figure 32:
- NORTH AMERICA TOFU MARKET, CANADA, VALUE SHARE (%), BY DISTRIBUTION CHANNEL, 2021 VS 2028
- Figure 33:
- NORTH AMERICA TOFU MARKET, VOLUME IN METRIC TONNES, MEXICO, 2016 - 2028
- Figure 34:
- NORTH AMERICA TOFU MARKET, VALUE IN USD, MEXICO, 2016 - 2028
- Figure 35:
- NORTH AMERICA TOFU MARKET, MEXICO, VALUE SHARE (%), BY DISTRIBUTION CHANNEL, 2021 VS 2028
- Figure 36:
- NORTH AMERICA TOFU MARKET, VOLUME IN METRIC TONNES, UNITED STATES, 2016 - 2028
- Figure 37:
- NORTH AMERICA TOFU MARKET, VALUE IN USD, UNITED STATES, 2016 - 2028
- Figure 38:
- NORTH AMERICA TOFU MARKET, UNITED STATES, VALUE SHARE (%), BY DISTRIBUTION CHANNEL, 2021 VS 2028
- Figure 39:
- NORTH AMERICA TOFU MARKET, VOLUME IN METRIC TONNES, REST OF NORTH AMERICA, 2016 - 2028
- Figure 40:
- NORTH AMERICA TOFU MARKET, VALUE IN USD, REST OF NORTH AMERICA, 2016 - 2028
- Figure 41:
- NORTH AMERICA TOFU MARKET, REST OF NORTH AMERICA, VALUE SHARE (%), BY DISTRIBUTION CHANNEL, 2021 VS 2028
- Figure 42:
- NORTH AMERICA TOFU MARKET, MOST ACTIVE COMPANIES, BY NUMBER OF STRATEGIC MOVES, 2017 - 2022
- Figure 43:
- NORTH AMERICA TOFU MARKET, TOTAL NUMBER OF STRATEGIC MOVES, 2017 - 2022
- Figure 44:
- NORTH AMERICA TOFU MARKET SHARE(%), BY KEY PLAYERS, 2021
North America Tofu Industry Segmentation
Off-Trade, On-Trade are covered as segments by Distribution Channel. Canada, Mexico, United States are covered as segments by Country.| Distribution Channel | ||||||
| ||||||
| On-Trade |
| Country | |
| Canada | |
| Mexico | |
| United States | |
| Rest Of North America |
Market Definition
- Meat Substitutes - It is a food product made from vegetarian or vegan ingredients, eaten as a replacement for meat. Meat substitutes typically approximate qualities of specific types of meat, such as mouthfeel, flavor, appearance, or chemical characteristics.
- Tempeh - It is a high protein Asian food prepared by fermenting soybeans with a Rhizopus.
- Textured Vegetable Protein - Food items made from consumable protein sources like soybean, pea, wheat, hemp, etc., are known as textured vegetable proteins. Each unit will withstand hydration during cooking and other processes used in preparing the food for consumption because it has structural integrity and a distinguishable texture.
- Tofu - Tofu is a soft food product prepared by treating soybean milk with coagulants.
Research Methodology
Mordor Intelligence follows a four-step methodology in all our reports.
- Step-1: Identify Key Variables: In order to build a robust forecasting methodology, the variables and factors identified in Step 1 are tested against available historical market numbers. Through an iterative process, the variables required for market forecast are set, and the model is built on the basis of these variables.
- Step-2: Build a Market Model: Market-size estimations for the forecast years are in nominal terms. Inflation is not a part of the pricing, and the average selling price (ASP) is kept constant throughout the forecast period for each country.
- Step-3: Validate and Finalize: In this important step, all market numbers, variables, and analyst calls are validated through an extensive network of primary research experts from the market studied. The respondents are selected across levels and functions to generate a holistic picture of the market studied.
- Step-4: Research Outputs: Syndicated Reports, Custom Consulting Assignments, Databases & Subscription Platforms


