Poland Data Center Market Size

| Icons | Lable | Value |
|---|---|---|
|
|
Study Period | 2017 - 2029 |
|
|
Base Year For Estimation | 2022 |
|
|
CAGR | 15.10 % |
|
|
Largest Share by Tier Type | Tier 3 |
|
|
Fastest Growing by Tier Type | Tier 4 |
|
|
Market Concentration | High |
Major Players |
||
|
|
||
|
*Disclaimer: Major Players sorted in no particular order |
Poland Data Center Market Analysis
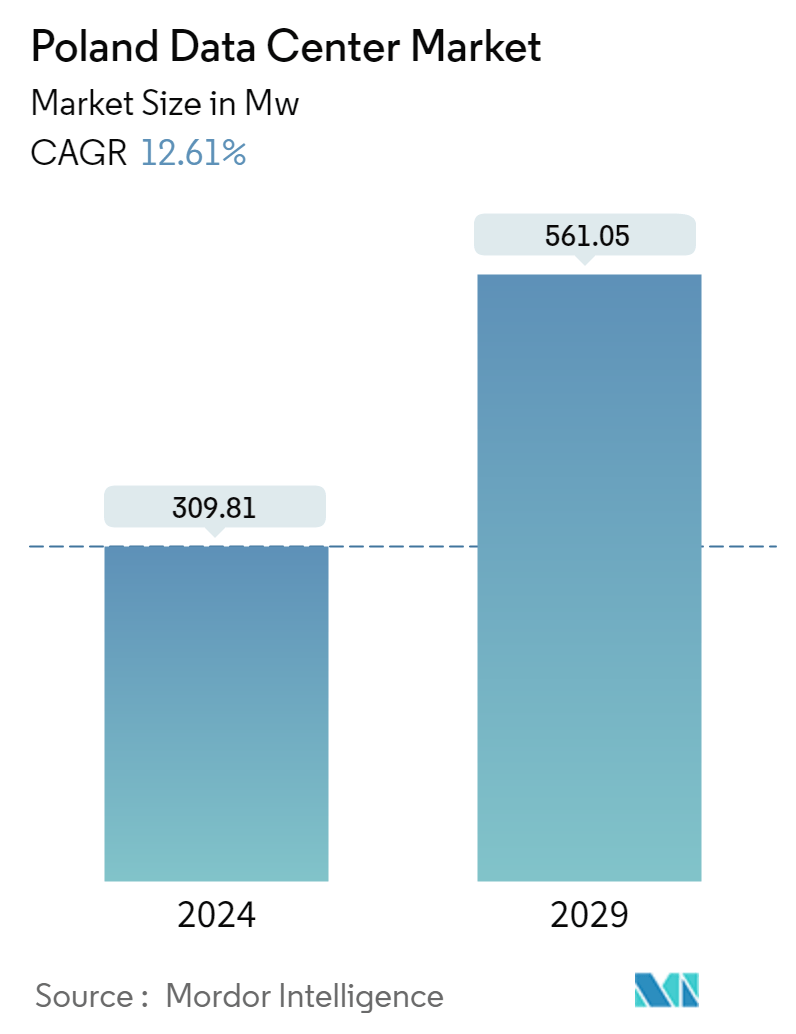
The Poland Data Center Market is projected to register a CAGR of 15.10%
- IT Load Capacity: The IT load capacity of the Polish data center market may grow steadily and reach 561 MW by 2029.
- Raised Floor Space: The country's total raised floor area is expected to reach 3.7 million sq. ft by 2029.
- Installed Racks: The country's total number of installed racks may reach 187,016 units by 2029. Warsaw is expected to house the maximum number of racks by 2029.
- DC Facilities: The growing number of ICT businesses, rising demand for online shopping, and increasing OTT content and mobile applications have contributed to the growing data consumption. Thus, the country's data centers are majorly operating with tier 3 facilities, gradually inclined toward tier 4 DC standards.
- Leading Market Player: Atman Sp. z.o.o currently leads the Polish market. With the completion of its Warsaw 3 facility, its IT load capacity is expected to reach 116.5 MW in the future, thus strengthening its presence in the Polish data center market.
Poland Data Center Market Trends
This section covers the major market trends shaping the Poland Data Center Market according to our research experts:
Tier 3 is the largest Tier Type
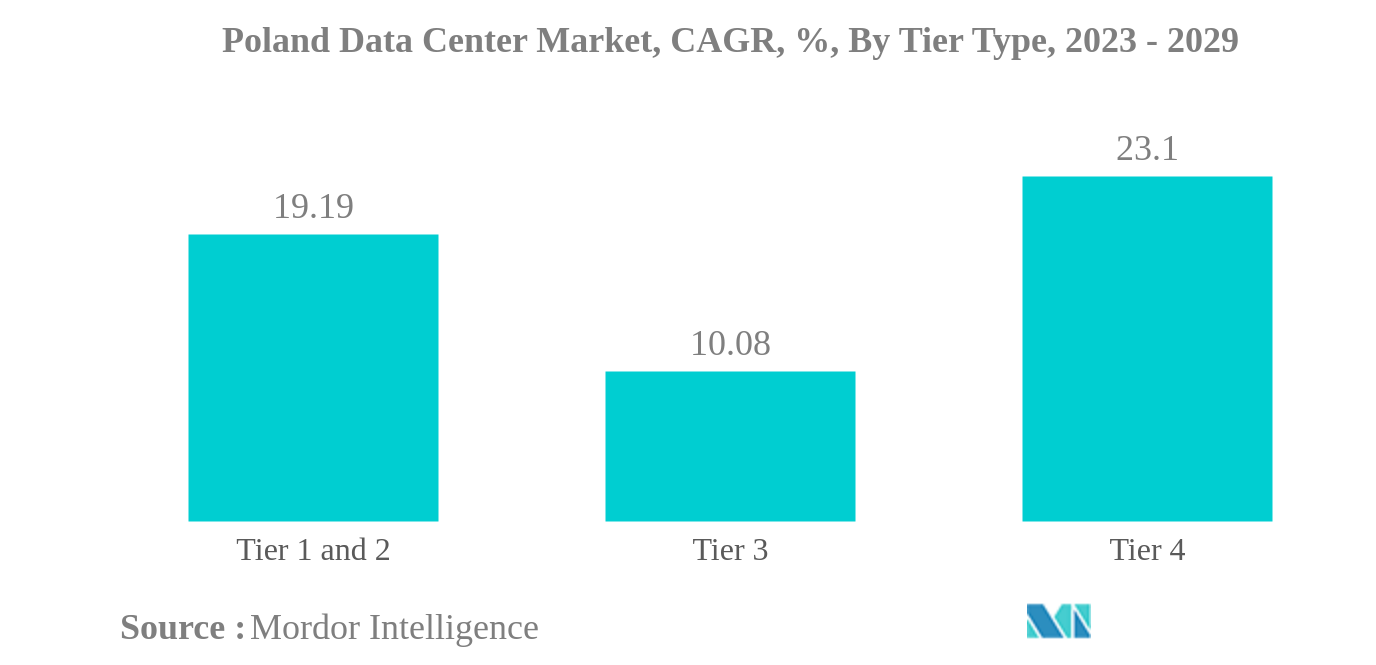
- Tier 4 data centers lead the market in terms of tier capacity. Tier 4 data centers are expected to increase from 65.2 MW in 2023 to 226.7 MW by 2029 while recording a CAGR of 23.1%. The initial data centers constructed were small and had basic infrastructure facilities. These facilities were Tier 1&2, which served a minimal purpose and had fewer racks. Growing demand for smartphone applications by Polish users for various digitized services has led companies to opt for data centers housing more racks, better infrastructure facilities, better bandwidths, and lower downtime. This led the IT load capacity to increase from 23 MW in 2017 to 65.2 MW in 2023.
- Tier 1&2 facilities witnessed a steady demand over the years and are expected to see steady growth over the coming years as well. Tier 1&2 facilities held a market share of 8% in 2017 and are expected to hold an 8% share in 2023 and 9% in 2029. On the other hand, the demand for Tier 4 facilities has gained traction as its market share increased gradually from 12.9% in 2017. It is expected to reach 26.8% and 37.7% in 2023 and 2029, respectively.
- Nearly 24 facilities are configured under Tier 3 standards, which are majorly preferred by small, medium, and large data center facilities. Of these 24 facilities, 11 of them are located in Warsaw, which is one of the prime hotspots for data center facilities as it is the economic capital of the country.
- The development of smart cities and connected network solutions have triggered the adoption of Tier 4 facilities. For instance, Tychy recently implemented a new intelligent transport system (ITS) that would help Poland monitor real-time traffic. Thus, to facilitate uninterrupted vigilance with assured uptime to process these huge amounts of data, Tier 3 and Tier 4 data center facilities are expected to grow proportionally.
Poland Data Center Industry Overview
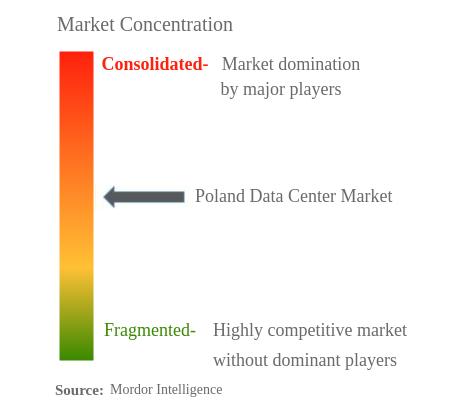
The Poland Data Center Market is moderately consolidated, with the top five companies occupying 63.42%. The major players in this market are Atman sp. Z o.o., Beyond.pl Sp. z o. o., Equinix, Inc., Exea Sp. z o.o and Polcom S.A. (sorted alphabetically).
Poland Data Center Market Leaders
Atman sp. Z o.o.
Beyond.pl Sp. z o. o.
Equinix, Inc.
Exea Sp. z o.o
Polcom S.A.
*Disclaimer: Major Players sorted in no particular order
Poland Data Center Market News
- December 2022: Atman purchased land, the 5.5-hectare site in Duchnice near Ożarów Mazowiecki, to build another data center. The Atman Data Center Warsaw-3 campus was scheduled to open in Q4 2024 with a target IT capacity of 43 MW.
- August 2022: A new colocation facility would expand Atman Data Center Warsaw-1. The F7 building would have a dedicated power capacity of 7.2 MW for customers’ IT equipment. The new server rooms of 2,916 sq. m were planned to be commissioned in February 2024.
- June 2022: Vantage completed the first facility on its 12-acre (five-hectare) Warsaw campus. Once fully developed, the two-data center campus would offer 48MW of critical IT capacity across 390,000 square feet (36,000 square meters).
Poland Data Center Market Report - Table of Contents
1. INTRODUCTION
1.1. Study Assumptions & Market Definition
1.2. Scope of the Study
1.3. Research Methodology
2. MARKET OUTLOOK
2.1. IT Load Capacity
2.2. Raised Floor Space
2.3. Colocation Revenue
2.4. Installed Racks
2.5. Rack Space Utilization
2.6. Submarine Cable
3. KEY INDUSTRY TRENDS
3.1. Smartphone Users
3.2. Data Traffic Per Smartphone
3.3. Mobile Data Speed
3.4. Broadband Data Speed
3.5. Fiber Connectivity Network
3.6. Regulatory Framework
3.7. Value Chain & Distribution Channel Analysis
4. MARKET SEGMENTATION
4.1. Hotspot
4.1.1. Warsaw
4.1.2. Rest of Poland
4.2. Data Center Size
4.2.1. Large
4.2.2. Massive
4.2.3. Medium
4.2.4. Mega
4.2.5. Small
4.3. Tier Type
4.3.1. Tier 1 and 2
4.3.2. Tier 3
4.3.3. Tier 4
4.4. Absorption
4.4.1. Non-Utilized
4.4.2. Utilized
4.4.2.1. By Colocation Type
4.4.2.1.1. Hyperscale
4.4.2.1.2. Retail
4.4.2.1.3. Wholesale
4.4.2.2. By End User
4.4.2.2.1. BFSI
4.4.2.2.2. Cloud
4.4.2.2.3. E-Commerce
4.4.2.2.4. Government
4.4.2.2.5. Manufacturing
4.4.2.2.6. Media & Entertainment
4.4.2.2.7. Telecom
4.4.2.2.8. Other End User
5. COMPETITIVE LANDSCAPE
5.1. Market Share Analysis
5.2. Company Landscape
5.3. Company Profiles
5.3.1. 3S Data Center SA (P4 sp. z o.o.)
5.3.2. Atman sp. Z o.o.
5.3.3. Beyond.pl Sp. z o. o.
5.3.4. Comarch S.A.
5.3.5. Deutsche Telekom AG (T-Mobile Poska SA)
5.3.6. Equinix, Inc.
5.3.7. Exea Sp. z o.o
5.3.8. LIMDC
5.3.9. Polcom S.A.
5.3.10. S-NET Sp. z o. o. (TOYA Group)
5.3.11. Sinersio Polska Sp. z o
5.3.12. Vantage Data Centers, LLC
5.4. LIST OF COMPANIES STUDIED
6. KEY STRATEGIC QUESTIONS FOR DATA CENTER CEOS
7. APPENDIX
7.1. Global Overview
7.1.1. Overview
7.1.2. Porter’s Five Forces Framework
7.1.3. Global Value Chain Analysis
7.1.4. Global Market Size and DROs
7.2. Sources & References
7.3. List of Tables & Figures
7.4. Primary Insights
7.5. Data Pack
7.6. Glossary of Terms
List of Tables & Figures
- Figure 1:
- POLAND DATA CENTER MARKET, IT LOAD CAPACITY, VOLUME IN MW, 2017 - 2029
- Figure 2:
- POLAND DATA CENTER MARKET, RAISED FLOOR SPACE, VOLUME IN SQ. FT.(000'), 2017 - 2029
- Figure 3:
- POLAND DATA CENTER MARKET, COLOCATION REVENUE, VALUE IN USD MILLION, 2017 - 2029
- Figure 4:
- POLAND DATA CENTER MARKET, INSTALLED RACKS, VALUE IN UNIT, 2017 - 2029
- Figure 5:
- POLAND DATA CENTER MARKET, RACK SPACE UTILIZATION, VALUE IN (%), 2017 - 2029
- Figure 6:
- POLAND DATA CENTER MARKET, SMARTPHONE USERS, VOLUME IN MILLION, 2017 - 2029
- Figure 7:
- POLAND DATA CENTER MARKET, DATA TRAFFIC PER SMARTPHONE, VOLUME IN GB, 2017 - 2029
- Figure 8:
- POLAND DATA CENTER MARKET, MOBILE DATA SPEED, VOLUME IN MBPS, 2017 - 2029
- Figure 9:
- POLAND DATA CENTER MARKET, BROADBAND SPEED, VOLUME IN MBPS, 2017 - 2029
- Figure 10:
- POLAND DATA CENTER MARKET, FIBER CONNECTIVITY NETWORK, VOLUME IN KILOMETER, 2017 - 2029
- Figure 11:
- POLAND DATA CENTER MARKET, VOLUME, MW, 2017 - 2029
- Figure 12:
- POLAND DATA CENTER MARKET, BY HOTSPOT, VOLUME IN MW, 2017 - 2029
- Figure 13:
- POLAND DATA CENTER MARKET, SHARE(%), BY HOTSPOT, 2017 - 2023 - 2029
- Figure 14:
- POLAND DATA CENTER MARKET, WARSAW, VOLUME IN MW, 2017 - 2029
- Figure 15:
- POLAND DATA CENTER MARKET, BY DATA CENTER SIZE, WARSAW, VOLUME SHARE (%), 2022 - 2029
- Figure 16:
- POLAND DATA CENTER MARKET, REST OF POLAND, VOLUME IN MW, 2017 - 2029
- Figure 17:
- POLAND DATA CENTER MARKET, BY DATA CENTER SIZE, REST OF POLAND, VOLUME SHARE (%), 2022 - 2029
- Figure 18:
- POLAND DATA CENTER MARKET, BY DATA CENTER SIZE, VOLUME IN MW, 2017 - 2029
- Figure 19:
- POLAND DATA CENTER MARKET, SHARE(%), BY DATA CENTER SIZE, 2017 - 2023 - 2029
- Figure 20:
- POLAND DATA CENTER MARKET, LARGE, VOLUME IN MW, 2017 - 2029
- Figure 21:
- POLAND DATA CENTER MARKET, MASSIVE, VOLUME IN MW, 2017 - 2029
- Figure 22:
- POLAND DATA CENTER MARKET, MEDIUM, VOLUME IN MW, 2017 - 2029
- Figure 23:
- POLAND DATA CENTER MARKET, MEGA, VOLUME IN MW, 2017 - 2029
- Figure 24:
- POLAND DATA CENTER MARKET, SMALL, VOLUME IN MW, 2017 - 2029
- Figure 25:
- POLAND DATA CENTER MARKET, BY TIER TYPE, VOLUME IN MW, 2017 - 2029
- Figure 26:
- POLAND DATA CENTER MARKET, SHARE(%), BY TIER TYPE, 2017 - 2023 - 2029
- Figure 27:
- POLAND DATA CENTER MARKET, TIER 1&2, VOLUME IN MW, 2017 - 2029
- Figure 28:
- POLAND DATA CENTER MARKET, TIER 3, VOLUME IN MW, 2017 - 2029
- Figure 29:
- POLAND DATA CENTER MARKET, TIER 4, VOLUME IN MW, 2017 - 2029
- Figure 30:
- POLAND DATA CENTER MARKET, BY ABSORPTION, VOLUME IN MW, 2017 - 2029
- Figure 31:
- POLAND DATA CENTER MARKET, SHARE(%), BY ABSORPTION, 2017 - 2023 - 2029
- Figure 32:
- POLAND DATA CENTER MARKET, NON-UTILIZED, VOLUME IN MW, 2017 - 2029
- Figure 33:
- POLAND DATA CENTER MARKET, BY COLOCATION TYPE, VOLUME IN MW, 2017 - 2029
- Figure 34:
- POLAND DATA CENTER MARKET, SHARE(%), BY COLOCATION TYPE, 2017 - 2023 - 2029
- Figure 35:
- POLAND DATA CENTER MARKET, HYPERSCALE, VOLUME IN MW, 2017 - 2029
- Figure 36:
- POLAND DATA CENTER MARKET, RETAIL, VOLUME IN MW, 2017 - 2029
- Figure 37:
- POLAND DATA CENTER MARKET, WHOLESALE, VOLUME IN MW, 2017 - 2029
- Figure 38:
- POLAND DATA CENTER MARKET, BY END USER, VOLUME IN MW, 2017 - 2029
- Figure 39:
- POLAND DATA CENTER MARKET, SHARE(%), BY END USER, 2017 - 2023 - 2029
- Figure 40:
- POLAND DATA CENTER MARKET, BFSI, VOLUME IN MW, 2017 - 2029
- Figure 41:
- POLAND DATA CENTER MARKET, CLOUD, VOLUME IN MW, 2017 - 2029
- Figure 42:
- POLAND DATA CENTER MARKET, E-COMMERCE, VOLUME IN MW, 2017 - 2029
- Figure 43:
- POLAND DATA CENTER MARKET, GOVERNMENT, VOLUME IN MW, 2017 - 2029
- Figure 44:
- POLAND DATA CENTER MARKET, MANUFACTURING, VOLUME IN MW, 2017 - 2029
- Figure 45:
- POLAND DATA CENTER MARKET, MEDIA & ENTERTAINMENT, VOLUME IN MW, 2017 - 2029
- Figure 46:
- POLAND DATA CENTER MARKET, TELECOM, VOLUME IN MW, 2017 - 2029
- Figure 47:
- POLAND DATA CENTER MARKET, OTHER END USER, VOLUME IN MW, 2017 - 2029
- Figure 48:
- POLAND DATA CENTER MARKET, BY MAJOR PLAYER IT LOAD CAPACITY, 2022
Poland Data Center Industry Segmentation
Warsaw are covered as segments by Hotspot. Large, Massive, Medium, Mega, Small are covered as segments by Data Center Size. Tier 1 and 2, Tier 3, Tier 4 are covered as segments by Tier Type. Non-Utilized, Utilized are covered as segments by Absorption.| Hotspot | |
| Warsaw | |
| Rest of Poland |
| Data Center Size | |
| Large | |
| Massive | |
| Medium | |
| Mega | |
| Small |
| Tier Type | |
| Tier 1 and 2 | |
| Tier 3 | |
| Tier 4 |
| Absorption | |||||||||||||||||
| Non-Utilized | |||||||||||||||||
|
Market Definition
- IT LOAD CAPACITY - The IT load capacity or installed capacity, refers to the amount of energy consumed by servers and network equipments placed in a rack installed. It is measured in megawatt (MW).
- ABSORPTION RATE - It denotes the extend to which the data center capacity has been leased out. For instance, a 100 MW DC has leased out 75 MW, then absorption rate would be 75%. It is also referred as utilization rate and leased-out capacity.
- RAISED FLOOR SPACE - It is an elevated space build over the floor. This gap between the original floor and the elevated floor is used to accommodate wiring, cooling, and other data center equipment. This arrangement assist in having proper wiring and cooling infrastructure. It is measured in square feet (ft^2).
- DATA CENTER SIZE - Data Center Size is segmented based on the raised floor space allocated to the data center facilities. Mega DC - # of Racks must be more than 9000 or RFS (raised floor space) must be more than 225001 Sq. ft; Massive DC - # of Racks must be in between 9000 and 3001 or RFS must be in between 225000 Sq. ft and 75001 Sq. ft; Large DC - # of Racks must be in between 3000 and 801 or RFS must be in between 75000 Sq. ft and 20001 Sq. ft; Medium DC # of Racks must be in between 800 and 201 or RFS must be in between 20000 Sq. ft and 5001 Sq. ft; Small DC - # of Racks must be less than 200 or RFS must be less than 5000 Sq. ft.
- TIER TYPE - According to Uptime Institute the data centers are classified into four tiers based on the proficiencies of redundant equipment of the data center infrastructure. In this segment the data center are segmented as Tier 1,Tier 2, Tier 3 and Tier 4.
- COLOCATION TYPE - The segment is segregated into 3 categories namely Retail, Wholesale and Hyperscale Colocation service. The categorization is done based on the amount of IT load leased out to potential customers. Retail colocation service has leased capacity less than 250 kW; Wholesale colocation services has leased capacity between 251 kW and 4 MW and Hyperscale colocation services has leased capacity more than 4 MW.
- END CONSUMERS - The Data Center Market operates on a B2B basis. BFSI, Government, Cloud Operators, Media and Entertainment, E-Commerce, Telecom and Manufacturing are the major end-consumers in the market studied. The scope only includes colocation service operators catering to the increasing digitalization of the end-user industries.
Research Methodology
Mordor Intelligence follows a four-step methodology in all our reports.
- Step-1: Identify Key Variables: In order to build a robust forecasting methodology, the variables and factors identified in Step-1 are tested against available historical market numbers. Through an iterative process, the variables required for market forecast are set and the model is built on the basis of these variables.
- Step-2: Build a Market Model: Market-size estimations for the forecast years are in nominal terms. Inflation is not a part of the pricing, and the average selling price (ASP) is kept constant throughout the forecast period for each country.
- Step-3: Validate and Finalize: In this important step, all market numbers, variables and analyst calls are validated through an extensive network of primary research experts from the market studied. The respondents are selected across levels and functions to generate a holistic picture of the market studied.
- Step-4: Research Outputs: Syndicated Reports, Custom Consulting Assignments, Databases & Subscription Platforms


