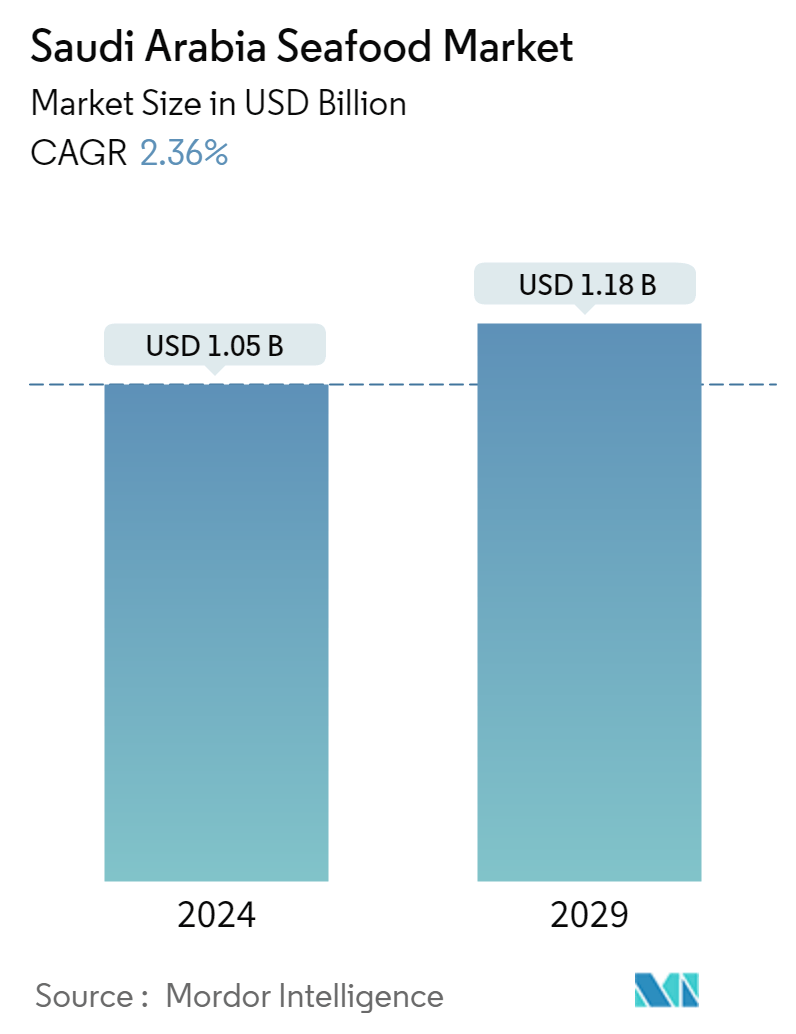
Saudi Arabia Seafood Market Size

| Icons | Lable | Value |
|---|---|---|
|
|
Study Period | 2016 - 2028 |
|
|
Base Year For Estimation | 2021 |
|
|
CAGR | 2.02 % |
|
|
Largest Share by Type | Fish |
|
|
Fastest Growing by Type | Fish |
|
|
Market Concentration | High |
Major Players |
||
|
|
||
|
*Disclaimer: Major Players sorted in no particular order |
Saudi Arabia Seafood Market Analysis
The Saudi Arabia Seafood Market is projected to register a CAGR of 2.02%
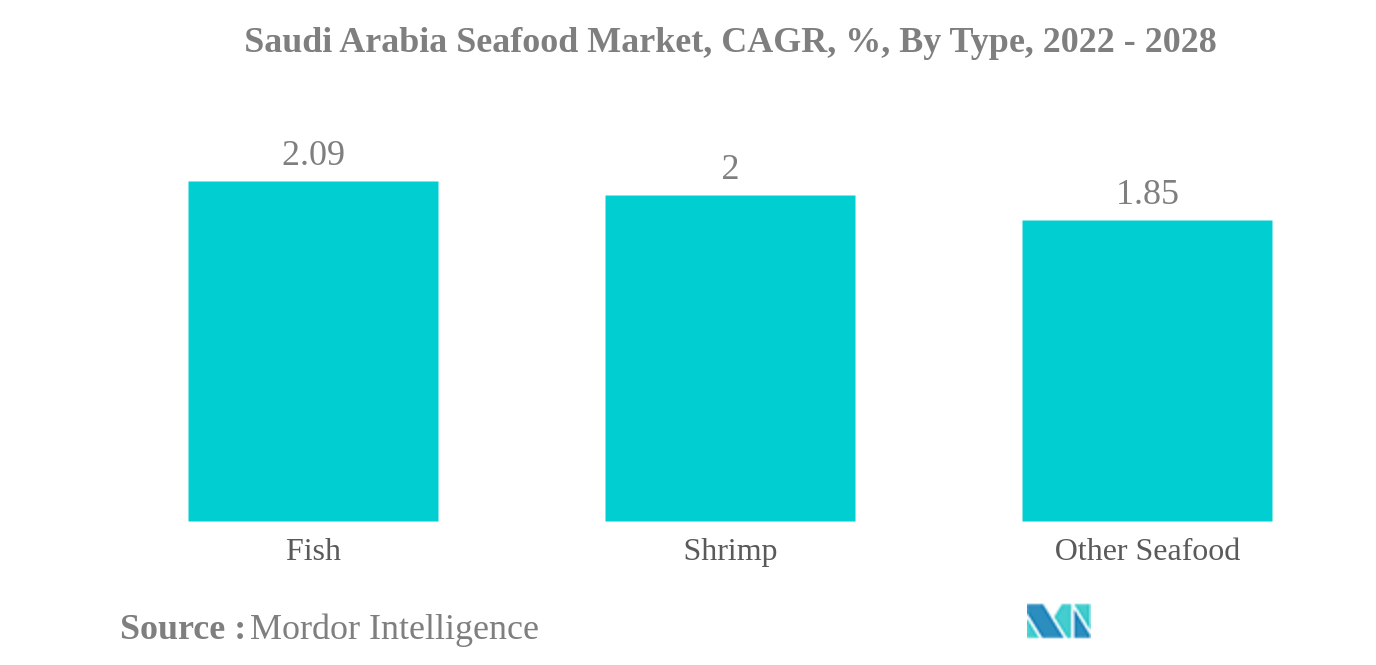
- Fish is the Largest Type: The country's demand for fish is fueled by a range of factors, including fish's lower price, greater nutritional value, and ease of availability due to increased production.
- Fresh / Chilled is the Largest Form: Local consumers choose wild-caught as they believe it to be more natural, fresh, delicious, and healthy. The demand rose considerably after the relaxation of the lockdown.
- Fish is the Fastest-growing Type: The fast projected growth in fish consumption is led by surging awareness regarding its health benefits like its abundance in omega-3 fatty acids and vitamins D and B2.
- Frozen / Canned is the Fastest-growing Form: The country being highly dependent on imports of seafood drives the demand for frozen/canned seafood owing to its better shelf life and easy transportation to the country.
Saudi Arabia Seafood Market Trends
This section covers the major market trends shaping the Saudi Arabia Seafood Market according to our research experts:
Fish is the largest Type
- In 2018, Saudi Arabia's seafood market observed a major decline of 5.61% in value compared to the previous year, primarily due to a reduction in the country's fish production, which also declined by 4% in 2018 over 2017. Seafood production, including fish, declined in 2018 due to the government's attempt to prevent overfishing and rationalize the fishing fleet to maintain sustainability in the aquaculture sector.
- Fish is the most consumed seafood type in the Saudi Arabian seafood market. In 2021, the sales value of fish increased by 5.64%. The increasing domestic consumption of fish is driven by an increasing population keen on pursuing healthy lifestyles and diets. This factor continues to drive Saudi Arabia’s seafood market. Fish has the highest per capita consumption in the country, recorded at 8.07 kg in 2021, as compared to shrimp and other seafood. Hence, fish is the major seafood consumed across the country.
- Shrimp is the fastest-growing segment of the Saudi Arabian seafood market. It is projected to reach a CAGR of 2.0% during the forecast period (2022-2028). There is a growing demand for sustainably farmed shrimp among Saudi consumers. Thus, the country is producing shrimp in inland waters on a commercial scale using the closed system in the Tabuk region. The shrimp cultivation method in Saudi Arabia is considered one of the largest aquaculture programs in the Middle East. Therefore, considering all these factors, shrimp demand is likely to grow in the future.
Saudi Arabia Seafood Industry Overview
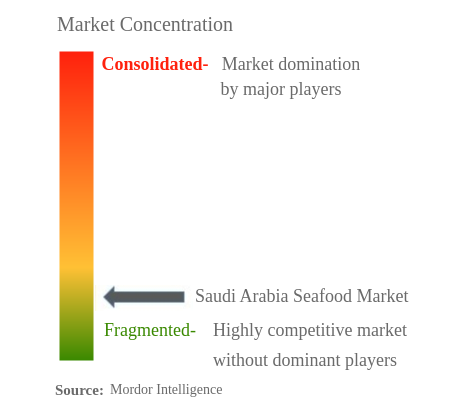
The Saudi Arabia Seafood Market is fragmented, with the top five companies occupying 1.78%. The major players in this market are Almunajem Foods, Naqua Seafood, Saudi Fishries Company, Shell Fisheries Company W.L.L. and Tabuk Fisheries Co. (sorted alphabetically).
Saudi Arabia Seafood Market Leaders
Almunajem Foods
Naqua Seafood
Saudi Fishries Company
Shell Fisheries Company W.L.L.
Tabuk Fisheries Co.
*Disclaimer: Major Players sorted in no particular order
Saudi Arabia Seafood Market News
- February 2022: Tabuk Fisheries and NEOM planned on an agreement to build a new fish farm with a capacity of 70 million fingerlings.
- February 2022: Asmak announced a strategic distribution agreement with Fish Farm, a UAE-based aquaculture company. Under this agreement, Asmak distributes fish farm products to capture a wider audience locally and regionally through its processing facility and strong distribution channels, including wholesale, foodservice, and retail.
- April 2021: Tabuk Fisheries Co. announced its plan to build a fish farm in the Neom region in Saudi Arabia. The hatchery will operate with a capacity of 70 million fingerlings and will focus on improving the production of local fish species in the Red Sea to contribute to achieving the Kingdom's goal of producing 600,000 tons of fish products by 2030.
Saudi Arabia Seafood Market Report - Table of Contents
EXECUTIVE SUMMARY & KEY FINDINGS
1. INTRODUCTION
1.1. Study Assumptions & Market Definition
1.2. Scope of the Study
1.3. Research Methodology
2. KEY INDUSTRY TRENDS
2.1. Price Trends
2.2. Production Trends
2.3. Regulatory Framework
2.4. Value Chain & Distribution Channel Analysis
3. MARKET SEGMENTATION
3.1. Type
3.1.1. Fish
3.1.2. Shrimp
3.1.3. Other Seafood
3.2. Form
3.2.1. Fresh / Chilled
3.2.2. Frozen / Canned
3.2.3. Processed
3.3. Distribution Channel
3.3.1. Off-Trade
3.3.1.1. Convenience Stores
3.3.1.2. Online Channel
3.3.1.3. Supermarkets and Hypermarkets
3.3.1.4. Others
3.3.2. On-Trade
4. COMPETITIVE LANDSCAPE
4.1. Key Strategic Moves
4.2. Market Share Analysis
4.3. Company Landscape
4.4. Company Profiles
4.4.1. Almunajem Foods
4.4.2. Arab Fisheries Co
4.4.3. IZAFCO For Fish Packing Company
4.4.4. Naqua Seafood
4.4.5. Saudi Fishries Company
4.4.6. Shell Fisheries Company W.L.L.
4.4.7. Tabuk Fisheries Co.
4.4.8. The Savola Group
5. KEY STRATEGIC QUESTIONS FOR SEAFOOD INDUSTRY CEOS
6. APPENDIX
6.1. Global Overview
6.1.1. Overview
6.1.2. Porter’s Five Forces Framework
6.1.3. Global Value Chain Analysis
6.1.4. Market Dynamics (DROs)
6.2. Sources & References
6.3. List of Tables & Figures
6.4. Primary Insights
6.5. Data Pack
6.6. Glossary of Terms
List of Tables & Figures
- Figure 1:
- SAUDI ARABIA SEAFOOD MARKET, FISH, PRICE IN USD/METRIC TONNES, 2016 - 2022
- Figure 2:
- SAUDI ARABIA SEAFOOD MARKET, SHRIMP, PRICE IN USD/METRIC TONNES, 2016 - 2022
- Figure 3:
- SAUDI ARABIA SEAFOOD MARKET, FISH, PRODUCTION IN METRIC TONNES, 2016 - 2028
- Figure 4:
- SAUDI ARABIA SEAFOOD MARKET, VOLUME, METRIC TONNES, 2016 - 2028
- Figure 5:
- SAUDI ARABIA SEAFOOD MARKET, VALUE, USD, 2016 - 2028
- Figure 6:
- SAUDI ARABIA SEAFOOD MARKET, VOLUME IN METRIC TONNES, BY TYPE, 2016 - 2028
- Figure 7:
- SAUDI ARABIA SEAFOOD MARKET, VALUE IN USD, BY TYPE, 2016 - 2028
- Figure 8:
- SAUDI ARABIA SEAFOOD MARKET, VOLUME SHARE (%), BY TYPE, 2016 VS 2022 VS 2028
- Figure 9:
- SAUDI ARABIA SEAFOOD MARKET, VALUE SHARE (%), BY TYPE, 2016 VS 2022 VS 2028
- Figure 10:
- SAUDI ARABIA SEAFOOD MARKET, VOLUME IN METRIC TONNES, FISH, 2016 - 2028
- Figure 11:
- SAUDI ARABIA SEAFOOD MARKET, VALUE IN USD, FISH, 2016 - 2028
- Figure 12:
- SAUDI ARABIA SEAFOOD MARKET, FISH, VALUE SHARE (%), BY FORM, 2021 VS 2028
- Figure 13:
- SAUDI ARABIA SEAFOOD MARKET, VOLUME IN METRIC TONNES, SHRIMP, 2016 - 2028
- Figure 14:
- SAUDI ARABIA SEAFOOD MARKET, VALUE IN USD, SHRIMP, 2016 - 2028
- Figure 15:
- SAUDI ARABIA SEAFOOD MARKET, SHRIMP, VALUE SHARE (%), BY FORM, 2021 VS 2028
- Figure 16:
- SAUDI ARABIA SEAFOOD MARKET, VOLUME IN METRIC TONNES, OTHER SEAFOOD, 2016 - 2028
- Figure 17:
- SAUDI ARABIA SEAFOOD MARKET, VALUE IN USD, OTHER SEAFOOD, 2016 - 2028
- Figure 18:
- SAUDI ARABIA SEAFOOD MARKET, OTHER SEAFOOD, VALUE SHARE (%), BY FORM, 2021 VS 2028
- Figure 19:
- SAUDI ARABIA SEAFOOD MARKET, VOLUME IN METRIC TONNES, BY FORM, 2016 - 2028
- Figure 20:
- SAUDI ARABIA SEAFOOD MARKET, VALUE IN USD, BY FORM, 2016 - 2028
- Figure 21:
- SAUDI ARABIA SEAFOOD MARKET, VOLUME SHARE (%), BY FORM, 2016 VS 2022 VS 2028
- Figure 22:
- SAUDI ARABIA SEAFOOD MARKET, VALUE SHARE (%), BY FORM, 2016 VS 2022 VS 2028
- Figure 23:
- SAUDI ARABIA SEAFOOD MARKET, VOLUME IN METRIC TONNES, FRESH / CHILLED, 2016 - 2028
- Figure 24:
- SAUDI ARABIA SEAFOOD MARKET, VALUE IN USD, FRESH / CHILLED, 2016 - 2028
- Figure 25:
- SAUDI ARABIA SEAFOOD MARKET, FRESH / CHILLED, VALUE SHARE (%), BY TYPE, 2021 VS 2028
- Figure 26:
- SAUDI ARABIA SEAFOOD MARKET, VOLUME IN METRIC TONNES, FROZEN / CANNED, 2016 - 2028
- Figure 27:
- SAUDI ARABIA SEAFOOD MARKET, VALUE IN USD, FROZEN / CANNED, 2016 - 2028
- Figure 28:
- SAUDI ARABIA SEAFOOD MARKET, FROZEN / CANNED, VALUE SHARE (%), BY TYPE, 2021 VS 2028
- Figure 29:
- SAUDI ARABIA SEAFOOD MARKET, VOLUME IN METRIC TONNES, PROCESSED, 2016 - 2028
- Figure 30:
- SAUDI ARABIA SEAFOOD MARKET, VALUE IN USD, PROCESSED, 2016 - 2028
- Figure 31:
- SAUDI ARABIA SEAFOOD MARKET, PROCESSED, VALUE SHARE (%), BY TYPE, 2021 VS 2028
- Figure 32:
- SAUDI ARABIA SEAFOOD MARKET, VOLUME IN METRIC TONNES, BY DISTRIBUTION CHANNEL, 2016 - 2028
- Figure 33:
- SAUDI ARABIA SEAFOOD MARKET, VALUE IN USD, BY DISTRIBUTION CHANNEL, 2016 - 2028
- Figure 34:
- SAUDI ARABIA SEAFOOD MARKET, VOLUME SHARE (%), BY DISTRIBUTION CHANNEL, 2016 VS 2022 VS 2028
- Figure 35:
- SAUDI ARABIA SEAFOOD MARKET, VALUE SHARE (%), BY DISTRIBUTION CHANNEL, 2016 VS 2022 VS 2028
- Figure 36:
- SAUDI ARABIA SEAFOOD MARKET, VOLUME IN METRIC TONNES, BY OFF-TRADE, 2016 - 2028
- Figure 37:
- SAUDI ARABIA SEAFOOD MARKET, VALUE IN USD, BY OFF-TRADE, 2016 - 2028
- Figure 38:
- SAUDI ARABIA SEAFOOD MARKET, VOLUME SHARE (%), BY OFF-TRADE, 2016 VS 2022 VS 2028
- Figure 39:
- SAUDI ARABIA SEAFOOD MARKET, VALUE SHARE (%), BY OFF-TRADE, 2016 VS 2022 VS 2028
- Figure 40:
- SAUDI ARABIA SEAFOOD MARKET, VOLUME IN METRIC TONNES, CONVENIENCE STORES, 2016 - 2028
- Figure 41:
- SAUDI ARABIA SEAFOOD MARKET, VALUE IN USD, CONVENIENCE STORES, 2016 - 2028
- Figure 42:
- SAUDI ARABIA SEAFOOD MARKET, CONVENIENCE STORES, VALUE SHARE (%), BY TYPE, 2021 VS 2028
- Figure 43:
- SAUDI ARABIA SEAFOOD MARKET, VOLUME IN METRIC TONNES, ONLINE CHANNEL, 2016 - 2028
- Figure 44:
- SAUDI ARABIA SEAFOOD MARKET, VALUE IN USD, ONLINE CHANNEL, 2016 - 2028
- Figure 45:
- SAUDI ARABIA SEAFOOD MARKET, ONLINE CHANNEL, VALUE SHARE (%), BY TYPE, 2021 VS 2028
- Figure 46:
- SAUDI ARABIA SEAFOOD MARKET, VOLUME IN METRIC TONNES, SUPERMARKETS AND HYPERMARKETS, 2016 - 2028
- Figure 47:
- SAUDI ARABIA SEAFOOD MARKET, VALUE IN USD, SUPERMARKETS AND HYPERMARKETS, 2016 - 2028
- Figure 48:
- SAUDI ARABIA SEAFOOD MARKET, SUPERMARKETS AND HYPERMARKETS, VALUE SHARE (%), BY TYPE, 2021 VS 2028
- Figure 49:
- SAUDI ARABIA SEAFOOD MARKET, VOLUME IN METRIC TONNES, OTHERS, 2016 - 2028
- Figure 50:
- SAUDI ARABIA SEAFOOD MARKET, VALUE IN USD, OTHERS, 2016 - 2028
- Figure 51:
- SAUDI ARABIA SEAFOOD MARKET, OTHERS, VALUE SHARE (%), BY TYPE, 2021 VS 2028
- Figure 52:
- SAUDI ARABIA SEAFOOD MARKET, VOLUME IN METRIC TONNES, ON-TRADE, 2016 - 2028
- Figure 53:
- SAUDI ARABIA SEAFOOD MARKET, VALUE IN USD, ON-TRADE, 2016 - 2028
- Figure 54:
- SAUDI ARABIA SEAFOOD MARKET, MOST ACTIVE COMPANIES, BY NUMBER OF STRATEGIC MOVES, 2017 - 2022
- Figure 55:
- SAUDI ARABIA SEAFOOD MARKET, TOTAL NUMBER OF STRATEGIC MOVES, 2017 - 2022
- Figure 56:
- SAUDI ARABIA SEAFOOD MARKET SHARE(%), BY KEY PLAYERS, 2021
Saudi Arabia Seafood Industry Segmentation
Fish, Shrimp are covered as segments by Type. Fresh / Chilled, Frozen / Canned, Processed are covered as segments by Form. Off-Trade, On-Trade are covered as segments by Distribution Channel.| Type | |
| Fish | |
| Shrimp | |
| Other Seafood |
| Form | |
| Fresh / Chilled | |
| Frozen / Canned | |
| Processed |
| Distribution Channel | ||||||
| ||||||
| On-Trade |
Market Definition
- Frozen / Canned Seafood - Frozen seafood are products whose average temperature is reduced to -18 ° C or lower to preserve the inherent quality of the fresh fish. Then it is kept at a temperature of -18 ° C or lower to maintain its shelf life.
- Processed Seafood - Processed seafood are the ones that have been cured, salted, marinated, dried, pickled, fermented or smoked for human consumption.
- Seafood - It contains marine species that can be consumed, particularly fish and shelled marine life.
- Shrimp - Shrimp are swimming crustaceans. They have long, slender muscles in their abdomens and lengthy antennae.
Research Methodology
Mordor Intelligence follows a four-step methodology in all our reports.
- Step-1: Identify Key Variables: In order to build a robust forecasting methodology, the variables and factors identified in Step 1 are tested against available historical market numbers. Through an iterative process, the variables required for market forecast are set, and the model is built on the basis of these variables.
- Step-2: Build a Market Model: Market-size estimations for the forecast years are in nominal terms. Inflation is not a part of the pricing, and the average selling price (ASP) is kept constant throughout the forecast period for each country.
- Step-3: Validate and Finalize: In this important step, all market numbers, variables, and analyst calls are validated through an extensive network of primary research experts from the market studied. The respondents are selected across levels and functions to generate a holistic picture of the market studied.
- Step-4: Research Outputs: Syndicated Reports, Custom Consulting Assignments, Databases & Subscription Platforms


