Silicone Sealants Market Size

| Icons | Lable | Value |
|---|---|---|
|
|
Study Period | 2017 - 2028 |
|
|
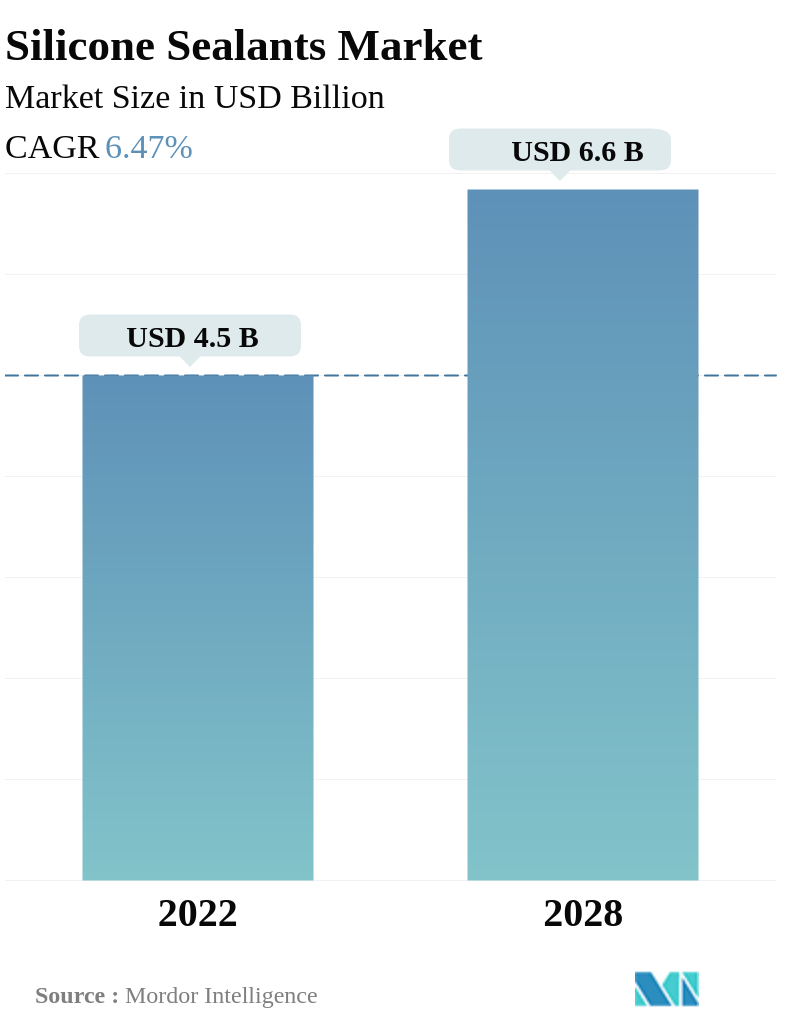
Market Size (2028) | USD 6.6 Billion |
|
|
Market Size (2022) | USD 4.5 Billion |
|
|
Largest Share by End User Industry | Building and Construction |
|
|
CAGR (2022 - 2028) | 6.47 % |
|
|
Largest Share by Region | Asia-Pacific |
Major Players |
||
|
|
||
|
*Disclaimer: Major Players sorted in no particular order |
Silicone Sealants Market Analysis
The Silicone Sealants Market is projected to register a CAGR of 6.47%
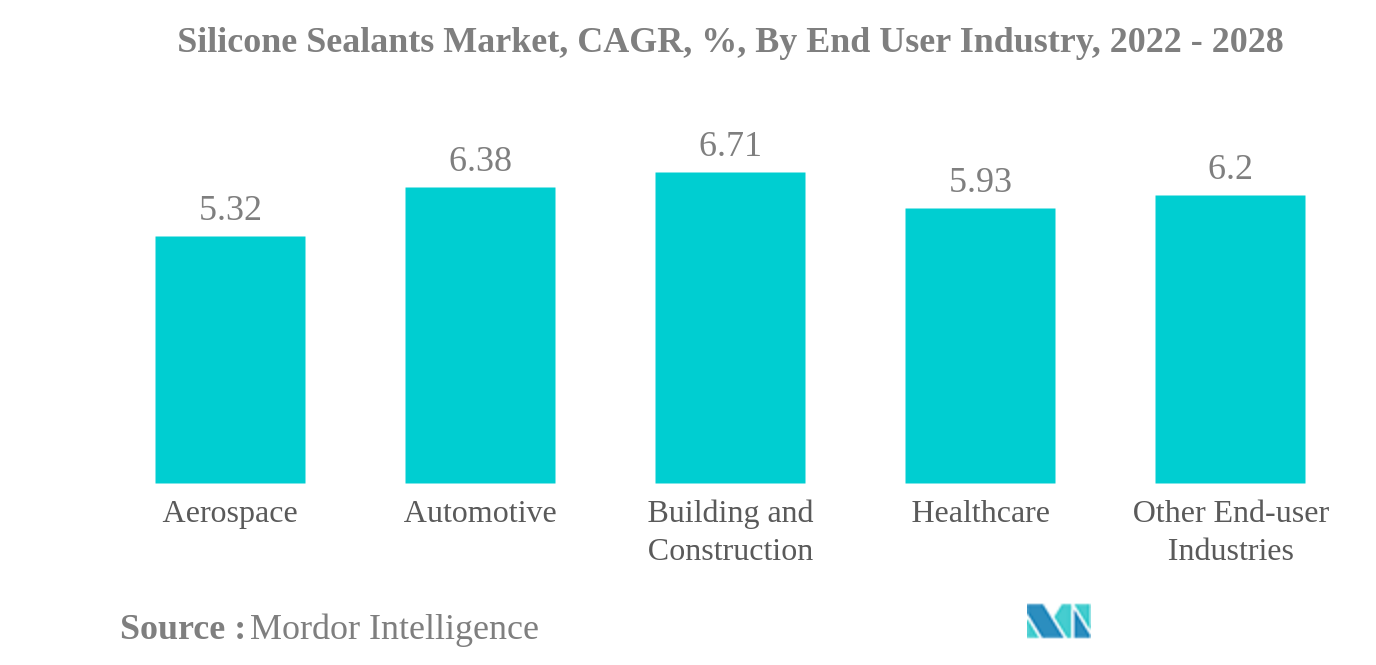
- Building and Construction is the Largest End User Industry. Building and construction is the dominant end-user industry for the global silicone sealants market owing to its wide range of structural applications, including joint sealing, windows, doors, and façade.
- Building and Construction is the Fastest-growing End User Industry. Building and construction is expected to be the fastest-growing segment in the market due to the increasing number of residential and commercial complexes in developing economies.
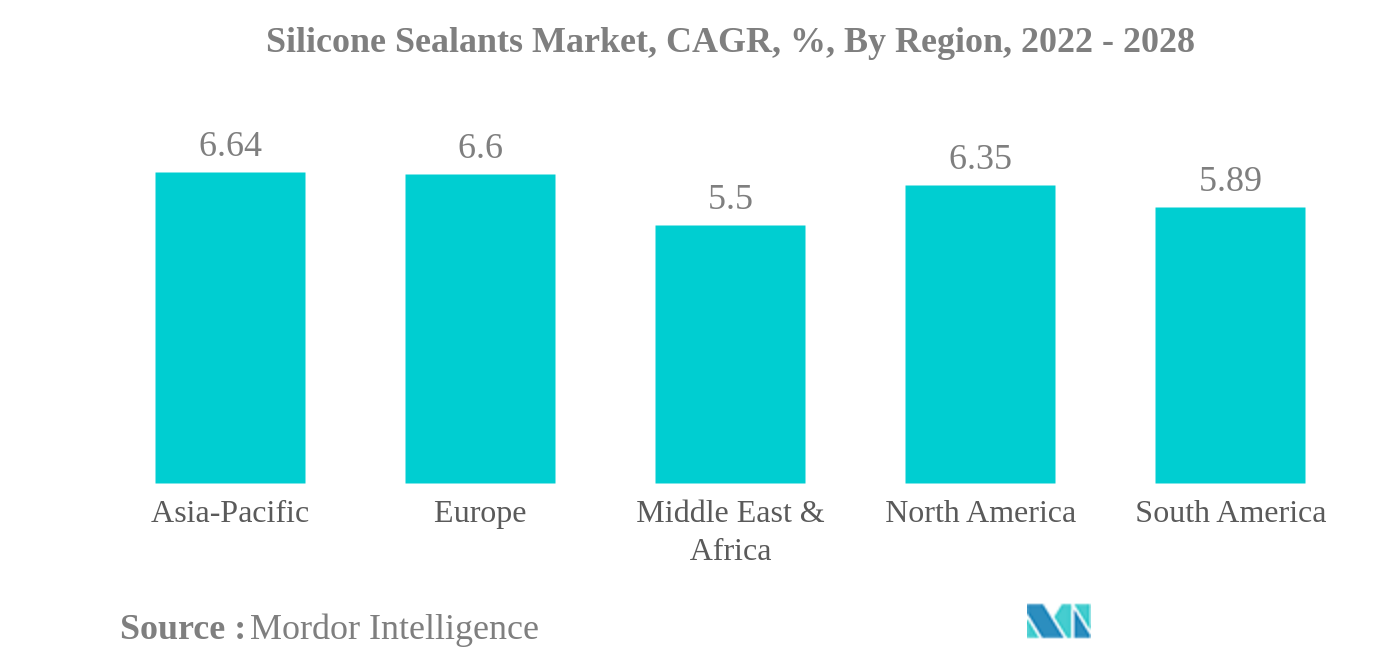
- Asia-Pacific is the Largest Region. Asia-Pacific, driven mainly by India, China, South Korea, and Japan, is a major silicone sealant consumer owing to the usage of sealants in various end-user industries, including construction, medical, automotive, and aerospace.
- Asia-Pacific is the Fastest-growing Region. Due to the increasing population and rapid urbanization in countries such as China, India, South Korea, and Japan, the Asia-Pacific region is projected to be the fastest-growing region in the market during the forecast period.
Silicone Sealants Market Trends
This section covers the major market trends shaping the Silicone Sealants Market according to our research experts:
Building and Construction is the largest End User Industry
- Silicone sealants are the most used type because of their unique properties, such as curing between temperatures of 40 degrees F to 140 degrees F, with drying only, good adhesion to porous surfaces, etc.
- Silicone sealants are widely used in the construction industry because of their applications, such as waterproofing, weather sealing, and crack sealing. The global construction industry is expected to grow at 3.5% per annum up to 2030. China, India, the United States, and Indonesia are expected to account for about 58% of global construction.
- Silicone sealants are widely used in the automotive industry because they apply to glass, metal, plastic, and painted surfaces. Their features are helpful in the automotive industry, such as extreme weather resistance, durability, and long-lasting. They are used in engines and car gaskets. The electric vehicles segment of the automotive industry is expected to record a 17.75% CAGR during the forecast period because of the increase in demand for the same in growing economies. This is expected to boost demand for automotive silicone sealants in the forecast period.
- Silicone sealants are widely used in electronics and electrical equipment manufacturing. They are used for sealing sensors and cables. The electronics and household appliances industries are expected to grow at a CAGR of 2.51% and 5.77%, respectively, globally, which may drive the demand for silicone sealants during the forecast period.
- Silicone resin-based sealants are used in the healthcare industry for assembling and sealing medical device parts. The increase in healthcare investments worldwide is expected to lead to a rise in demand during the forecast period.
Asia-Pacific is the largest Region
- Silicone sealants are consumed across the globe due to their strong sealing properties. These sealants are used in more than ten industries, including building and construction, automotive, and electronics. Silicone sealants are consumed mainly in the building and construction industry. The new floor area, including residential and non-residential buildings, was expected to reach 41.7 billion square footage in 2022, 6.15% more than in 2021. As a result, the consumption of silicone sealants witnessed a growth of 8.33% in 2022 compared to 2021.
- The demand for silicone sealants fell by 9.09% in 2020 compared to 2019 due to the COVID-19 pandemic's impact on many countries worldwide, including the United States, Germany, China, and Saudi Arabia. Production facilities were shut down during the period owing to lockdowns in many countries, which resulted in an irregular supply of raw materials for production.
- Asia-Pacific accounts for the highest silicone sealants consumption due to the rising building and construction and automotive industries. About 45% of the total construction investment in the world was set to come from this region in 2022. China is the world's largest construction industry, and it is expected to record a CAGR of 8.6% during the period 2022-2030. In Japan, the number of housing construction starts in 2021 were 856.48 thousand units, 4.8% more than in 2020. Such growth in the Asia-Pacific construction industry is expected to drive demand for silicone sealants over the forecast period.
- Silicone sealants are also widely consumed in Europe. Automotive production is expected to reach 19.2 million units by 2027 from 16.3 million units in 2021. These developments are expected to boost the demand for silicone sealants over the forecast period.
Silicone Sealants Industry Overview
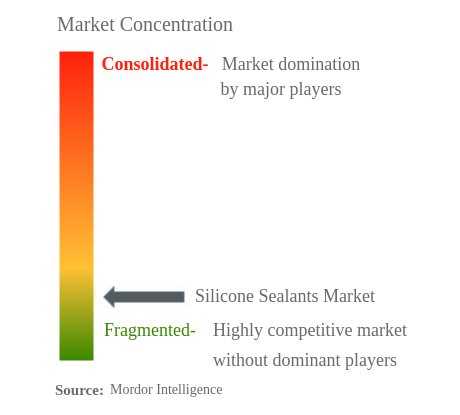
The Silicone Sealants Market is fragmented, with the top five companies occupying 34.65%. The major players in this market are Chengdu Guibao Science and Technology Co., Ltd., Dow, Henkel AG & Co. KGaA, Sika AG and Soudal Holding N.V. (sorted alphabetically).
Silicone Sealants Market Leaders
Chengdu Guibao Science and Technology Co., Ltd.
Dow
Henkel AG & Co. KGaA
Sika AG
Soudal Holding N.V.
*Disclaimer: Major Players sorted in no particular order
Silicone Sealants Market News
- May 2022: ITW Performance Polymers announced a distribution partnership with PREMA SA in Poland for its Devcon brand.
- December 2021: Sika planned to establish a new technology center and manufacturing factory for high-quality adhesives and sealants in Pune, India. The company primarily manufactures products for the transportation and construction industries through its three new production lines.
- July 2021: RPM International Inc. procured a 178,000-square-foot chemical manufacturing facility in Texas to act as a manufacturing campus, owned and operated by RPM’s Tremco Construction Products Group, to meet customer demand and strengthen its supply chain.
Silicone Sealants Market Report - Table of Contents
1. INTRODUCTION
1.1. Study Assumptions & Market Definition
1.2. Scope of the Study
1.3. Research Methodology
2. KEY INDUSTRY TRENDS
2.1. End User Trends
2.2. Regulatory Framework
2.3. Value Chain & Distribution Channel Analysis
3. MARKET SEGMENTATION
3.1. End User Industry
3.1.1. Aerospace
3.1.2. Automotive
3.1.3. Building and Construction
3.1.4. Healthcare
3.1.5. Other End-user Industries
3.2. Region
3.2.1. Asia-Pacific
3.2.1.1. Australia
3.2.1.2. China
3.2.1.3. India
3.2.1.4. Indonesia
3.2.1.5. Japan
3.2.1.6. Malaysia
3.2.1.7. Singapore
3.2.1.8. South Korea
3.2.1.9. Thailand
3.2.1.10. Rest of Asia-Pacific
3.2.2. Europe
3.2.2.1. France
3.2.2.2. Germany
3.2.2.3. Italy
3.2.2.4. Russia
3.2.2.5. Spain
3.2.2.6. United Kingdom
3.2.2.7. Rest of Europe
3.2.3. Middle East & Africa
3.2.3.1. Saudi Arabia
3.2.3.2. South Africa
3.2.3.3. Rest of Middle East & Africa
3.2.4. North America
3.2.4.1. Canada
3.2.4.2. Mexico
3.2.4.3. United States
3.2.4.4. Rest of North America
3.2.5. South America
3.2.5.1. Argentina
3.2.5.2. Brazil
3.2.5.3. Rest of South America
4. COMPETITIVE LANDSCAPE
4.1. Key Strategic Moves
4.2. Market Share Analysis
4.3. Company Landscape
4.4. Company Profiles
4.4.1. 3M
4.4.2. Arkema Group
4.4.3. Chengdu Guibao Science and Technology Co., Ltd.
4.4.4. Dow
4.4.5. Guangzhou Jointas Chemical Co.,Ltd.
4.4.6. H.B. Fuller Company
4.4.7. Henkel AG & Co. KGaA
4.4.8. Illinois Tool Works Inc.
4.4.9. MAPEI S.p.A.
4.4.10. Momentive
4.4.11. RPM International Inc.
4.4.12. Shin-Etsu Chemical Co., Ltd.
4.4.13. Sika AG
4.4.14. Soudal Holding N.V.
4.4.15. Wacker Chemie AG
5. KEY STRATEGIC QUESTIONS FOR ADHESIVES AND SEALANTS CEOS
6. APPENDIX
6.1. Global Adhesives and Sealants Industry Overview
6.1.1. Overview
6.1.2. Porter’s Five Forces Framework
6.1.3. Global Value Chain Analysis
6.1.4. Drivers, Restraints, and Opportunities
6.2. Sources & References
6.3. List of Tables & Figures
6.4. Primary Insights
6.5. Data Pack
6.6. Glossary of Terms
List of Tables & Figures
- Figure 1:
- GLOBAL AIRCRAFT DELIVERIES, VOLUME IN UNITS, 2017-2028
- Figure 2:
- GLOBAL AUTOMOBILE PRODUCTION, VOLUME IN UNITS, 2017-2028
- Figure 3:
- GLOBAL NEW FLOOR AREA, VOLUME IN SQUARE FEET, 2017-2028
- Figure 4:
- GLOBAL SILICONE SEALANTS MARKET, VOLUME, TONS, 2017 - 2028
- Figure 5:
- GLOBAL SILICONE SEALANTS MARKET, VALUE, USD, 2017 - 2028
- Figure 6:
- GLOBAL SILICONE SEALANTS MARKET, BY END USER INDUSTRY, VOLUME, TONS, 2017 - 2028
- Figure 7:
- GLOBAL SILICONE SEALANTS MARKET, BY END USER INDUSTRY, VALUE, USD, 2017 - 2028
- Figure 8:
- GLOBAL SILICONE SEALANTS MARKET, BY END USER INDUSTRY, VOLUME SHARE (%), 2022 VS 2028
- Figure 9:
- GLOBAL SILICONE SEALANTS MARKET, BY END USER INDUSTRY, VALUE SHARE (%), 2022 VS 2028
- Figure 10:
- GLOBAL SILICONE SEALANTS MARKET, AEROSPACE, VOLUME, TONS, 2017 - 2028
- Figure 11:
- GLOBAL SILICONE SEALANTS MARKET, AEROSPACE, VALUE, USD, 2017 - 2028
- Figure 12:
- GLOBAL SILICONE SEALANTS MARKET, AEROSPACE, BY REGION, VALUE SHARE (%), 2021 VS 2028
- Figure 13:
- GLOBAL SILICONE SEALANTS MARKET, AUTOMOTIVE, VOLUME, TONS, 2017 - 2028
- Figure 14:
- GLOBAL SILICONE SEALANTS MARKET, AUTOMOTIVE, VALUE, USD, 2017 - 2028
- Figure 15:
- GLOBAL SILICONE SEALANTS MARKET, AUTOMOTIVE, BY REGION, VALUE SHARE (%), 2021 VS 2028
- Figure 16:
- GLOBAL SILICONE SEALANTS MARKET, BUILDING AND CONSTRUCTION, VOLUME, TONS, 2017 - 2028
- Figure 17:
- GLOBAL SILICONE SEALANTS MARKET, BUILDING AND CONSTRUCTION, VALUE, USD, 2017 - 2028
- Figure 18:
- GLOBAL SILICONE SEALANTS MARKET, BUILDING AND CONSTRUCTION, BY REGION, VALUE SHARE (%), 2021 VS 2028
- Figure 19:
- GLOBAL SILICONE SEALANTS MARKET, HEALTHCARE, VOLUME, TONS, 2017 - 2028
- Figure 20:
- GLOBAL SILICONE SEALANTS MARKET, HEALTHCARE, VALUE, USD, 2017 - 2028
- Figure 21:
- GLOBAL SILICONE SEALANTS MARKET, HEALTHCARE, BY REGION, VALUE SHARE (%), 2021 VS 2028
- Figure 22:
- GLOBAL SILICONE SEALANTS MARKET, OTHER END-USER INDUSTRIES, VOLUME, TONS, 2017 - 2028
- Figure 23:
- GLOBAL SILICONE SEALANTS MARKET, OTHER END-USER INDUSTRIES, VALUE, USD, 2017 - 2028
- Figure 24:
- GLOBAL SILICONE SEALANTS MARKET, OTHER END-USER INDUSTRIES, BY REGION, VALUE SHARE (%), 2021 VS 2028
- Figure 25:
- GLOBAL SILICONE SEALANTS MARKET, BY REGION, VOLUME, TONS, 2017 - 2028
- Figure 26:
- GLOBAL SILICONE SEALANTS MARKET, BY REGION, VALUE, USD, 2017 - 2028
- Figure 27:
- GLOBAL SILICONE SEALANTS MARKET, BY REGION, VOLUME SHARE (%), 2022 VS 2028
- Figure 28:
- GLOBAL SILICONE SEALANTS MARKET, BY REGION, VALUE SHARE (%), 2022 VS 2028
- Figure 29:
- GLOBAL SILICONE SEALANTS MARKET, BY COUNTRY, ASIA-PACIFIC, VOLUME, TONS, 2017 - 2028
- Figure 30:
- GLOBAL SILICONE SEALANTS MARKET, BY COUNTRY, ASIA-PACIFIC, VALUE, USD, 2017 - 2028
- Figure 31:
- GLOBAL SILICONE SEALANTS MARKET, BY COUNTRY, ASIA-PACIFIC, VOLUME SHARE(%), 2022 VS 2028
- Figure 32:
- GLOBAL SILICONE SEALANTS MARKET, BY COUNTRY, ASIA-PACIFIC, VALUE SHARE(%), 2022 VS 2028
- Figure 33:
- GLOBAL SILICONE SEALANTS MARKET, AUSTRALIA, VOLUME, TONS, 2017 - 2028
- Figure 34:
- GLOBAL SILICONE SEALANTS MARKET, AUSTRALIA, VALUE, USD, 2017 - 2028
- Figure 35:
- GLOBAL SILICONE SEALANTS MARKET, AUSTRALIA, BY END USER INDUSTRY, VALUE SHARE (%), 2021 VS 2028
- Figure 36:
- GLOBAL SILICONE SEALANTS MARKET, CHINA, VOLUME, TONS, 2017 - 2028
- Figure 37:
- GLOBAL SILICONE SEALANTS MARKET, CHINA, VALUE, USD, 2017 - 2028
- Figure 38:
- GLOBAL SILICONE SEALANTS MARKET, CHINA, BY END USER INDUSTRY, VALUE SHARE (%), 2021 VS 2028
- Figure 39:
- GLOBAL SILICONE SEALANTS MARKET, INDIA, VOLUME, TONS, 2017 - 2028
- Figure 40:
- GLOBAL SILICONE SEALANTS MARKET, INDIA, VALUE, USD, 2017 - 2028
- Figure 41:
- GLOBAL SILICONE SEALANTS MARKET, INDIA, BY END USER INDUSTRY, VALUE SHARE (%), 2021 VS 2028
- Figure 42:
- GLOBAL SILICONE SEALANTS MARKET, INDONESIA, VOLUME, TONS, 2017 - 2028
- Figure 43:
- GLOBAL SILICONE SEALANTS MARKET, INDONESIA, VALUE, USD, 2017 - 2028
- Figure 44:
- GLOBAL SILICONE SEALANTS MARKET, INDONESIA, BY END USER INDUSTRY, VALUE SHARE (%), 2021 VS 2028
- Figure 45:
- GLOBAL SILICONE SEALANTS MARKET, JAPAN, VOLUME, TONS, 2017 - 2028
- Figure 46:
- GLOBAL SILICONE SEALANTS MARKET, JAPAN, VALUE, USD, 2017 - 2028
- Figure 47:
- GLOBAL SILICONE SEALANTS MARKET, JAPAN, BY END USER INDUSTRY, VALUE SHARE (%), 2021 VS 2028
- Figure 48:
- GLOBAL SILICONE SEALANTS MARKET, MALAYSIA, VOLUME, TONS, 2017 - 2028
- Figure 49:
- GLOBAL SILICONE SEALANTS MARKET, MALAYSIA, VALUE, USD, 2017 - 2028
- Figure 50:
- GLOBAL SILICONE SEALANTS MARKET, MALAYSIA, BY END USER INDUSTRY, VALUE SHARE (%), 2021 VS 2028
- Figure 51:
- GLOBAL SILICONE SEALANTS MARKET, SINGAPORE, VOLUME, TONS, 2017 - 2028
- Figure 52:
- GLOBAL SILICONE SEALANTS MARKET, SINGAPORE, VALUE, USD, 2017 - 2028
- Figure 53:
- GLOBAL SILICONE SEALANTS MARKET, SINGAPORE, BY END USER INDUSTRY, VALUE SHARE (%), 2021 VS 2028
- Figure 54:
- GLOBAL SILICONE SEALANTS MARKET, SOUTH KOREA, VOLUME, TONS, 2017 - 2028
- Figure 55:
- GLOBAL SILICONE SEALANTS MARKET, SOUTH KOREA, VALUE, USD, 2017 - 2028
- Figure 56:
- GLOBAL SILICONE SEALANTS MARKET, SOUTH KOREA, BY END USER INDUSTRY, VALUE SHARE (%), 2021 VS 2028
- Figure 57:
- GLOBAL SILICONE SEALANTS MARKET, THAILAND, VOLUME, TONS, 2017 - 2028
- Figure 58:
- GLOBAL SILICONE SEALANTS MARKET, THAILAND, VALUE, USD, 2017 - 2028
- Figure 59:
- GLOBAL SILICONE SEALANTS MARKET, THAILAND, BY END USER INDUSTRY, VALUE SHARE (%), 2021 VS 2028
- Figure 60:
- GLOBAL SILICONE SEALANTS MARKET, REST OF ASIA-PACIFIC, VOLUME, TONS, 2017 - 2028
- Figure 61:
- GLOBAL SILICONE SEALANTS MARKET, REST OF ASIA-PACIFIC, VALUE, USD, 2017 - 2028
- Figure 62:
- GLOBAL SILICONE SEALANTS MARKET, REST OF ASIA-PACIFIC, BY END USER INDUSTRY, VALUE SHARE (%), 2021 VS 2028
- Figure 63:
- GLOBAL SILICONE SEALANTS MARKET, BY COUNTRY, EUROPE, VOLUME, TONS, 2017 - 2028
- Figure 64:
- GLOBAL SILICONE SEALANTS MARKET, BY COUNTRY, EUROPE, VALUE, USD, 2017 - 2028
- Figure 65:
- GLOBAL SILICONE SEALANTS MARKET, BY COUNTRY, EUROPE, VOLUME SHARE(%), 2022 VS 2028
- Figure 66:
- GLOBAL SILICONE SEALANTS MARKET, BY COUNTRY, EUROPE, VALUE SHARE(%), 2022 VS 2028
- Figure 67:
- GLOBAL SILICONE SEALANTS MARKET, FRANCE, VOLUME, TONS, 2017 - 2028
- Figure 68:
- GLOBAL SILICONE SEALANTS MARKET, FRANCE, VALUE, USD, 2017 - 2028
- Figure 69:
- GLOBAL SILICONE SEALANTS MARKET, FRANCE, BY END USER INDUSTRY, VALUE SHARE (%), 2021 VS 2028
- Figure 70:
- GLOBAL SILICONE SEALANTS MARKET, GERMANY, VOLUME, TONS, 2017 - 2028
- Figure 71:
- GLOBAL SILICONE SEALANTS MARKET, GERMANY, VALUE, USD, 2017 - 2028
- Figure 72:
- GLOBAL SILICONE SEALANTS MARKET, GERMANY, BY END USER INDUSTRY, VALUE SHARE (%), 2021 VS 2028
- Figure 73:
- GLOBAL SILICONE SEALANTS MARKET, ITALY, VOLUME, TONS, 2017 - 2028
- Figure 74:
- GLOBAL SILICONE SEALANTS MARKET, ITALY, VALUE, USD, 2017 - 2028
- Figure 75:
- GLOBAL SILICONE SEALANTS MARKET, ITALY, BY END USER INDUSTRY, VALUE SHARE (%), 2021 VS 2028
- Figure 76:
- GLOBAL SILICONE SEALANTS MARKET, RUSSIA, VOLUME, TONS, 2017 - 2028
- Figure 77:
- GLOBAL SILICONE SEALANTS MARKET, RUSSIA, VALUE, USD, 2017 - 2028
- Figure 78:
- GLOBAL SILICONE SEALANTS MARKET, RUSSIA, BY END USER INDUSTRY, VALUE SHARE (%), 2021 VS 2028
- Figure 79:
- GLOBAL SILICONE SEALANTS MARKET, SPAIN, VOLUME, TONS, 2017 - 2028
- Figure 80:
- GLOBAL SILICONE SEALANTS MARKET, SPAIN, VALUE, USD, 2017 - 2028
- Figure 81:
- GLOBAL SILICONE SEALANTS MARKET, SPAIN, BY END USER INDUSTRY, VALUE SHARE (%), 2021 VS 2028
- Figure 82:
- GLOBAL SILICONE SEALANTS MARKET, UNITED KINGDOM, VOLUME, TONS, 2017 - 2028
- Figure 83:
- GLOBAL SILICONE SEALANTS MARKET, UNITED KINGDOM, VALUE, USD, 2017 - 2028
- Figure 84:
- GLOBAL SILICONE SEALANTS MARKET, UNITED KINGDOM, BY END USER INDUSTRY, VALUE SHARE (%), 2021 VS 2028
- Figure 85:
- GLOBAL SILICONE SEALANTS MARKET, REST OF EUROPE, VOLUME, TONS, 2017 - 2028
- Figure 86:
- GLOBAL SILICONE SEALANTS MARKET, REST OF EUROPE, VALUE, USD, 2017 - 2028
- Figure 87:
- GLOBAL SILICONE SEALANTS MARKET, REST OF EUROPE, BY END USER INDUSTRY, VALUE SHARE (%), 2021 VS 2028
- Figure 88:
- GLOBAL SILICONE SEALANTS MARKET, BY COUNTRY, MIDDLE EAST & AFRICA, VOLUME, TONS, 2017 - 2028
- Figure 89:
- GLOBAL SILICONE SEALANTS MARKET, BY COUNTRY, MIDDLE EAST & AFRICA, VALUE, USD, 2017 - 2028
- Figure 90:
- GLOBAL SILICONE SEALANTS MARKET, BY COUNTRY, MIDDLE EAST & AFRICA, VOLUME SHARE(%), 2022 VS 2028
- Figure 91:
- GLOBAL SILICONE SEALANTS MARKET, BY COUNTRY, MIDDLE EAST & AFRICA, VALUE SHARE(%), 2022 VS 2028
- Figure 92:
- GLOBAL SILICONE SEALANTS MARKET, SAUDI ARABIA, VOLUME, TONS, 2017 - 2028
- Figure 93:
- GLOBAL SILICONE SEALANTS MARKET, SAUDI ARABIA, VALUE, USD, 2017 - 2028
- Figure 94:
- GLOBAL SILICONE SEALANTS MARKET, SAUDI ARABIA, BY END USER INDUSTRY, VALUE SHARE (%), 2021 VS 2028
- Figure 95:
- GLOBAL SILICONE SEALANTS MARKET, SOUTH AFRICA, VOLUME, TONS, 2017 - 2028
- Figure 96:
- GLOBAL SILICONE SEALANTS MARKET, SOUTH AFRICA, VALUE, USD, 2017 - 2028
- Figure 97:
- GLOBAL SILICONE SEALANTS MARKET, SOUTH AFRICA, BY END USER INDUSTRY, VALUE SHARE (%), 2021 VS 2028
- Figure 98:
- GLOBAL SILICONE SEALANTS MARKET, REST OF MIDDLE EAST & AFRICA, VOLUME, TONS, 2017 - 2028
- Figure 99:
- GLOBAL SILICONE SEALANTS MARKET, REST OF MIDDLE EAST & AFRICA, VALUE, USD, 2017 - 2028
- Figure 100:
- GLOBAL SILICONE SEALANTS MARKET, REST OF MIDDLE EAST & AFRICA, BY END USER INDUSTRY, VALUE SHARE (%), 2021 VS 2028
- Figure 101:
- GLOBAL SILICONE SEALANTS MARKET, BY COUNTRY, NORTH AMERICA, VOLUME, TONS, 2017 - 2028
- Figure 102:
- GLOBAL SILICONE SEALANTS MARKET, BY COUNTRY, NORTH AMERICA, VALUE, USD, 2017 - 2028
- Figure 103:
- GLOBAL SILICONE SEALANTS MARKET, BY COUNTRY, NORTH AMERICA, VOLUME SHARE(%), 2022 VS 2028
- Figure 104:
- GLOBAL SILICONE SEALANTS MARKET, BY COUNTRY, NORTH AMERICA, VALUE SHARE(%), 2022 VS 2028
- Figure 105:
- GLOBAL SILICONE SEALANTS MARKET, CANADA, VOLUME, TONS, 2017 - 2028
- Figure 106:
- GLOBAL SILICONE SEALANTS MARKET, CANADA, VALUE, USD, 2017 - 2028
- Figure 107:
- GLOBAL SILICONE SEALANTS MARKET, CANADA, BY END USER INDUSTRY, VALUE SHARE (%), 2021 VS 2028
- Figure 108:
- GLOBAL SILICONE SEALANTS MARKET, MEXICO, VOLUME, TONS, 2017 - 2028
- Figure 109:
- GLOBAL SILICONE SEALANTS MARKET, MEXICO, VALUE, USD, 2017 - 2028
- Figure 110:
- GLOBAL SILICONE SEALANTS MARKET, MEXICO, BY END USER INDUSTRY, VALUE SHARE (%), 2021 VS 2028
- Figure 111:
- GLOBAL SILICONE SEALANTS MARKET, UNITED STATES, VOLUME, TONS, 2017 - 2028
- Figure 112:
- GLOBAL SILICONE SEALANTS MARKET, UNITED STATES, VALUE, USD, 2017 - 2028
- Figure 113:
- GLOBAL SILICONE SEALANTS MARKET, UNITED STATES, BY END USER INDUSTRY, VALUE SHARE (%), 2021 VS 2028
- Figure 114:
- GLOBAL SILICONE SEALANTS MARKET, REST OF NORTH AMERICA, VOLUME, TONS, 2017 - 2028
- Figure 115:
- GLOBAL SILICONE SEALANTS MARKET, REST OF NORTH AMERICA, VALUE, USD, 2017 - 2028
- Figure 116:
- GLOBAL SILICONE SEALANTS MARKET, REST OF NORTH AMERICA, BY END USER INDUSTRY, VALUE SHARE (%), 2021 VS 2028
- Figure 117:
- GLOBAL SILICONE SEALANTS MARKET, BY COUNTRY, SOUTH AMERICA, VOLUME, TONS, 2017 - 2028
- Figure 118:
- GLOBAL SILICONE SEALANTS MARKET, BY COUNTRY, SOUTH AMERICA, VALUE, USD, 2017 - 2028
- Figure 119:
- GLOBAL SILICONE SEALANTS MARKET, BY COUNTRY, SOUTH AMERICA, VOLUME SHARE(%), 2022 VS 2028
- Figure 120:
- GLOBAL SILICONE SEALANTS MARKET, BY COUNTRY, SOUTH AMERICA, VALUE SHARE(%), 2022 VS 2028
- Figure 121:
- GLOBAL SILICONE SEALANTS MARKET, ARGENTINA, VOLUME, TONS, 2017 - 2028
- Figure 122:
- GLOBAL SILICONE SEALANTS MARKET, ARGENTINA, VALUE, USD, 2017 - 2028
- Figure 123:
- GLOBAL SILICONE SEALANTS MARKET, ARGENTINA, BY END USER INDUSTRY, VALUE SHARE (%), 2021 VS 2028
- Figure 124:
- GLOBAL SILICONE SEALANTS MARKET, BRAZIL, VOLUME, TONS, 2017 - 2028
- Figure 125:
- GLOBAL SILICONE SEALANTS MARKET, BRAZIL, VALUE, USD, 2017 - 2028
- Figure 126:
- GLOBAL SILICONE SEALANTS MARKET, BRAZIL, BY END USER INDUSTRY, VALUE SHARE (%), 2021 VS 2028
- Figure 127:
- GLOBAL SILICONE SEALANTS MARKET, REST OF SOUTH AMERICA, VOLUME, TONS, 2017 - 2028
- Figure 128:
- GLOBAL SILICONE SEALANTS MARKET, REST OF SOUTH AMERICA, VALUE, USD, 2017 - 2028
- Figure 129:
- GLOBAL SILICONE SEALANTS MARKET, REST OF SOUTH AMERICA, BY END USER INDUSTRY, VALUE SHARE (%), 2021 VS 2028
- Figure 130:
- GLOBAL SILICONE SEALANTS MARKET, MOST ACTIVE COMPANIES, BY NUMBER OF STRATEGIC MOVES, 2019 - 2021
- Figure 131:
- GLOBAL SILICONE SEALANTS MARKET, MOST ADOPTED STRATEGIES, 2019 - 2021
- Figure 132:
- GLOBAL SILICONE SEALANTS MARKET SHARE(%), BY MAJOR PLAYERS REVENUE, 2021
Silicone Sealants Industry Segmentation
Aerospace, Automotive, Building and Construction, Healthcare are covered as segments by End User Industry. Asia-Pacific, Europe, Middle East & Africa, North America, South America are covered as segments by Region.| End User Industry | |
| Aerospace | |
| Automotive | |
| Building and Construction | |
| Healthcare | |
| Other End-user Industries |
| Region | ||||||||||||
| ||||||||||||
| ||||||||||||
| ||||||||||||
| ||||||||||||
|
Market Definition
- End-user Industry - Building & Construction, Automotive, Aerospace, Healthcare, and Others are the end-user industries considered under the silicone sealants market.
- Product - All silicone sealant products are considered in the market studied
- Resin - Under the scope of the study, acetoxy (or acetic) and neutral silicones are considered
- Technology - Silicone sealants are cured at ambient temperature (room temperatures).
Research Methodology
Mordor Intelligence follows a four-step methodology in all our reports.
- Step-1: Identify Key Variables: The quantifiable key variables (industry and extraneous) pertaining to the specific product segment and country are selected from a group of relevant variables & factors based on desk research & literature review; along with primary expert inputs. These variables are further confirmed through regression modeling (wherever required).
- Step-2: Build a Market Model: In order to build a robust forecasting methodology, the variables and factors identified in Step-1 are tested against available historical market numbers. Through an iterative process, the variables required for market forecast are set and the model is built on the basis of these variables.
- Step-3: Validate and Finalize: In this important step, all market numbers, variables and analyst calls are validated through an extensive network of primary research experts from the market studied. The respondents are selected across levels and functions to generate a holistic picture of the market studied.
- Step-4: Research Outputs: Syndicated Reports, Custom Consulting Assignments, Databases & Subscription Platforms


