South America Biofertilizer Market Size

| Icons | Lable | Value |
|---|---|---|
|
|
Study Period | 2017 - 2029 |
|
|
Base Year For Estimation | 2022 |
|
|
CAGR | 10.02 % |
|
|
Largest Share by Form | Azotobacter |
|
|
Largest Share by Country | Brazil |
|
|
Market Concentration | High |
Major Players |
||
|
|
||
|
*Disclaimer: Major Players sorted in no particular order |
South America Biofertilizer Market Analysis
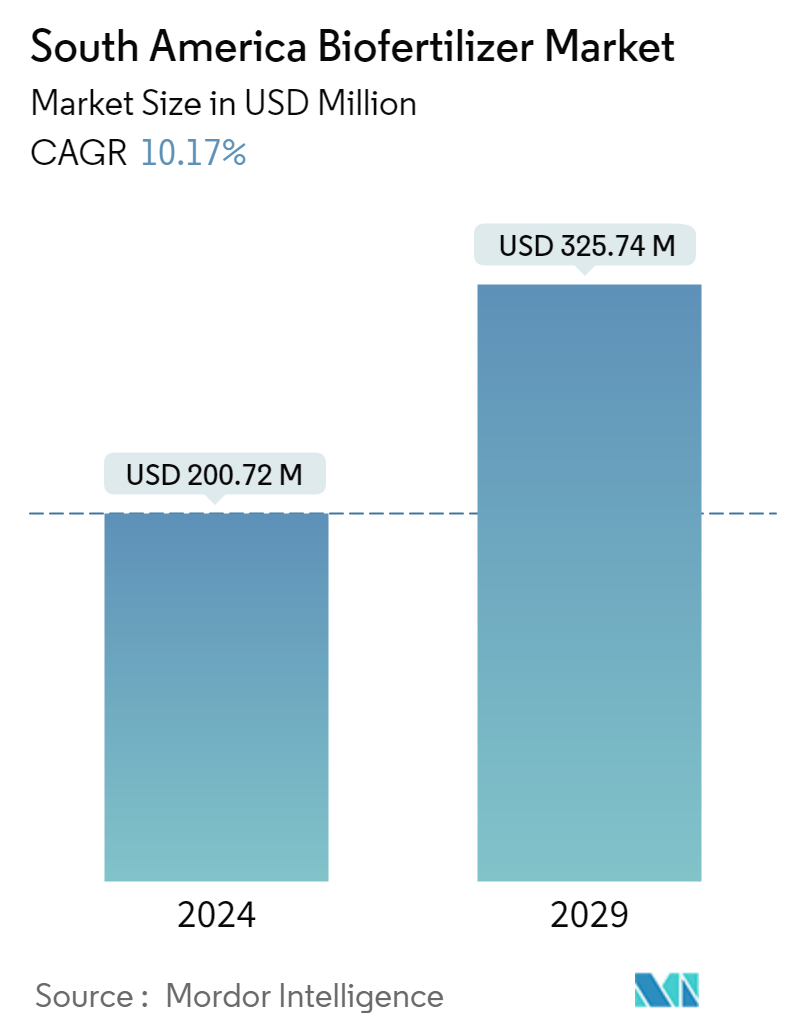
The South America Biofertilizer Market is projected to register a CAGR of 10.02%
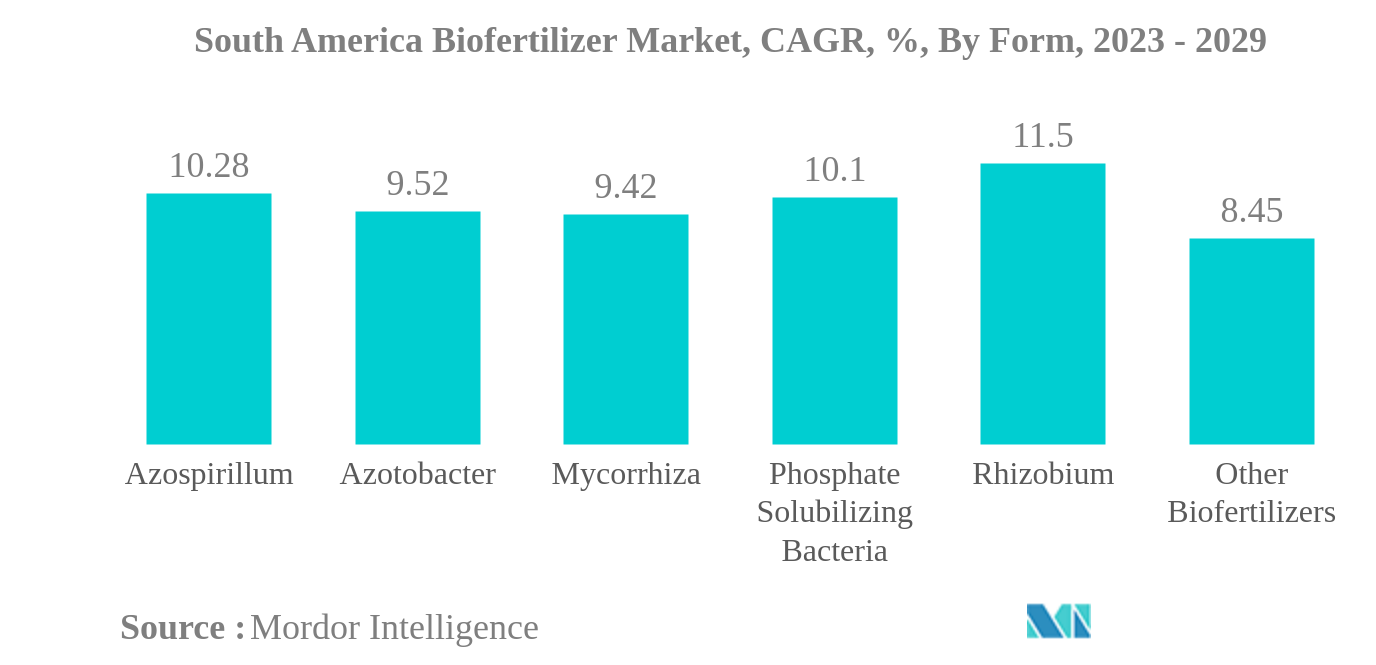
- Azotobacter is the Largest Form : Azotobacter can fix 2.5 × 10¹¹ kg of N-NH3 annually and 1 ton of this nitrogen can equate the 2 tons of industrially produced mineral nitrogen in crop production.
- Rhizobium is the Fastest-growing Form : Application of rhizobium is known to reduce the cost of production as it as fix 40-250 kg of nitrogen in the soil and reduces the application of Urea by 55 to 200 kg.
- Row Crops is the Largest Crop Type : The dominance of row crops is primarily due to its growing organic area acreages, which has increased by 39.5% during the historic period to reach 2.3 lakh hectares in 2021.
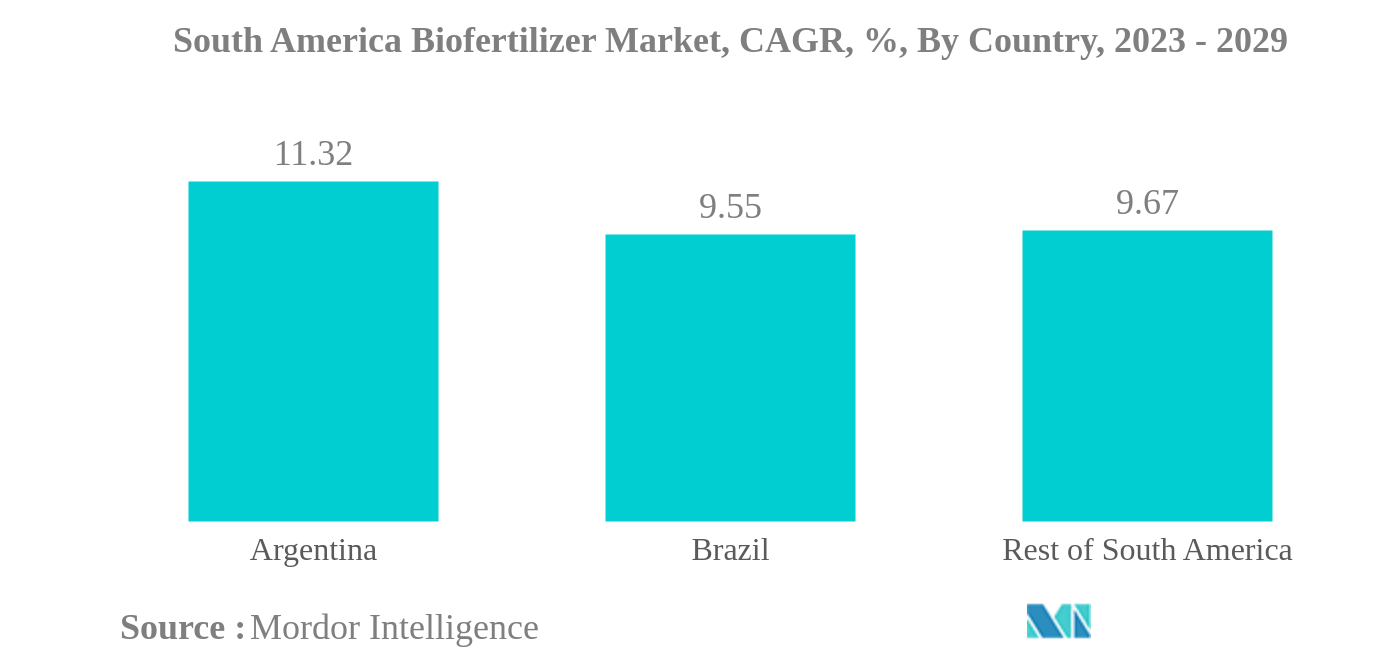
- Brazil is the Largest Country : Brazil is an important Agricultural country in South America and the country accounts for 65.3% share of the total biofertilizer consumption in the region in 2022.
South America Biofertilizer Market Trends
This section covers the major market trends shaping the South America Biofertilizer Market according to our research experts:
Azotobacter is the largest Form
- Biofertilizers are a sustainable and eco-friendly way of enhancing plant growth and productivity. They are composed of living microorganisms that can improve the soil's nutrient content, making essential elements more accessible to plants. Some of the most commonly used biofertilizers include mycorrhiza, Azospirillum, Azotobacter, Rhizobium, and phosphate-solubilizing bacteria.
- These microorganisms are selected for their ability to improve the soil's health and fertility, providing crops with the nutrients required. They work by either breaking down organic matter to release essential nutrients or directly increasing the availability of specific nutrients in the soil.
- Azotobacter accounted for 28.6% of the total biofertilizers consumed in the region. Field tests on Azotobacter under various agro-climatic conditions revealed that the biofertilizer is suitable for inoculating with seeds or seedlings of crops such as onion, tomato, and cabbage. Under typical field circumstances, Azotobacter inoculation reduces the need for nitrogenous fertilizers in these crops by 10-20%. Thus, the usage of Azotobacter in agriculture is expected to grow in the coming years.
- Research in Brazil has demonstrated that the combination of two strains of Azospirillum brasilense, Ab-V5 and Ab-V6, increased yields in key crops such as soybean, sugarcane, rice, wheat, and pasture. The application of these two strains is also compatible with other pesticides commonly used in these crops.
- The market for biofertilizers in the region is expected to grow due to the rising demand for organically-grown food and the government's emphasis on the importance of sustainable agricultural practices to keep the soil and environment safer.
Brazil is the largest Country
- Brazil is a leading agriculture nation in South America and held 65.3% of the total biofertilizer market in the region in 2022. The country's farmers are keeping up with the worldwide demand for organic food and achieved organic food sales worth USD 81.0 million in 2021, which rose 9.5% compared to the previous year, as per the Global Organic Trade.
- The area under cultivation of organic crops in the region increased during the historical period (2017-2022) from 495.7 thousand hectares in 2017 to 717.2 thousand hectares in 2021. The increasing trend in the overall organic crop is expected to drive the market for biofertilizers in these countries and is estimated to register a CAGR of 10.0% during the forecast period (2023-2029).
- With growing concern for soil and environmental pollution, the government and other organizations are highly promoting the usage of biological crop inputs across the region. In Argentina, the FAO's 2022-2031 Strategic Framework prioritizes transforming agri-food systems to be more efficient and sustainable, using agroeconomic methods, with a focus on reducing the use of chemical fertilizers and pesticides in agriculture. This opens up opportunities for adopting biofertilizers as a more sustainable alternative.
- Moreover, there has been a remarkable increase in the crop yield of leguminous crops. Strains of rhizobium produce growth hormones like indole acetic acid, which influences positive growth in plants by stimulating the formation and development of root nodules quickly. The advantages of biofertilizer usage are expected to drive their usage in South America. However, less awareness among the farmers and the long transition period from chemical farming to organic farming are slightly hindering the market growth of biofertilizers.
South America Biofertilizer Industry Overview
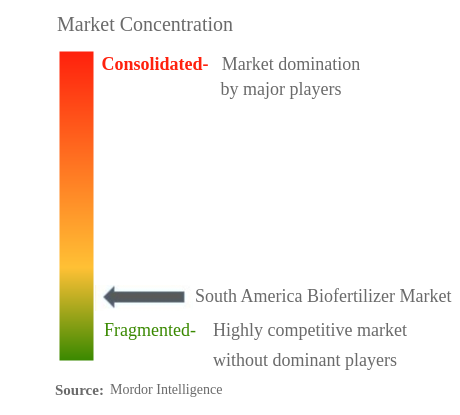
The South America Biofertilizer Market is fragmented, with the top five companies occupying 19.47%. The major players in this market are Koppert Biological Systems Inc., Novozymes, Rizobacter, Symborg Inc. and Vittia Group (sorted alphabetically).
South America Biofertilizer Market Leaders
Koppert Biological Systems Inc.
Novozymes
Rizobacter
Symborg Inc.
Vittia Group
*Disclaimer: Major Players sorted in no particular order
South America Biofertilizer Market News
- October 2022: Koppert intends to invest in three new production units in Brazil, ensuring its leadership in the Brazilian and global markets for biological agricultural inputs. The new formulation unit will be located on more than 8,000 m2. It will produce the entire microbiological line, including products based on viruses, fungi, and bacteria in liquid or solid formulations.
- September 2022: Corteva Agriscience agreed to acquire Symborg Inc., and this move will strengthen Symborg's global presence with a strong distribution network Corteva Agriscience.
- February 2022: Plant Response was acquired by The Mosaic Company, which is a global fertilizer manufacturer. This acquisition strengthens the company's global presence and helps develop new products and solutions for the customers sustainably.
South America Biofertilizer Market Report - Table of Contents
EXECUTIVE SUMMARY & KEY FINDINGS
REPORT OFFERS
1. INTRODUCTION
1.1. Study Assumptions & Market Definition
1.2. Scope of the Study
1.3. Research Methodology
2. KEY INDUSTRY TRENDS
2.1. Area Under Organic Cultivation
2.2. Per Capita Spending On Organic Products
2.3. Regulatory Framework
2.4. Value Chain & Distribution Channel Analysis
3. MARKET SEGMENTATION
3.1. Form
3.1.1. Azospirillum
3.1.2. Azotobacter
3.1.3. Mycorrhiza
3.1.4. Phosphate Solubilizing Bacteria
3.1.5. Rhizobium
3.1.6. Other Biofertilizers
3.2. Crop Type
3.2.1. Cash Crops
3.2.2. Horticultural Crops
3.2.3. Row Crops
3.3. Country
3.3.1. Argentina
3.3.2. Brazil
3.3.3. Rest Of South America
4. COMPETITIVE LANDSCAPE
4.1. Key Strategic Moves
4.2. Market Share Analysis
4.3. Company Landscape
4.4. Company Profiles
4.4.1. Atlántica Agrícola
4.4.2. IPL Biologicals Limited
4.4.3. Koppert Biological Systems Inc.
4.4.4. Novozymes
4.4.5. Plant Response Biotech Inc.
4.4.6. Rizobacter
4.4.7. Suståne Natural Fertilizer Inc.
4.4.8. Symborg Inc.
4.4.9. T.Stanes and Company Limited
4.4.10. Vittia Group
5. KEY STRATEGIC QUESTIONS FOR AGRICULTURAL BIOLOGICALS CEOS
6. APPENDIX
6.1. Global Overview
6.1.1. Overview
6.1.2. Porter’s Five Forces Framework
6.1.3. Global Value Chain Analysis
6.1.4. Market Dynamics (DROs)
6.2. Sources & References
6.3. List of Tables & Figures
6.4. Primary Insights
6.5. Data Pack
6.6. Glossary of Terms
List of Tables & Figures
- Figure 1:
- SOUTH AMERICA BIOFERTILIZER MARKET, AREA UNDER ORGANIC CULTIVATION, HECTARES, 2017 - 2022
- Figure 2:
- SOUTH AMERICA BIOFERTILIZER MARKET, PER CAPITA SPENDING ON ORGANIC PRODUCTS, USD, 2017 - 2022
- Figure 3:
- SOUTH AMERICA BIOFERTILIZER MARKET, VOLUME, METRIC TON, 2017 - 2029
- Figure 4:
- SOUTH AMERICA BIOFERTILIZER MARKET, VALUE, USD, 2017 - 2029
- Figure 5:
- SOUTH AMERICA BIOFERTILIZER MARKET, BY FORM, VOLUME, METRIC TON, 2017 - 2029
- Figure 6:
- SOUTH AMERICA BIOFERTILIZER MARKET, BY FORM, VALUE, USD, 2017 - 2029
- Figure 7:
- SOUTH AMERICA BIOFERTILIZER MARKET, VOLUME SHARE(%), BY FORM, 2017 - 2029
- Figure 8:
- SOUTH AMERICA BIOFERTILIZER MARKET, VALUE SHARE(%), BY FORM, 2017 - 2029
- Figure 9:
- SOUTH AMERICA BIOFERTILIZER MARKET, BY FORM, VOLUME, METRIC TON, 2017 - 2029
- Figure 10:
- SOUTH AMERICA BIOFERTILIZER MARKET, BY FORM, VALUE, USD, 2017 - 2029
- Figure 11:
- SOUTH AMERICA BIOFERTILIZER MARKET, VALUE SHARE(%), BY CROP TYPE, 2022 - 2029
- Figure 12:
- SOUTH AMERICA BIOFERTILIZER MARKET, BY FORM, VOLUME, METRIC TON, 2017 - 2029
- Figure 13:
- SOUTH AMERICA BIOFERTILIZER MARKET, BY FORM, VALUE, USD, 2017 - 2029
- Figure 14:
- SOUTH AMERICA BIOFERTILIZER MARKET, VALUE SHARE(%), BY CROP TYPE, 2022 - 2029
- Figure 15:
- SOUTH AMERICA BIOFERTILIZER MARKET, BY FORM, VOLUME, METRIC TON, 2017 - 2029
- Figure 16:
- SOUTH AMERICA BIOFERTILIZER MARKET, BY FORM, VALUE, USD, 2017 - 2029
- Figure 17:
- SOUTH AMERICA BIOFERTILIZER MARKET, VALUE SHARE(%), BY CROP TYPE, 2022 - 2029
- Figure 18:
- SOUTH AMERICA BIOFERTILIZER MARKET, BY FORM, VOLUME, METRIC TON, 2017 - 2029
- Figure 19:
- SOUTH AMERICA BIOFERTILIZER MARKET, BY FORM, VALUE, USD, 2017 - 2029
- Figure 20:
- SOUTH AMERICA BIOFERTILIZER MARKET, VALUE SHARE(%), BY CROP TYPE, 2022 - 2029
- Figure 21:
- SOUTH AMERICA BIOFERTILIZER MARKET, BY FORM, VOLUME, METRIC TON, 2017 - 2029
- Figure 22:
- SOUTH AMERICA BIOFERTILIZER MARKET, BY FORM, VALUE, USD, 2017 - 2029
- Figure 23:
- SOUTH AMERICA BIOFERTILIZER MARKET, VALUE SHARE(%), BY CROP TYPE, 2022 - 2029
- Figure 24:
- SOUTH AMERICA BIOFERTILIZER MARKET, BY FORM, VOLUME, METRIC TON, 2017 - 2029
- Figure 25:
- SOUTH AMERICA BIOFERTILIZER MARKET, BY FORM, VALUE, USD, 2017 - 2029
- Figure 26:
- SOUTH AMERICA BIOFERTILIZER MARKET, VALUE SHARE(%), BY CROP TYPE, 2022 - 2029
- Figure 27:
- SOUTH AMERICA BIOFERTILIZER MARKET, BY CROP TYPE, VOLUME, METRIC TON, 2017 - 2029
- Figure 28:
- SOUTH AMERICA BIOFERTILIZER MARKET, BY CROP TYPE, VALUE, USD, 2017 - 2029
- Figure 29:
- SOUTH AMERICA BIOFERTILIZER MARKET, VOLUME SHARE(%), BY CROP TYPE, 2017 - 2029
- Figure 30:
- SOUTH AMERICA BIOFERTILIZER MARKET, VALUE SHARE(%), BY CROP TYPE, 2017 - 2029
- Figure 31:
- SOUTH AMERICA BIOFERTILIZER MARKET, BY CROP TYPE, VOLUME, METRIC TON, 2017 - 2029
- Figure 32:
- SOUTH AMERICA BIOFERTILIZER MARKET, BY CROP TYPE, VALUE, USD, 2017 - 2029
- Figure 33:
- SOUTH AMERICA BIOFERTILIZER MARKET, VALUE SHARE(%), BY FORM, 2022 - 2029
- Figure 34:
- SOUTH AMERICA BIOFERTILIZER MARKET, BY CROP TYPE, VOLUME, METRIC TON, 2017 - 2029
- Figure 35:
- SOUTH AMERICA BIOFERTILIZER MARKET, BY CROP TYPE, VALUE, USD, 2017 - 2029
- Figure 36:
- SOUTH AMERICA BIOFERTILIZER MARKET, VALUE SHARE(%), BY FORM, 2022 - 2029
- Figure 37:
- SOUTH AMERICA BIOFERTILIZER MARKET, BY CROP TYPE, VOLUME, METRIC TON, 2017 - 2029
- Figure 38:
- SOUTH AMERICA BIOFERTILIZER MARKET, BY CROP TYPE, VALUE, USD, 2017 - 2029
- Figure 39:
- SOUTH AMERICA BIOFERTILIZER MARKET, VALUE SHARE(%), BY FORM, 2022 - 2029
- Figure 40:
- SOUTH AMERICA BIOFERTILIZER MARKET, BY COUNTRY, VOLUME, METRIC TON, 2017 - 2029
- Figure 41:
- SOUTH AMERICA BIOFERTILIZER MARKET, BY COUNTRY, VALUE, USD, 2017 - 2029
- Figure 42:
- SOUTH AMERICA BIOFERTILIZER MARKET, VOLUME SHARE(%), BY COUNTRY, 2017 - 2029
- Figure 43:
- SOUTH AMERICA BIOFERTILIZER MARKET, VALUE SHARE(%), BY COUNTRY, 2017 - 2029
- Figure 44:
- SOUTH AMERICA BIOFERTILIZER MARKET, BY COUNTRY, VOLUME, METRIC TON, 2017 - 2029
- Figure 45:
- SOUTH AMERICA BIOFERTILIZER MARKET, BY COUNTRY, VALUE, USD, 2017 - 2029
- Figure 46:
- SOUTH AMERICA BIOFERTILIZER MARKET, VALUE SHARE(%), BY FORM, 2022 - 2029
- Figure 47:
- SOUTH AMERICA BIOFERTILIZER MARKET, BY COUNTRY, VOLUME, METRIC TON, 2017 - 2029
- Figure 48:
- SOUTH AMERICA BIOFERTILIZER MARKET, BY COUNTRY, VALUE, USD, 2017 - 2029
- Figure 49:
- SOUTH AMERICA BIOFERTILIZER MARKET, VALUE SHARE(%), BY FORM, 2022 - 2029
- Figure 50:
- SOUTH AMERICA BIOFERTILIZER MARKET, BY COUNTRY, VOLUME, METRIC TON, 2017 - 2029
- Figure 51:
- SOUTH AMERICA BIOFERTILIZER MARKET, BY COUNTRY, VALUE, USD, 2017 - 2029
- Figure 52:
- SOUTH AMERICA BIOFERTILIZER MARKET, VALUE SHARE(%), BY FORM, 2022 - 2029
- Figure 53:
- SOUTH AMERICA BIOFERTILIZER MARKET, MOST ACTIVE COMPANIES, BY NUMBER OF STRATEGIC MOVES, 2017-2022
- Figure 54:
- SOUTH AMERICA BIOFERTILIZER MARKET, MOST ADOPTED STRATEGIES, 2017-2022
- Figure 55:
- SOUTH AMERICA BIOFERTILIZER MARKET SHARE(%), BY MAJOR PLAYERS, 2022
South America Biofertilizer Industry Segmentation
Azospirillum, Azotobacter, Mycorrhiza, Phosphate Solubilizing Bacteria, Rhizobium are covered as segments by Form. Cash Crops, Horticultural Crops, Row Crops are covered as segments by Crop Type. Argentina, Brazil are covered as segments by Country.| Form | |
| Azospirillum | |
| Azotobacter | |
| Mycorrhiza | |
| Phosphate Solubilizing Bacteria | |
| Rhizobium | |
| Other Biofertilizers |
| Crop Type | |
| Cash Crops | |
| Horticultural Crops | |
| Row Crops |
| Country | |
| Argentina | |
| Brazil | |
| Rest Of South America |
Market Definition
- AVERAGE DOSAGE RATE - This refers to the average volume of biofertilizers applied per hectare of farmland in the respective region/country.
- CROP TYPE - Row Crops: Cereals, Pulses, Oilseeds, and Forage Crops Horticulture: Fruits, and Vegetables, Cash Crops: Plantation Crops and Spices.
- FUNCTIONS - Biofertilizer
- MARKET ESTIMATION LEVEL - Market Estimations for various types of biofertilizers fertilizers has been done at the product-level.
Research Methodology
Mordor Intelligence follows a four-step methodology in all our reports.
- Step-1: Identify Key Variables: In order to build a robust forecasting methodology, the variables and factors identified in Step-1 are tested against available historical market numbers. Through an iterative process, the variables required for market forecast are set and the model is built on the basis of these variables.
- Step-2: Build a Market Model: Market-size estimations for the forecast years are in nominal terms. Inflation is not a part of the pricing, and the average selling price (ASP) is kept constant throughout the forecast period.
- Step-3: Validate and Finalize: In this important step, all market numbers, variables and analyst calls are validated through an extensive network of primary research experts from the market studied. The respondents are selected across levels and functions to generate a holistic picture of the market studied.
- Step-4: Research Outputs: Syndicated Reports, Custom Consulting Assignments, Databases & Subscription Platforms.


