South America Biostimulants Market Size

| Icons | Lable | Value |
|---|---|---|
|
|
Study Period | 2017 - 2029 |
|
|
Base Year For Estimation | 2022 |
|
|
CAGR | 11.23 % |
|
|
Largest Share by Form | Seaweed Extracts |
|
|
Largest Share by Country | Brazil |
|
|
Market Concentration | High |
Major Players |
||
|
|
||
|
*Disclaimer: Major Players sorted in no particular order |
South America Biostimulants Market Analysis
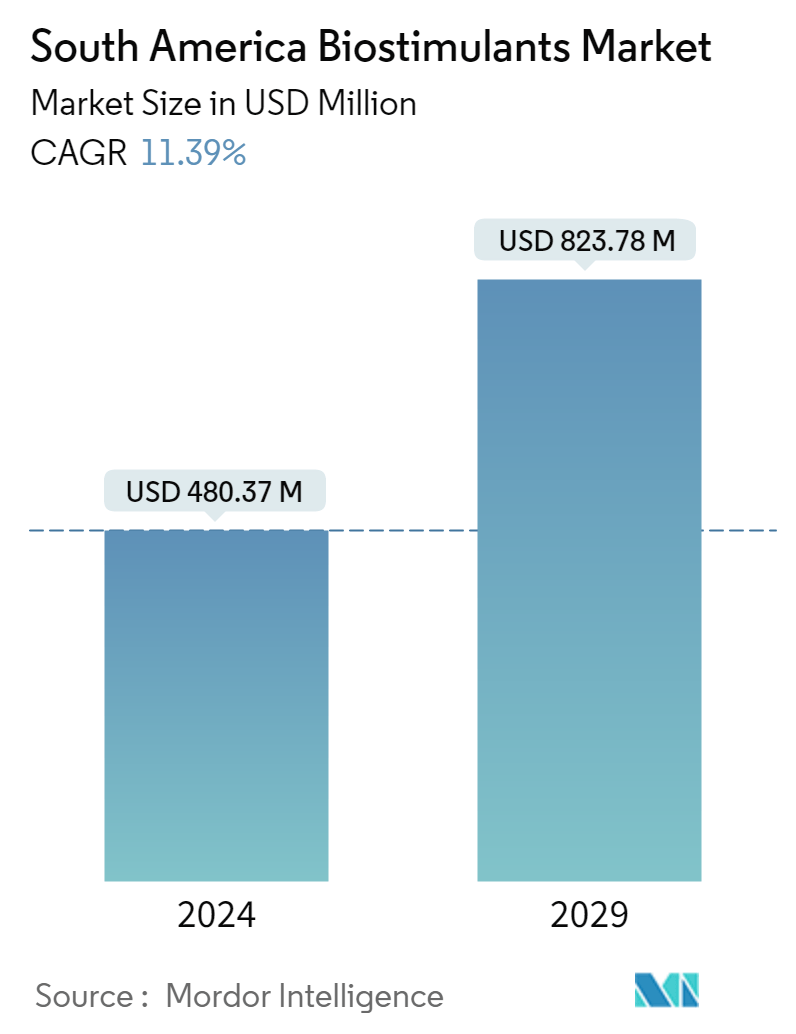
The South America Biostimulants Market is projected to register a CAGR of 11.23%
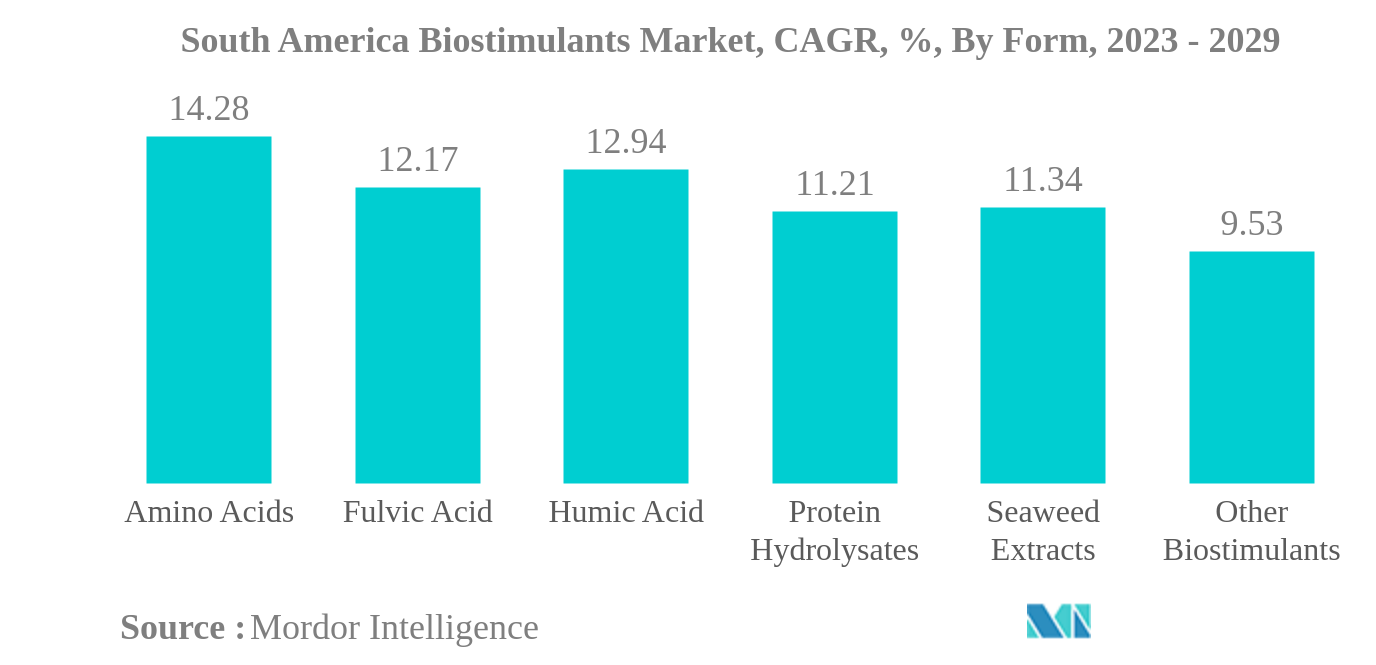
- Seaweed Extracts is the Largest Form : Seaweed extract biostimulants shows beneficial effects on plants increases overall plant growth and productivity and increases resistance to biotic and abiotic stresses.
- Amino Acids is the Fastest-growing Form : Amino acids plays important role in enhancing plant productivity especially, under stress conditions. Row crops dominated the amino acids market with a share of 82.7% in 2022.
- Row Crops is the Largest Crop Type : The major row crops cultivated include Barley, Corn, Rice, Sorghum, Soybean, Sunflower, and Wheat. In 2022, field crops having 2.3 lakh hectares Organic acreage.
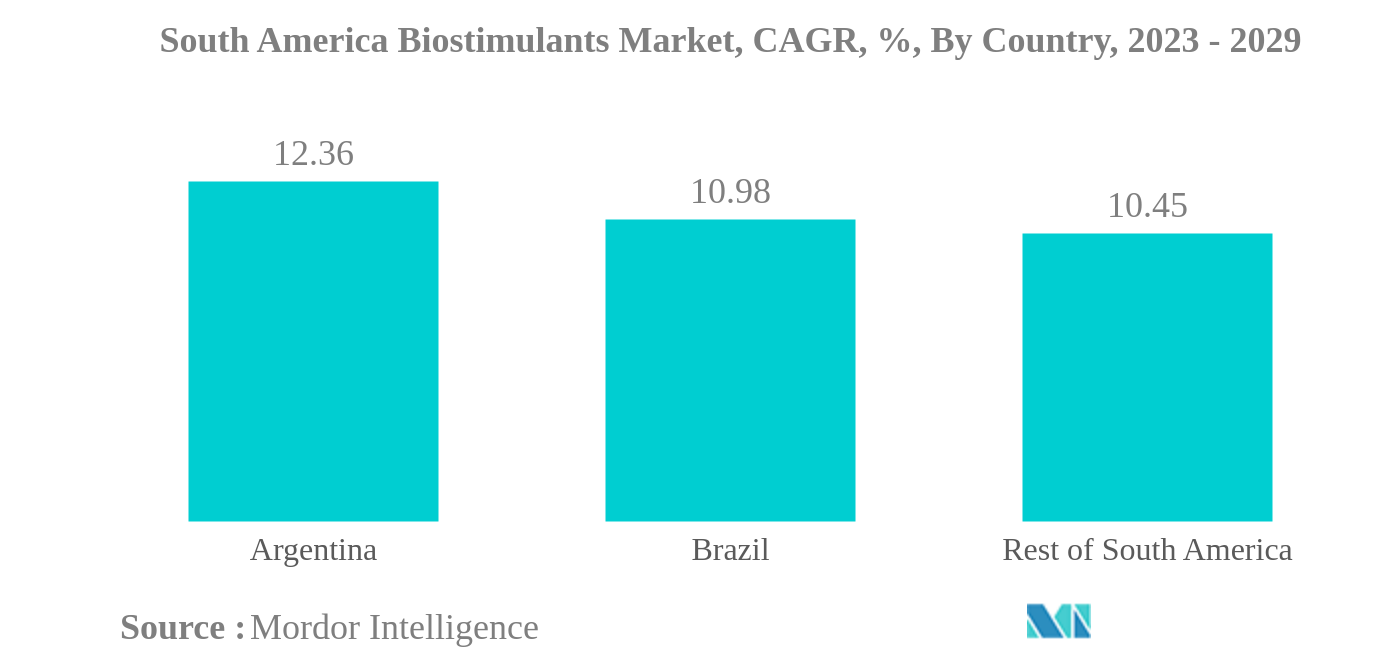
- Brazil is the Largest Country : In Brazil, cash crops holding more organic acreage share accounted for about 86.1% in 2022. Cotton, Sugarcane, and coffee are the major cash crops grown in the country.
South America Biostimulants Market Trends
This section covers the major market trends shaping the South America Biostimulants Market according to our research experts:
Seaweed Extracts is the largest Form
- In the South American biostimulant market, many biostimulants are used as active ingredients, including humic acids, fulvic acids, amino acids, protein hydrolysates, seaweed extracts, chitosan, biopolymers, and other biostimulants such as plant and animal derivatives. Between 2017 and 2022, the value of the biostimulants market in the region increased by 21.4%.
- The extreme crop stress of Argentina's historic drought season helped demonstrate the powerful effects of biostimulants under difficult growing conditions for corn and soybean. Row crops accounted for 78.3% of the biostimulants market value in 2022. This is due to row crops accounting for approximately 82.3% of the total organic crop area in the region in 2022. Cash crops and horticultural crops accounted for 16.1% and 5.6% of total biostimulants, respectively.
- In South America, seaweed extract biostimulants held the largest market share, amounting to 51.8% in 2022. With a consumption volume of 26.5 thousand metric tons, the segment was worth USD 199.9 million in 2022. This is due to their ability to improve overall plant health, stress tolerance, root growth, nutrition and water intake, plant growth, and crop yield. Seaweed extracts improve the nutrient uptake and translocation in crops such as maize, oilseed, rapeseed, tomato, wheat, and soybean.
- Amino acids are the second most consumed biostimulants in the region, with consumption increasing by 20.9% between 2017 and 2022, from 9.2 thousand metric tons in 2017 to 11.2 thousand metric tons in 2022, owing primarily to the region's increasing trend toward sustainable or organic agriculture. The biostimulants market value is anticipated to grow by 89.4% between 2023 and 2029.
Brazil is the largest Country
- The South American biostimulants market is experiencing significant growth, driven by the region's focus on low-carbon agriculture and the need to feed a growing global population. The usage of both microbial and non-microbial biostimulants in agriculture can lead to substantial reductions in greenhouse gas emissions, making it a top priority for South American nations.
- Brazil is the largest market for biostimulants in the region, accounting for 64% of the market share. However, the expansion of agriculture for commodity production has resulted in severe erosion of arable land. To address this issue, Brazil aims to meet the United Nations' soil restoration goal well before 2030 by inoculating degraded lands with beneficial soil microbes, including more effective biostimulants.
- Argentina is a leading country in terms of organic food production in South America, with major organic exports, including cereals, oilseeds, fruits, and sugarcane. The rise in domestic and international demand for organic products is driving the growth of the biostimulants market in the country, which is expected to register a CAGR of 12.52% during the forecast period.
- The growing awareness among farmers in the region about the benefits of organic agriculture is another factor driving the market growth of organic inputs such as biostimulants. Farmers are considering organic agriculture as an alternative to maintain and protect their local resources and avoid damage to the environment. The biostimulants market in South America is projected to register a CAGR of 10.8% during the forecast period (2023-2029), indicating significant potential for the region's agriculture industry.
South America Biostimulants Industry Overview
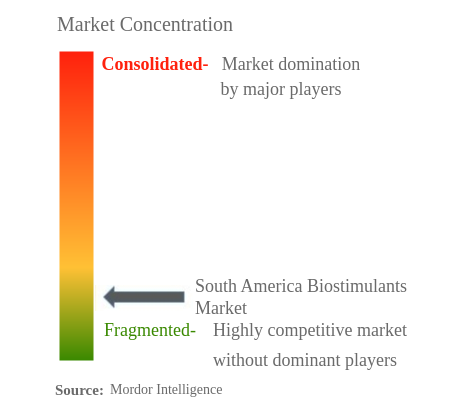
The South America Biostimulants Market is fragmented, with the top five companies occupying 7.24%. The major players in this market are Biolchim SpA, Humic Growth Solutions Inc., Koppert Biological Systems Inc., Trade Corporation International and Vittia Group (sorted alphabetically).
South America Biostimulants Market Leaders
Biolchim SpA
Humic Growth Solutions Inc.
Koppert Biological Systems Inc.
Trade Corporation International
Vittia Group
*Disclaimer: Major Players sorted in no particular order
South America Biostimulants Market News
- February 2022: Plant Response was acquired by The Mosaic Company, which is a global fertilizer manufacturer. This acquisition strengthens the company's global presence and helps develop new products and solutions for the customers sustainably.
- September 2021: Tradecorp launched Biimore worldwide, a biostimulant obtained from a plant fermentation process. Biimore comprises a unique combination of primary and secondary compounds, L-α amino acids, vitamins, sugars, and traces of other natural compounds.
- January 2021: Atlántica Agrícola developed Micomix, a biostimulant composed primarily of mycorrhizal fungi, rhizobacteria, and chelated micronutrients. The presence and development of these microorganisms in the rhizosphere create a symbiotic relationship with the plant that favors the absorption of water and mineral nutrients and increases its tolerance to water and salt stress.
South America Biostimulants Market Report - Table of Contents
1. INTRODUCTION
1.1. Study Assumptions & Market Definition
1.2. Scope of the Study
1.3. Research Methodology
2. KEY INDUSTRY TRENDS
2.1. Area Under Organic Cultivation
2.2. Per Capita Spending On Organic Products
2.3. Regulatory Framework
2.4. Value Chain & Distribution Channel Analysis
3. MARKET SEGMENTATION
3.1. Form
3.1.1. Amino Acids
3.1.2. Fulvic Acid
3.1.3. Humic Acid
3.1.4. Protein Hydrolysates
3.1.5. Seaweed Extracts
3.1.6. Other Biostimulants
3.2. Crop Type
3.2.1. Cash Crops
3.2.2. Horticultural Crops
3.2.3. Row Crops
3.3. Country
3.3.1. Argentina
3.3.2. Brazil
3.3.3. Rest Of South America
4. COMPETITIVE LANDSCAPE
4.1. Key Strategic Moves
4.2. Market Share Analysis
4.3. Company Landscape
4.4. Company Profiles
4.4.1. Atlántica Agrícola
4.4.2. Biolchim SpA
4.4.3. Haifa Group
4.4.4. Humic Growth Solutions Inc.
4.4.5. Koppert Biological Systems Inc.
4.4.6. Plant Response Biotech Inc.
4.4.7. Sigma Agriscience LLC
4.4.8. Trade Corporation International
4.4.9. Valagro
4.4.10. Vittia Group
5. KEY STRATEGIC QUESTIONS FOR AGRICULTURAL BIOLOGICALS CEOS
6. APPENDIX
6.1. Global Overview
6.1.1. Overview
6.1.2. Porter’s Five Forces Framework
6.1.3. Global Value Chain Analysis
6.1.4. Market Dynamics (DROs)
6.2. Sources & References
6.3. List of Tables & Figures
6.4. Primary Insights
6.5. Data Pack
6.6. Glossary of Terms
List of Tables & Figures
- Figure 1:
- SOUTH AMERICA BIOSTIMULANTS MARKET, AREA UNDER ORGANIC CULTIVATION, HECTARES, 2017 - 2022
- Figure 2:
- SOUTH AMERICA BIOSTIMULANTS MARKET, PER CAPITA SPENDING ON ORGANIC PRODUCTS, USD, 2017 - 2022
- Figure 3:
- SOUTH AMERICA BIOSTIMULANTS MARKET, VOLUME, METRIC TON, 2017 - 2029
- Figure 4:
- SOUTH AMERICA BIOSTIMULANTS MARKET, VALUE, USD, 2017 - 2029
- Figure 5:
- SOUTH AMERICA BIOSTIMULANTS MARKET, BY FORM, VOLUME, METRIC TON, 2017 - 2029
- Figure 6:
- SOUTH AMERICA BIOSTIMULANTS MARKET, BY FORM, VALUE, USD, 2017 - 2029
- Figure 7:
- SOUTH AMERICA BIOSTIMULANTS MARKET, VOLUME SHARE(%), BY FORM, 2017 - 2029
- Figure 8:
- SOUTH AMERICA BIOSTIMULANTS MARKET, VALUE SHARE(%), BY FORM, 2017 - 2029
- Figure 9:
- SOUTH AMERICA BIOSTIMULANTS MARKET, BY FORM, VOLUME, METRIC TON, 2017 - 2029
- Figure 10:
- SOUTH AMERICA BIOSTIMULANTS MARKET, BY FORM, VALUE, USD, 2017 - 2029
- Figure 11:
- SOUTH AMERICA BIOSTIMULANTS MARKET, VALUE SHARE(%), BY CROP TYPE, 2022 - 2029
- Figure 12:
- SOUTH AMERICA BIOSTIMULANTS MARKET, BY FORM, VOLUME, METRIC TON, 2017 - 2029
- Figure 13:
- SOUTH AMERICA BIOSTIMULANTS MARKET, BY FORM, VALUE, USD, 2017 - 2029
- Figure 14:
- SOUTH AMERICA BIOSTIMULANTS MARKET, VALUE SHARE(%), BY CROP TYPE, 2022 - 2029
- Figure 15:
- SOUTH AMERICA BIOSTIMULANTS MARKET, BY FORM, VOLUME, METRIC TON, 2017 - 2029
- Figure 16:
- SOUTH AMERICA BIOSTIMULANTS MARKET, BY FORM, VALUE, USD, 2017 - 2029
- Figure 17:
- SOUTH AMERICA BIOSTIMULANTS MARKET, VALUE SHARE(%), BY CROP TYPE, 2022 - 2029
- Figure 18:
- SOUTH AMERICA BIOSTIMULANTS MARKET, BY FORM, VOLUME, METRIC TON, 2017 - 2029
- Figure 19:
- SOUTH AMERICA BIOSTIMULANTS MARKET, BY FORM, VALUE, USD, 2017 - 2029
- Figure 20:
- SOUTH AMERICA BIOSTIMULANTS MARKET, VALUE SHARE(%), BY CROP TYPE, 2022 - 2029
- Figure 21:
- SOUTH AMERICA BIOSTIMULANTS MARKET, BY FORM, VOLUME, METRIC TON, 2017 - 2029
- Figure 22:
- SOUTH AMERICA BIOSTIMULANTS MARKET, BY FORM, VALUE, USD, 2017 - 2029
- Figure 23:
- SOUTH AMERICA BIOSTIMULANTS MARKET, VALUE SHARE(%), BY CROP TYPE, 2022 - 2029
- Figure 24:
- SOUTH AMERICA BIOSTIMULANTS MARKET, BY FORM, VOLUME, METRIC TON, 2017 - 2029
- Figure 25:
- SOUTH AMERICA BIOSTIMULANTS MARKET, BY FORM, VALUE, USD, 2017 - 2029
- Figure 26:
- SOUTH AMERICA BIOSTIMULANTS MARKET, VALUE SHARE(%), BY CROP TYPE, 2022 - 2029
- Figure 27:
- SOUTH AMERICA BIOSTIMULANTS MARKET, BY CROP TYPE, VOLUME, METRIC TON, 2017 - 2029
- Figure 28:
- SOUTH AMERICA BIOSTIMULANTS MARKET, BY CROP TYPE, VALUE, USD, 2017 - 2029
- Figure 29:
- SOUTH AMERICA BIOSTIMULANTS MARKET, VOLUME SHARE(%), BY CROP TYPE, 2017 - 2029
- Figure 30:
- SOUTH AMERICA BIOSTIMULANTS MARKET, VALUE SHARE(%), BY CROP TYPE, 2017 - 2029
- Figure 31:
- SOUTH AMERICA BIOSTIMULANTS MARKET, BY CROP TYPE, VOLUME, METRIC TON, 2017 - 2029
- Figure 32:
- SOUTH AMERICA BIOSTIMULANTS MARKET, BY CROP TYPE, VALUE, USD, 2017 - 2029
- Figure 33:
- SOUTH AMERICA BIOSTIMULANTS MARKET, VALUE SHARE(%), BY FORM, 2022 - 2029
- Figure 34:
- SOUTH AMERICA BIOSTIMULANTS MARKET, BY CROP TYPE, VOLUME, METRIC TON, 2017 - 2029
- Figure 35:
- SOUTH AMERICA BIOSTIMULANTS MARKET, BY CROP TYPE, VALUE, USD, 2017 - 2029
- Figure 36:
- SOUTH AMERICA BIOSTIMULANTS MARKET, VALUE SHARE(%), BY FORM, 2022 - 2029
- Figure 37:
- SOUTH AMERICA BIOSTIMULANTS MARKET, BY CROP TYPE, VOLUME, METRIC TON, 2017 - 2029
- Figure 38:
- SOUTH AMERICA BIOSTIMULANTS MARKET, BY CROP TYPE, VALUE, USD, 2017 - 2029
- Figure 39:
- SOUTH AMERICA BIOSTIMULANTS MARKET, VALUE SHARE(%), BY FORM, 2022 - 2029
- Figure 40:
- SOUTH AMERICA BIOSTIMULANTS MARKET, BY COUNTRY, VOLUME, METRIC TON, 2017 - 2029
- Figure 41:
- SOUTH AMERICA BIOSTIMULANTS MARKET, BY COUNTRY, VALUE, USD, 2017 - 2029
- Figure 42:
- SOUTH AMERICA BIOSTIMULANTS MARKET, VOLUME SHARE(%), BY COUNTRY, 2017 - 2029
- Figure 43:
- SOUTH AMERICA BIOSTIMULANTS MARKET, VALUE SHARE(%), BY COUNTRY, 2017 - 2029
- Figure 44:
- SOUTH AMERICA BIOSTIMULANTS MARKET, BY COUNTRY, VOLUME, METRIC TON, 2017 - 2029
- Figure 45:
- SOUTH AMERICA BIOSTIMULANTS MARKET, BY COUNTRY, VALUE, USD, 2017 - 2029
- Figure 46:
- SOUTH AMERICA BIOSTIMULANTS MARKET, VALUE SHARE(%), BY FORM, 2022 - 2029
- Figure 47:
- SOUTH AMERICA BIOSTIMULANTS MARKET, BY COUNTRY, VOLUME, METRIC TON, 2017 - 2029
- Figure 48:
- SOUTH AMERICA BIOSTIMULANTS MARKET, BY COUNTRY, VALUE, USD, 2017 - 2029
- Figure 49:
- SOUTH AMERICA BIOSTIMULANTS MARKET, VALUE SHARE(%), BY FORM, 2022 - 2029
- Figure 50:
- SOUTH AMERICA BIOSTIMULANTS MARKET, BY COUNTRY, VOLUME, METRIC TON, 2017 - 2029
- Figure 51:
- SOUTH AMERICA BIOSTIMULANTS MARKET, BY COUNTRY, VALUE, USD, 2017 - 2029
- Figure 52:
- SOUTH AMERICA BIOSTIMULANTS MARKET, VALUE SHARE(%), BY FORM, 2022 - 2029
- Figure 53:
- SOUTH AMERICA BIOSTIMULANTS MARKET, MOST ACTIVE COMPANIES, BY NUMBER OF STRATEGIC MOVES, 2017-2022
- Figure 54:
- SOUTH AMERICA BIOSTIMULANTS MARKET, MOST ADOPTED STRATEGIES, 2017-2022
- Figure 55:
- SOUTH AMERICA BIOSTIMULANTS MARKET SHARE(%), BY MAJOR PLAYERS, 2022
South America Biostimulants Industry Segmentation
Amino Acids, Fulvic Acid, Humic Acid, Protein Hydrolysates, Seaweed Extracts are covered as segments by Form. Cash Crops, Horticultural Crops, Row Crops are covered as segments by Crop Type. Argentina, Brazil are covered as segments by Country.| Form | |
| Amino Acids | |
| Fulvic Acid | |
| Humic Acid | |
| Protein Hydrolysates | |
| Seaweed Extracts | |
| Other Biostimulants |
| Crop Type | |
| Cash Crops | |
| Horticultural Crops | |
| Row Crops |
| Country | |
| Argentina | |
| Brazil | |
| Rest Of South America |
Market Definition
- AVERAGE DOSAGE RATE - This refers to the average volume of biostimulants applied per hectare of farmland in the respective region/country.
- CROP TYPE - Row Crops: Cereals, Pulses, Oilseeds, and Forage Crops Horticulture: Fruits, and Vegetables, Cash Crops: Plantation Crops and Spices.
- FUNCTIONS - Biostimulants
- MARKET ESTIMATION LEVEL - Market Estimations for various types of biostimulants has been done at the product-level.
Research Methodology
Mordor Intelligence follows a four-step methodology in all our reports.
- Step-1: Identify Key Variables: In order to build a robust forecasting methodology, the variables and factors identified in Step-1 are tested against available historical market numbers. Through an iterative process, the variables required for market forecast are set and the model is built on the basis of these variables.
- Step-2: Build a Market Model: Market-size estimations for the forecast years are in nominal terms. Inflation is not a part of the pricing, and the average selling price (ASP) is kept constant throughout the forecast period.
- Step-3: Validate and Finalize: In this important step, all market numbers, variables and analyst calls are validated through an extensive network of primary research experts from the market studied. The respondents are selected across levels and functions to generate a holistic picture of the market studied.
- Step-4: Research Outputs: Syndicated Reports, Custom Consulting Assignments, Databases & Subscription Platforms.


