South America Engineering Plastics Market Size

| Icons | Lable | Value |
|---|---|---|
|
|
Study Period | 2017 - 2029 |
|
|
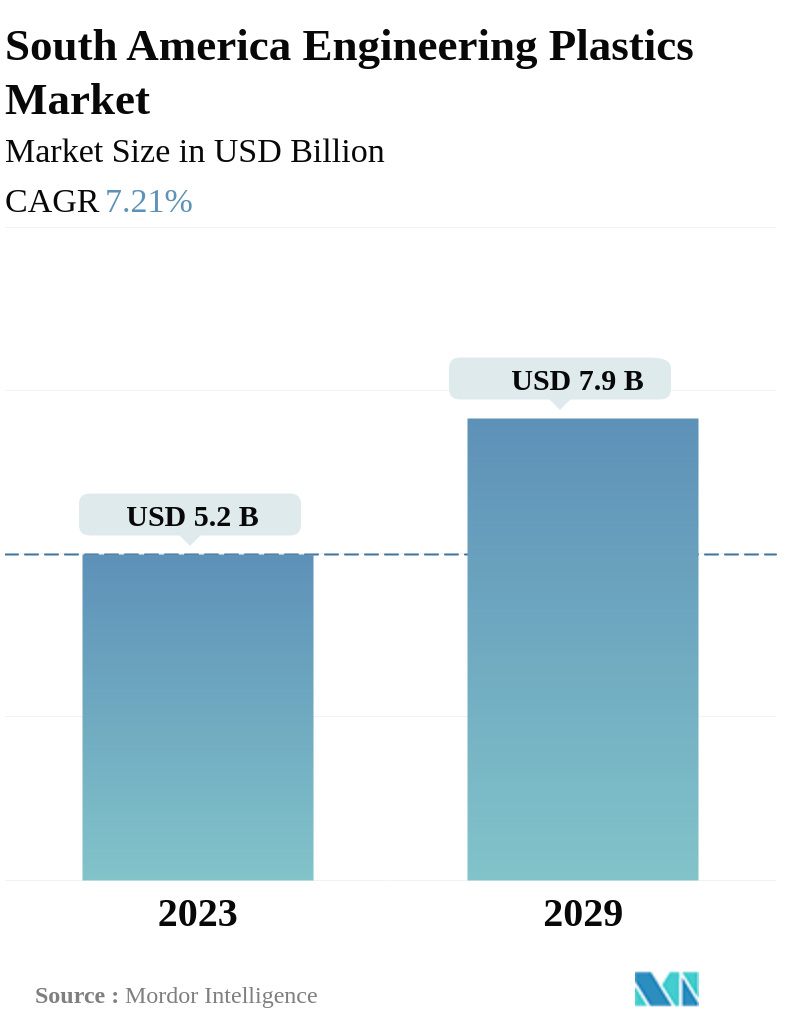
Market Size (2029) | USD 7.9 Billion |
|
|
Market Size (2023) | USD 5.2 Billion |
|
|
Largest Share by End User Industry | Packaging |
|
|
CAGR (2023 - 2029) | 7.21 % |
|
|
Largest Share by Country | Brazil |
Major Players |
||
|
|
||
|
*Disclaimer: Major Players sorted in no particular order |
South America Engineering Plastics Market Analysis
The South America Engineering Plastics Market is projected to register a CAGR of 7.21%
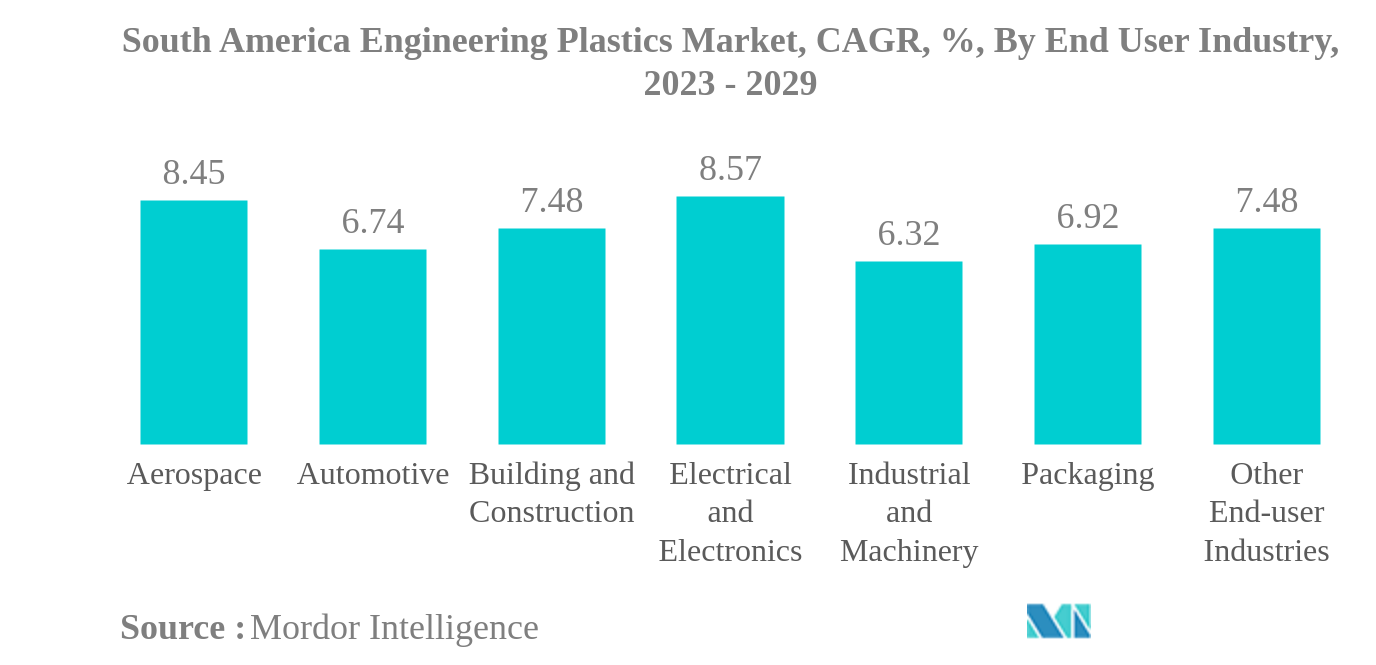
- Packaging is the Largest End User Industry. Due to the wide range of applications, including bottles, jars, and containers, specifically in the food and beverage industry, the packaging segment occupied the major share.
- Electrical and Electronics is the Fastest-growing End User Industry. The electronics segment is expected to witness the fastest growth due to the superior properties of engineering plastics, such as lightweight, good impact resistance, higher flexibility, and fire resistivity.
- Polyethylene Terephthalate (PET) is the Largest Resin Type. With widespread applications in the packaging industry and the rising demand for PET sheets and films, PET resin occupies the largest market share.
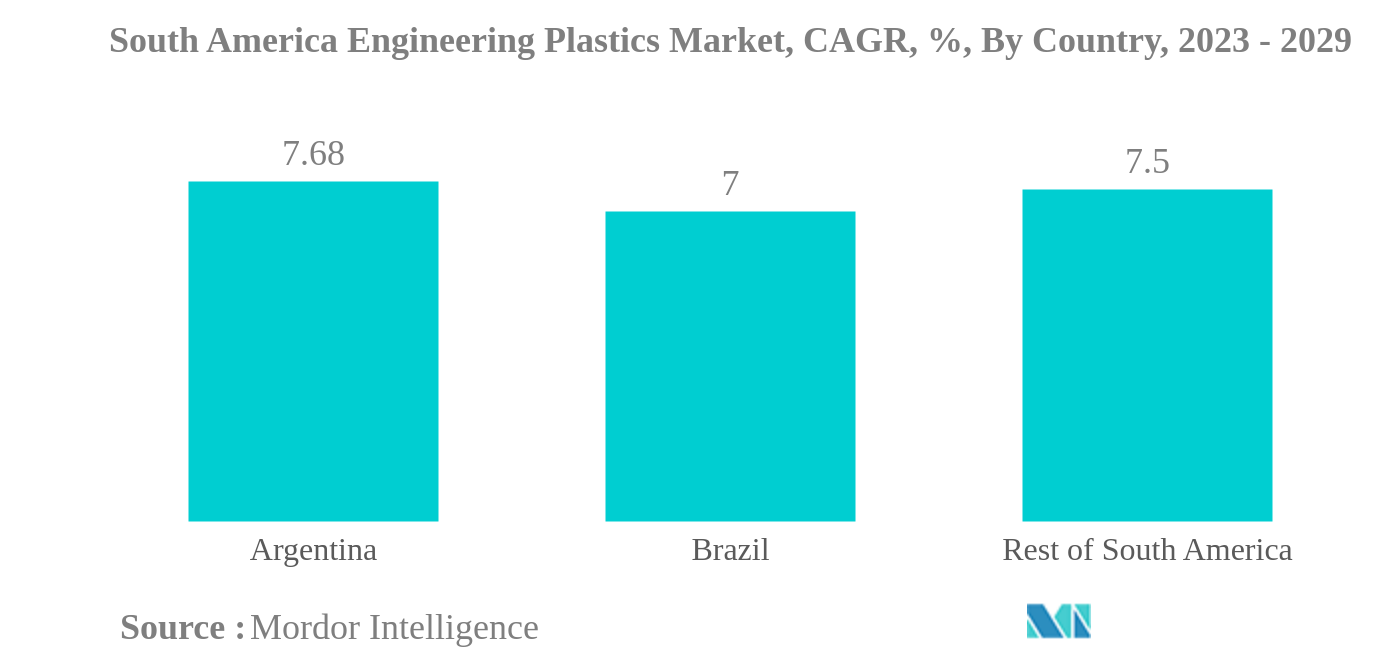
- Brazil is the Largest Country. Due to significant economic growth and escalating demand for engineering plastics in major industries, including packaging, automotive, and construction, Brazil has occupied the highest market share over the past few years.
South America Engineering Plastics Market Trends
This section covers the major market trends shaping the South America Engineering Plastics Market according to our research experts:
PACKAGING INDUSTRY TO DOMINATE THE MARKET DURING THE FORECAST PERIOD
- Engineering plastics, with their superior mechanical and thermal properties compared to common or commodity plastics, have endless applications. They have replaced metals and other traditionally used materials in various application areas, such as automotive, aerospace, building & construction, and more.
- The packaging industry is the largest consumer of engineering plastics. Packaging made from engineering plastics comes in a variety of material types and forms, including films, bottles, containers, and others, each with its own unique characteristics. These characteristics encompass temperature range, appropriate food use, shelf life, appearance, and barrier properties. Suitable for both hot and cold filling, as well as microwave reheating, engineering plastics are expected to see a CAGR of 5.13% in terms of consumption volume from this industry during the forecast period.
- The automotive industry is the second-largest consumer of engineering plastics, which have replaced expensive metals and their alloys with various types of composites, each designed for unique conditions and requirements. The industry uses high-strength engineering plastics, which not only reduces the cost of part processing, assembly, and maintenance but also makes the vehicle lighter and more energy-efficient. Brazil and Argentina have the most developed automotive industries in the region, and consumption in this industry is expected to record a CAGR of 6.74% in terms of revenue from 2023 to 2029.
- The electrical and electronics industry is projected to be the fastest-growing segment due to the increasing demand for smart electronics and advanced devices, contributing to the industry's growth. The demand in this industry is anticipated to record a CAGR of 7.74% in terms of volume during the forecast period.
BRAZIL TO REMAIN DOMINANT DURING THE FORECAST PERIOD
- South America accounted for a share of 4.56%, by revenue, of the consumption of engineering plastics globally in 2022. Engineering plastics have applications in different industries, such as automotive, packaging, electrical and electronics.
- Brazil is the largest consumer of engineering plastics and witnessed a growth of 10.18% in revenue in 2022 compared to the previous year. Brazil occupied nearly 60% and 66% volume shares of packaging and automotive production, respectively, of overall South America. With the growing demand for ready-to-eat convenience food and the emerging trend of on-the-go lifestyles, the consumption of packaging materials increased, increasing the sales of engineering plastics in the region. The surge in automobile demand is a consequence of the increasing demand for private mobility. Technological innovations are driving demand for electronic gadgets.
- Argentina is the fastest-growing consumer, led by the automotive industry, as the government legislated a new Act to promote new investments in the car-marking industry and strengthen its supply chain. This will reinforce the industry’s export-oriented profile, promoting the development of new engine technologies during the forecast period. Therefore, the demand for engineering plastics in automotive is likely to increase, registering a CAGR of 10.77%, by revenue, in the country during the forecast period.
- The consumption of engineering plastics in the region is expected to register a CAGR of 7.21% by revenue during the forecast period (2023-2029), owing to the use of advanced materials, organic electronics, miniaturization, and disruptive technologies.
South America Engineering Plastics Industry Overview
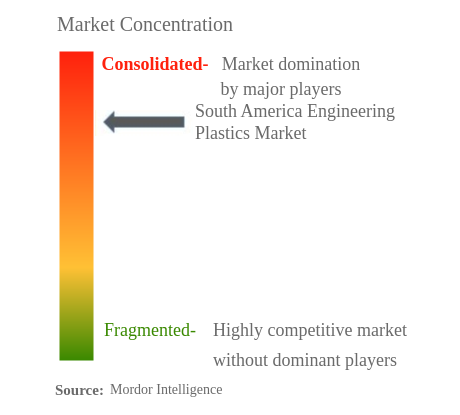
The South America Engineering Plastics Market is fairly consolidated, with the top five companies occupying 89.63%. The major players in this market are Alfa S.A.B. de C.V., BASF SE, Enka, Indorama Ventures Public Company Limited and Koch Industries, Inc. (sorted alphabetically).
South America Engineering Plastics Market Leaders
Alfa S.A.B. de C.V.
BASF SE
Enka
Indorama Ventures Public Company Limited
Koch Industries, Inc.
*Disclaimer: Major Players sorted in no particular order
South America Engineering Plastics Market News
- February 2023: Covestro AG introduced Makrolon 3638 polycarbonate for healthcare and life sciences applications such as drug delivery devices, wellness and wearable devices, and single-use containers for biopharmaceutical manufacturing.
- January 2023: UNIGEL decided to partner with MECS Inc. for the construction of a new sulfuric acid plant, which will subsequently increase the production of PMMA.
- November 2022: Celanese Corporation completed the acquisition of the Mobility & Materials (“M&M”) business of DuPont. This acquisition enhanced the company's product portfolio of engineered thermoplastics through the addition of well-recognized brands and intellectual properties of DuPont.
South America Engineering Plastics Market Report - Table of Contents
1. INTRODUCTION
1.1. Study Assumptions & Market Definition
1.2. Scope of the Study
1.3. Research Methodology
2. KEY INDUSTRY TRENDS
2.1. End User Trends
2.2. Import And Export Trends
2.3. Price Trends
2.4. Recycling Overview
2.5. Regulatory Framework
2.6. Value Chain & Distribution Channel Analysis
3. MARKET SEGMENTATION
3.1. End User Industry
3.1.1. Aerospace
3.1.2. Automotive
3.1.3. Building and Construction
3.1.4. Electrical and Electronics
3.1.5. Industrial and Machinery
3.1.6. Packaging
3.1.7. Other End-user Industries
3.2. Resin Type
3.2.1. Fluoropolymer
3.2.1.1. By Sub Resin Type
3.2.1.1.1. Ethylenetetrafluoroethylene (ETFE)
3.2.1.1.2. Fluorinated Ethylene-propylene (FEP)
3.2.1.1.3. Polytetrafluoroethylene (PTFE)
3.2.1.1.4. Polyvinylfluoride (PVF)
3.2.1.1.5. Polyvinylidene Fluoride (PVDF)
3.2.1.1.6. Other Sub Resin Types
3.2.2. Liquid Crystal Polymer (LCP)
3.2.3. Polyamide (PA)
3.2.3.1. By Sub Resin Type
3.2.3.1.1. Aramid
3.2.3.1.2. Polyamide (PA) 6
3.2.3.1.3. Polyamide (PA) 66
3.2.3.1.4. Polyphthalamide
3.2.4. Polybutylene Terephthalate (PBT)
3.2.5. Polycarbonate (PC)
3.2.6. Polyether Ether Ketone (PEEK)
3.2.7. Polyethylene Terephthalate (PET)
3.2.8. Polyimide (PI)
3.2.9. Polymethyl Methacrylate (PMMA)
3.2.10. Polyoxymethylene (POM)
3.2.11. Styrene Copolymers (ABS and SAN)
3.3. Country
3.3.1. Argentina
3.3.2. Brazil
3.3.3. Rest of South America
4. COMPETITIVE LANDSCAPE
4.1. Key Strategic Moves
4.2. Market Share Analysis
4.3. Company Landscape
4.4. Company Profiles
4.4.1. Alfa S.A.B. de C.V.
4.4.2. BASF SE
4.4.3. Celanese Corporation
4.4.4. China Petroleum & Chemical Corporation
4.4.5. Covestro AG
4.4.6. Enka
4.4.7. Formosa Plastics Group
4.4.8. Indorama Ventures Public Company Limited
4.4.9. Koch Industries, Inc.
4.4.10. LANXESS
4.4.11. Mitsubishi Chemical Corporation
4.4.12. SABIC
4.4.13. Teijin Limited
4.4.14. Trinseo
4.4.15. Unigel Plasticos
5. KEY STRATEGIC QUESTIONS FOR ENGINEERING PLASTICS CEOS
6. APPENDIX
6.1. Global Overview
6.1.1. Overview
6.1.2. Porter’s Five Forces Framework
6.1.3. Global Value Chain Analysis
6.1.4. Market Dynamics (DROs)
6.2. Sources & References
6.3. List of Tables & Figures
6.4. Primary Insights
6.5. Data Pack
6.6. Glossary of Terms
List of Tables & Figures
- Figure 1:
- SOUTH AMERICA AEROSPACE COMPONENT PRODUCTION, VALUE IN USD, 2017-2029
- Figure 2:
- SOUTH AMERICA AUTOMOBILE PRODUCTION, VOLUME IN UNITS, 2017-2029
- Figure 3:
- SOUTH AMERICA NEW CONSTRUCTION FLOOR AREA, IN SQUARE FEET, 2017-2029
- Figure 4:
- SOUTH AMERICA ELECTRICAL AND ELECTRONICS PRODUCTION, VALUE IN USD, 2017-2029
- Figure 5:
- SOUTH AMERICA PLASTIC PACKAGING PRODUCTION, VOLUME IN TONS, 2017-2029
- Figure 6:
- SOUTH AMERICA FLUOROPOLYMER TRADE IMPORT TRENDS, BY TOP COUNTRIES, VALUE IN USD, 2017-2021
- Figure 7:
- SOUTH AMERICA FLUOROPOLYMER TRADE EXPORT TRENDS, BY TOP COUNTRIES, VALUE IN USD, 2017-2021
- Figure 8:
- SOUTH AMERICA POLYAMIDE (PA) TRADE IMPORT TRENDS, BY TOP COUNTRIES, VALUE IN USD, 2017-2021
- Figure 9:
- SOUTH AMERICA POLYAMIDE (PA) TRADE EXPORT TRENDS, BY TOP COUNTRIES, VALUE IN USD, 2017-2021
- Figure 10:
- SOUTH AMERICA POLYCARBONATE (PC) TRADE IMPORT TRENDS, BY TOP COUNTRIES, VALUE IN USD, 2017-2021
- Figure 11:
- SOUTH AMERICA POLYCARBONATE (PC) TRADE EXPORT TRENDS, BY TOP COUNTRIES, VALUE IN USD, 2017-2021
- Figure 12:
- SOUTH AMERICA POLYETHYLENE TEREPHTHALATE (PET) TRADE IMPORT TRENDS, BY TOP COUNTRIES, VALUE IN USD, 2017-2021
- Figure 13:
- SOUTH AMERICA POLYETHYLENE TEREPHTHALATE (PET) TRADE EXPORT TRENDS, BY TOP COUNTRIES, VALUE IN USD, 2017-2021
- Figure 14:
- SOUTH AMERICA POLYMETHYL METHACRYLATE (PMMA) TRADE IMPORT TRENDS, BY TOP COUNTRIES, VALUE IN USD, 2017-2021
- Figure 15:
- SOUTH AMERICA POLYMETHYL METHACRYLATE (PMMA) TRADE EXPORT TRENDS, BY TOP COUNTRIES, VALUE IN USD, 2017-2021
- Figure 16:
- SOUTH AMERICA POLYOXYMETHYLENE (POM) TRADE IMPORT TRENDS, BY TOP COUNTRIES, VALUE IN USD, 2017-2021
- Figure 17:
- SOUTH AMERICA POLYOXYMETHYLENE (POM) TRADE EXPORT TRENDS, BY TOP COUNTRIES, VALUE IN USD, 2017-2021
- Figure 18:
- SOUTH AMERICA STYRENE COPOLYMERS (ABS AND SAN) TRADE IMPORT TRENDS, BY TOP COUNTRIES, VALUE IN USD, 2017-2021
- Figure 19:
- SOUTH AMERICA STYRENE COPOLYMERS (ABS AND SAN) TRADE EXPORT TRENDS, BY TOP COUNTRIES, VALUE IN USD, 2017-2021
- Figure 20:
- BRAZIL ENGINEERING PLASTICS MARKET, PRICE TRENDS, BY RESIN TYPE, USD PER KG, 2017-2021
- Figure 21:
- ARGENTINA ENGINEERING PLASTICS MARKET, PRICE TRENDS, BY RESIN TYPE, USD PER KG, 2017-2021
- Figure 22:
- SOUTH AMERICA ENGINEERING PLASTICS MARKET, VOLUME, TONS, 2017 - 2029
- Figure 23:
- SOUTH AMERICA ENGINEERING PLASTICS MARKET, VALUE, USD, 2017 - 2029
- Figure 24:
- SOUTH AMERICA ENGINEERING PLASTICS MARKET, BY END USER INDUSTRY, VOLUME, TONS, 2017 - 2029
- Figure 25:
- SOUTH AMERICA ENGINEERING PLASTICS MARKET, BY END USER INDUSTRY, VALUE, USD, 2017 - 2029
- Figure 26:
- SOUTH AMERICA ENGINEERING PLASTICS MARKET, BY END USER INDUSTRY, VOLUME SHARE(%), 2017 - 2029
- Figure 27:
- SOUTH AMERICA ENGINEERING PLASTICS MARKET, BY END USER INDUSTRY, VALUE SHARE(%), 2017 - 2029
- Figure 28:
- SOUTH AMERICA ENGINEERING PLASTICS MARKET, AEROSPACE, VOLUME, TONS, 2017 - 2029
- Figure 29:
- SOUTH AMERICA ENGINEERING PLASTICS MARKET, AEROSPACE, VALUE, USD, 2017 - 2029
- Figure 30:
- SOUTH AMERICA ENGINEERING PLASTICS MARKET, AEROSPACE, BY RESIN TYPE, VALUE SHARE(%), 2022 VS 2029
- Figure 31:
- SOUTH AMERICA ENGINEERING PLASTICS MARKET, AUTOMOTIVE, VOLUME, TONS, 2017 - 2029
- Figure 32:
- SOUTH AMERICA ENGINEERING PLASTICS MARKET, AUTOMOTIVE, VALUE, USD, 2017 - 2029
- Figure 33:
- SOUTH AMERICA ENGINEERING PLASTICS MARKET, AUTOMOTIVE, BY RESIN TYPE, VALUE SHARE(%), 2022 VS 2029
- Figure 34:
- SOUTH AMERICA ENGINEERING PLASTICS MARKET, BUILDING AND CONSTRUCTION, VOLUME, TONS, 2017 - 2029
- Figure 35:
- SOUTH AMERICA ENGINEERING PLASTICS MARKET, BUILDING AND CONSTRUCTION, VALUE, USD, 2017 - 2029
- Figure 36:
- SOUTH AMERICA ENGINEERING PLASTICS MARKET, BUILDING AND CONSTRUCTION, BY RESIN TYPE, VALUE SHARE(%), 2022 VS 2029
- Figure 37:
- SOUTH AMERICA ENGINEERING PLASTICS MARKET, ELECTRICAL AND ELECTRONICS, VOLUME, TONS, 2017 - 2029
- Figure 38:
- SOUTH AMERICA ENGINEERING PLASTICS MARKET, ELECTRICAL AND ELECTRONICS, VALUE, USD, 2017 - 2029
- Figure 39:
- SOUTH AMERICA ENGINEERING PLASTICS MARKET, ELECTRICAL AND ELECTRONICS, BY RESIN TYPE, VALUE SHARE(%), 2022 VS 2029
- Figure 40:
- SOUTH AMERICA ENGINEERING PLASTICS MARKET, INDUSTRIAL AND MACHINERY, VOLUME, TONS, 2017 - 2029
- Figure 41:
- SOUTH AMERICA ENGINEERING PLASTICS MARKET, INDUSTRIAL AND MACHINERY, VALUE, USD, 2017 - 2029
- Figure 42:
- SOUTH AMERICA ENGINEERING PLASTICS MARKET, INDUSTRIAL AND MACHINERY, BY RESIN TYPE, VALUE SHARE(%), 2022 VS 2029
- Figure 43:
- SOUTH AMERICA ENGINEERING PLASTICS MARKET, PACKAGING, VOLUME, TONS, 2017 - 2029
- Figure 44:
- SOUTH AMERICA ENGINEERING PLASTICS MARKET, PACKAGING, VALUE, USD, 2017 - 2029
- Figure 45:
- SOUTH AMERICA ENGINEERING PLASTICS MARKET, PACKAGING, BY RESIN TYPE, VALUE SHARE(%), 2022 VS 2029
- Figure 46:
- SOUTH AMERICA ENGINEERING PLASTICS MARKET, OTHER END-USER INDUSTRIES, VOLUME, TONS, 2017 - 2029
- Figure 47:
- SOUTH AMERICA ENGINEERING PLASTICS MARKET, OTHER END-USER INDUSTRIES, VALUE, USD, 2017 - 2029
- Figure 48:
- SOUTH AMERICA ENGINEERING PLASTICS MARKET, OTHER END-USER INDUSTRIES, BY RESIN TYPE, VALUE SHARE(%), 2022 VS 2029
- Figure 49:
- SOUTH AMERICA ENGINEERING PLASTICS MARKET, BY RESIN TYPE, VOLUME, TONS, 2017 - 2029
- Figure 50:
- SOUTH AMERICA ENGINEERING PLASTICS MARKET, BY RESIN TYPE, VALUE, USD, 2017 - 2029
- Figure 51:
- SOUTH AMERICA ENGINEERING PLASTICS MARKET, BY RESIN TYPE, VOLUME SHARE(%), 2017 - 2029
- Figure 52:
- SOUTH AMERICA ENGINEERING PLASTICS MARKET, BY RESIN TYPE, VALUE SHARE(%), 2017 - 2029
- Figure 53:
- SOUTH AMERICA ENGINEERING PLASTICS MARKET, BY SUB RESIN TYPE, VOLUME, TONS, 2017 - 2029
- Figure 54:
- SOUTH AMERICA ENGINEERING PLASTICS MARKET, BY SUB RESIN TYPE, VALUE, USD, 2017 - 2029
- Figure 55:
- SOUTH AMERICA ENGINEERING PLASTICS MARKET, BY SUB RESIN TYPE, VOLUME SHARE(%), 2017 - 2029
- Figure 56:
- SOUTH AMERICA ENGINEERING PLASTICS MARKET, BY SUB RESIN TYPE, VALUE SHARE(%), 2017 - 2029
- Figure 57:
- SOUTH AMERICA ENGINEERING PLASTICS MARKET, ETHYLENETETRAFLUOROETHYLENE (ETFE), VOLUME, TONS, 2017 - 2029
- Figure 58:
- SOUTH AMERICA ENGINEERING PLASTICS MARKET, ETHYLENETETRAFLUOROETHYLENE (ETFE), VALUE, USD, 2017 - 2029
- Figure 59:
- SOUTH AMERICA ENGINEERING PLASTICS MARKET, ETHYLENETETRAFLUOROETHYLENE (ETFE), BY END USER INDUSTRY, VALUE SHARE(%), 2022 VS 2029
- Figure 60:
- SOUTH AMERICA ENGINEERING PLASTICS MARKET, FLUORINATED ETHYLENE-PROPYLENE (FEP), VOLUME, TONS, 2017 - 2029
- Figure 61:
- SOUTH AMERICA ENGINEERING PLASTICS MARKET, FLUORINATED ETHYLENE-PROPYLENE (FEP), VALUE, USD, 2017 - 2029
- Figure 62:
- SOUTH AMERICA ENGINEERING PLASTICS MARKET, FLUORINATED ETHYLENE-PROPYLENE (FEP), BY END USER INDUSTRY, VALUE SHARE(%), 2022 VS 2029
- Figure 63:
- SOUTH AMERICA ENGINEERING PLASTICS MARKET, POLYTETRAFLUOROETHYLENE (PTFE), VOLUME, TONS, 2017 - 2029
- Figure 64:
- SOUTH AMERICA ENGINEERING PLASTICS MARKET, POLYTETRAFLUOROETHYLENE (PTFE), VALUE, USD, 2017 - 2029
- Figure 65:
- SOUTH AMERICA ENGINEERING PLASTICS MARKET, POLYTETRAFLUOROETHYLENE (PTFE), BY END USER INDUSTRY, VALUE SHARE(%), 2022 VS 2029
- Figure 66:
- SOUTH AMERICA ENGINEERING PLASTICS MARKET, POLYVINYLFLUORIDE (PVF), VOLUME, TONS, 2017 - 2029
- Figure 67:
- SOUTH AMERICA ENGINEERING PLASTICS MARKET, POLYVINYLFLUORIDE (PVF), VALUE, USD, 2017 - 2029
- Figure 68:
- SOUTH AMERICA ENGINEERING PLASTICS MARKET, POLYVINYLFLUORIDE (PVF), BY END USER INDUSTRY, VALUE SHARE(%), 2022 VS 2029
- Figure 69:
- SOUTH AMERICA ENGINEERING PLASTICS MARKET, POLYVINYLIDENE FLUORIDE (PVDF), VOLUME, TONS, 2017 - 2029
- Figure 70:
- SOUTH AMERICA ENGINEERING PLASTICS MARKET, POLYVINYLIDENE FLUORIDE (PVDF), VALUE, USD, 2017 - 2029
- Figure 71:
- SOUTH AMERICA ENGINEERING PLASTICS MARKET, POLYVINYLIDENE FLUORIDE (PVDF), BY END USER INDUSTRY, VALUE SHARE(%), 2022 VS 2029
- Figure 72:
- SOUTH AMERICA ENGINEERING PLASTICS MARKET, OTHER SUB RESIN TYPES, VOLUME, TONS, 2017 - 2029
- Figure 73:
- SOUTH AMERICA ENGINEERING PLASTICS MARKET, OTHER SUB RESIN TYPES, VALUE, USD, 2017 - 2029
- Figure 74:
- SOUTH AMERICA ENGINEERING PLASTICS MARKET, OTHER SUB RESIN TYPES, BY END USER INDUSTRY, VALUE SHARE(%), 2022 VS 2029
- Figure 75:
- SOUTH AMERICA ENGINEERING PLASTICS MARKET, LIQUID CRYSTAL POLYMER (LCP), VOLUME, TONS, 2017 - 2029
- Figure 76:
- SOUTH AMERICA ENGINEERING PLASTICS MARKET, LIQUID CRYSTAL POLYMER (LCP), VALUE, USD, 2017 - 2029
- Figure 77:
- SOUTH AMERICA ENGINEERING PLASTICS MARKET, LIQUID CRYSTAL POLYMER (LCP), BY END USER INDUSTRY, VALUE SHARE(%), 2022 VS 2029
- Figure 78:
- SOUTH AMERICA ENGINEERING PLASTICS MARKET, BY SUB RESIN TYPE, VOLUME, TONS, 2017 - 2029
- Figure 79:
- SOUTH AMERICA ENGINEERING PLASTICS MARKET, BY SUB RESIN TYPE, VALUE, USD, 2017 - 2029
- Figure 80:
- SOUTH AMERICA ENGINEERING PLASTICS MARKET, BY SUB RESIN TYPE, VOLUME SHARE(%), 2017 - 2029
- Figure 81:
- SOUTH AMERICA ENGINEERING PLASTICS MARKET, BY SUB RESIN TYPE, VALUE SHARE(%), 2017 - 2029
- Figure 82:
- SOUTH AMERICA ENGINEERING PLASTICS MARKET, ARAMID, VOLUME, TONS, 2017 - 2029
- Figure 83:
- SOUTH AMERICA ENGINEERING PLASTICS MARKET, ARAMID, VALUE, USD, 2017 - 2029
- Figure 84:
- SOUTH AMERICA ENGINEERING PLASTICS MARKET, ARAMID, BY END USER INDUSTRY, VALUE SHARE(%), 2022 VS 2029
- Figure 85:
- SOUTH AMERICA ENGINEERING PLASTICS MARKET, POLYAMIDE (PA) 6, VOLUME, TONS, 2017 - 2029
- Figure 86:
- SOUTH AMERICA ENGINEERING PLASTICS MARKET, POLYAMIDE (PA) 6, VALUE, USD, 2017 - 2029
- Figure 87:
- SOUTH AMERICA ENGINEERING PLASTICS MARKET, POLYAMIDE (PA) 6, BY END USER INDUSTRY, VALUE SHARE(%), 2022 VS 2029
- Figure 88:
- SOUTH AMERICA ENGINEERING PLASTICS MARKET, POLYAMIDE (PA) 66, VOLUME, TONS, 2017 - 2029
- Figure 89:
- SOUTH AMERICA ENGINEERING PLASTICS MARKET, POLYAMIDE (PA) 66, VALUE, USD, 2017 - 2029
- Figure 90:
- SOUTH AMERICA ENGINEERING PLASTICS MARKET, POLYAMIDE (PA) 66, BY END USER INDUSTRY, VALUE SHARE(%), 2022 VS 2029
- Figure 91:
- SOUTH AMERICA ENGINEERING PLASTICS MARKET, POLYPHTHALAMIDE, VOLUME, TONS, 2017 - 2029
- Figure 92:
- SOUTH AMERICA ENGINEERING PLASTICS MARKET, POLYPHTHALAMIDE, VALUE, USD, 2017 - 2029
- Figure 93:
- SOUTH AMERICA ENGINEERING PLASTICS MARKET, POLYPHTHALAMIDE, BY END USER INDUSTRY, VALUE SHARE(%), 2022 VS 2029
- Figure 94:
- SOUTH AMERICA ENGINEERING PLASTICS MARKET, POLYBUTYLENE TEREPHTHALATE (PBT), VOLUME, TONS, 2017 - 2029
- Figure 95:
- SOUTH AMERICA ENGINEERING PLASTICS MARKET, POLYBUTYLENE TEREPHTHALATE (PBT), VALUE, USD, 2017 - 2029
- Figure 96:
- SOUTH AMERICA ENGINEERING PLASTICS MARKET, POLYBUTYLENE TEREPHTHALATE (PBT), BY END USER INDUSTRY, VALUE SHARE(%), 2022 VS 2029
- Figure 97:
- SOUTH AMERICA ENGINEERING PLASTICS MARKET, POLYCARBONATE (PC), VOLUME, TONS, 2017 - 2029
- Figure 98:
- SOUTH AMERICA ENGINEERING PLASTICS MARKET, POLYCARBONATE (PC), VALUE, USD, 2017 - 2029
- Figure 99:
- SOUTH AMERICA ENGINEERING PLASTICS MARKET, POLYCARBONATE (PC), BY END USER INDUSTRY, VALUE SHARE(%), 2022 VS 2029
- Figure 100:
- SOUTH AMERICA ENGINEERING PLASTICS MARKET, POLYETHER ETHER KETONE (PEEK), VOLUME, TONS, 2017 - 2029
- Figure 101:
- SOUTH AMERICA ENGINEERING PLASTICS MARKET, POLYETHER ETHER KETONE (PEEK), VALUE, USD, 2017 - 2029
- Figure 102:
- SOUTH AMERICA ENGINEERING PLASTICS MARKET, POLYETHER ETHER KETONE (PEEK), BY END USER INDUSTRY, VALUE SHARE(%), 2022 VS 2029
- Figure 103:
- SOUTH AMERICA ENGINEERING PLASTICS MARKET, POLYETHYLENE TEREPHTHALATE (PET), VOLUME, TONS, 2017 - 2029
- Figure 104:
- SOUTH AMERICA ENGINEERING PLASTICS MARKET, POLYETHYLENE TEREPHTHALATE (PET), VALUE, USD, 2017 - 2029
- Figure 105:
- SOUTH AMERICA ENGINEERING PLASTICS MARKET, POLYETHYLENE TEREPHTHALATE (PET), BY END USER INDUSTRY, VALUE SHARE(%), 2022 VS 2029
- Figure 106:
- SOUTH AMERICA ENGINEERING PLASTICS MARKET, POLYIMIDE (PI), VOLUME, TONS, 2017 - 2029
- Figure 107:
- SOUTH AMERICA ENGINEERING PLASTICS MARKET, POLYIMIDE (PI), VALUE, USD, 2017 - 2029
- Figure 108:
- SOUTH AMERICA ENGINEERING PLASTICS MARKET, POLYIMIDE (PI), BY END USER INDUSTRY, VALUE SHARE(%), 2022 VS 2029
- Figure 109:
- SOUTH AMERICA ENGINEERING PLASTICS MARKET, POLYMETHYL METHACRYLATE (PMMA), VOLUME, TONS, 2017 - 2029
- Figure 110:
- SOUTH AMERICA ENGINEERING PLASTICS MARKET, POLYMETHYL METHACRYLATE (PMMA), VALUE, USD, 2017 - 2029
- Figure 111:
- SOUTH AMERICA ENGINEERING PLASTICS MARKET, POLYMETHYL METHACRYLATE (PMMA), BY END USER INDUSTRY, VALUE SHARE(%), 2022 VS 2029
- Figure 112:
- SOUTH AMERICA ENGINEERING PLASTICS MARKET, POLYOXYMETHYLENE (POM), VOLUME, TONS, 2017 - 2029
- Figure 113:
- SOUTH AMERICA ENGINEERING PLASTICS MARKET, POLYOXYMETHYLENE (POM), VALUE, USD, 2017 - 2029
- Figure 114:
- SOUTH AMERICA ENGINEERING PLASTICS MARKET, POLYOXYMETHYLENE (POM), BY END USER INDUSTRY, VALUE SHARE(%), 2022 VS 2029
- Figure 115:
- SOUTH AMERICA ENGINEERING PLASTICS MARKET, STYRENE COPOLYMERS (ABS AND SAN), VOLUME, TONS, 2017 - 2029
- Figure 116:
- SOUTH AMERICA ENGINEERING PLASTICS MARKET, STYRENE COPOLYMERS (ABS AND SAN), VALUE, USD, 2017 - 2029
- Figure 117:
- SOUTH AMERICA ENGINEERING PLASTICS MARKET, STYRENE COPOLYMERS (ABS AND SAN), BY END USER INDUSTRY, VALUE SHARE(%), 2022 VS 2029
- Figure 118:
- SOUTH AMERICA ENGINEERING PLASTICS MARKET, BY COUNTRY, VOLUME, TONS, 2017 - 2029
- Figure 119:
- SOUTH AMERICA ENGINEERING PLASTICS MARKET, BY COUNTRY, VALUE, USD, 2017 - 2029
- Figure 120:
- SOUTH AMERICA ENGINEERING PLASTICS MARKET, BY COUNTRY, VOLUME SHARE(%), 2017 - 2029
- Figure 121:
- SOUTH AMERICA ENGINEERING PLASTICS MARKET, BY COUNTRY, VALUE SHARE(%), 2017 - 2029
- Figure 122:
- SOUTH AMERICA ENGINEERING PLASTICS MARKET, ARGENTINA, VOLUME, TONS, 2017 - 2029
- Figure 123:
- SOUTH AMERICA ENGINEERING PLASTICS MARKET, ARGENTINA, VALUE, USD, 2017 - 2029
- Figure 124:
- SOUTH AMERICA ENGINEERING PLASTICS MARKET, ARGENTINA, BY END USER INDUSTRY, VALUE SHARE(%), 2022 VS 2029
- Figure 125:
- SOUTH AMERICA ENGINEERING PLASTICS MARKET, BRAZIL, VOLUME, TONS, 2017 - 2029
- Figure 126:
- SOUTH AMERICA ENGINEERING PLASTICS MARKET, BRAZIL, VALUE, USD, 2017 - 2029
- Figure 127:
- SOUTH AMERICA ENGINEERING PLASTICS MARKET, BRAZIL, BY END USER INDUSTRY, VALUE SHARE(%), 2022 VS 2029
- Figure 128:
- SOUTH AMERICA ENGINEERING PLASTICS MARKET, REST OF SOUTH AMERICA, VOLUME, TONS, 2017 - 2029
- Figure 129:
- SOUTH AMERICA ENGINEERING PLASTICS MARKET, REST OF SOUTH AMERICA, VALUE, USD, 2017 - 2029
- Figure 130:
- SOUTH AMERICA ENGINEERING PLASTICS MARKET, REST OF SOUTH AMERICA, BY END USER INDUSTRY, VALUE SHARE(%), 2022 VS 2029
- Figure 131:
- SOUTH AMERICA ENGINEERING PLASTICS MARKET, MOST ACTIVE COMPANIES, BY NUMBER OF STRATEGIC MOVES, 2019 - 2021
- Figure 132:
- SOUTH AMERICA ENGINEERING PLASTICS MARKET, MOST ADOPTED STRATEGIES, 2019 - 2021
- Figure 133:
- SOUTH AMERICA ENGINEERING PLASTICS MARKET SHARE(%), BY MAJOR PLAYERS PRODUCTION CAPACITY, 2022
- Figure 134:
- SOUTH AMERICA FLUOROPOLYMER MARKET SHARE(%), BY MAJOR PLAYERS REVENUE, 2022
- Figure 135:
- SOUTH AMERICA POLYAMIDE (PA) MARKET SHARE(%), BY MAJOR PLAYERS PRODUCTION CAPACITY, 2022
- Figure 136:
- SOUTH AMERICA POLYBUTYLENE TEREPHTHALATE (PBT) MARKET SHARE(%), BY MAJOR PLAYERS PRODUCTION CAPACITY, 2022
- Figure 137:
- SOUTH AMERICA POLYCARBONATE (PC) MARKET SHARE(%), BY MAJOR PLAYERS REVENUE, 2022
- Figure 138:
- SOUTH AMERICA POLYETHER ETHER KETONE (PEEK) MARKET SHARE(%), BY MAJOR PLAYERS REVENUE, 2022
- Figure 139:
- SOUTH AMERICA POLYETHYLENE TEREPHTHALATE (PET) MARKET SHARE(%), BY MAJOR PLAYERS PRODUCTION CAPACITY, 2022
South America Engineering Plastics Industry Segmentation
Aerospace, Automotive, Building and Construction, Electrical and Electronics, Industrial and Machinery, Packaging are covered as segments by End User Industry. Fluoropolymer, Liquid Crystal Polymer (LCP), Polyamide (PA), Polybutylene Terephthalate (PBT), Polycarbonate (PC), Polyether Ether Ketone (PEEK), Polyethylene Terephthalate (PET), Polyimide (PI), Polymethyl Methacrylate (PMMA), Polyoxymethylene (POM), Styrene Copolymers (ABS and SAN) are covered as segments by Resin Type. Argentina, Brazil are covered as segments by Country.| End User Industry | |
| Aerospace | |
| Automotive | |
| Building and Construction | |
| Electrical and Electronics | |
| Industrial and Machinery | |
| Packaging | |
| Other End-user Industries |
| Resin Type | ||||||||||
| ||||||||||
| Liquid Crystal Polymer (LCP) | ||||||||||
| ||||||||||
| Polybutylene Terephthalate (PBT) | ||||||||||
| Polycarbonate (PC) | ||||||||||
| Polyether Ether Ketone (PEEK) | ||||||||||
| Polyethylene Terephthalate (PET) | ||||||||||
| Polyimide (PI) | ||||||||||
| Polymethyl Methacrylate (PMMA) | ||||||||||
| Polyoxymethylene (POM) | ||||||||||
| Styrene Copolymers (ABS and SAN) |
| Country | |
| Argentina | |
| Brazil | |
| Rest of South America |
Market Definition
- End-user Industry - Packaging, Electrical & Electronics, Automotive, Building & Construction, and Others are the end-user industries considered under the engineering plastics market.
- Resin - Under the scope of the study, consumption of virgin resins like Fluoropolymer, Polycarbonate, Polyethylene Terephthalate, Polybutylene Terephthalate, Polyoxymethylene, Polymethyl Methacrylate, Styrene Copolymers, Liquid Crystal Polymer, Polyether Ether Ketone, Polyimide, and Polyamide in the primary forms are considered. Recycling has been provided separately under its individual chapter.
Research Methodology
Mordor Intelligence follows a four-step methodology in all our reports.
- Step-1: Identify Key Variables: The quantifiable key variables (industry and extraneous) pertaining to the specific product segment and country are selected from a group of relevant variables & factors based on desk research & literature review; along with primary expert inputs. These variables are further confirmed through regression modeling (wherever required).
- Step-2: Build a Market Model: In order to build a robust forecasting methodology, the variables and factors identified in Step-1 are tested against available historical market numbers. Through an iterative process, the variables required for market forecast are set and the model is built on the basis of these variables.
- Step-3: Validate and Finalize: In this important step, all market numbers, variables and analyst calls are validated through an extensive network of primary research experts from the market studied. The respondents are selected across levels and functions to generate a holistic picture of the market studied.
- Step-4: Research Outputs: Syndicated Reports, Custom Consulting Assignments, Databases & Subscription Platforms


