South America Plant Protein Ingredients Market Size

| Icons | Lable | Value |
|---|---|---|
|
|
Study Period | 2017 - 2029 |
|
|
Base Year For Estimation | 2022 |
|
|
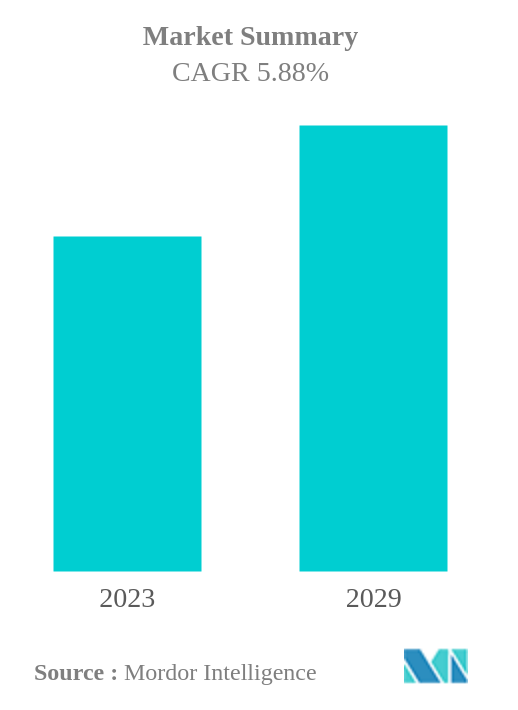
CAGR | 5.88 % |
|
|
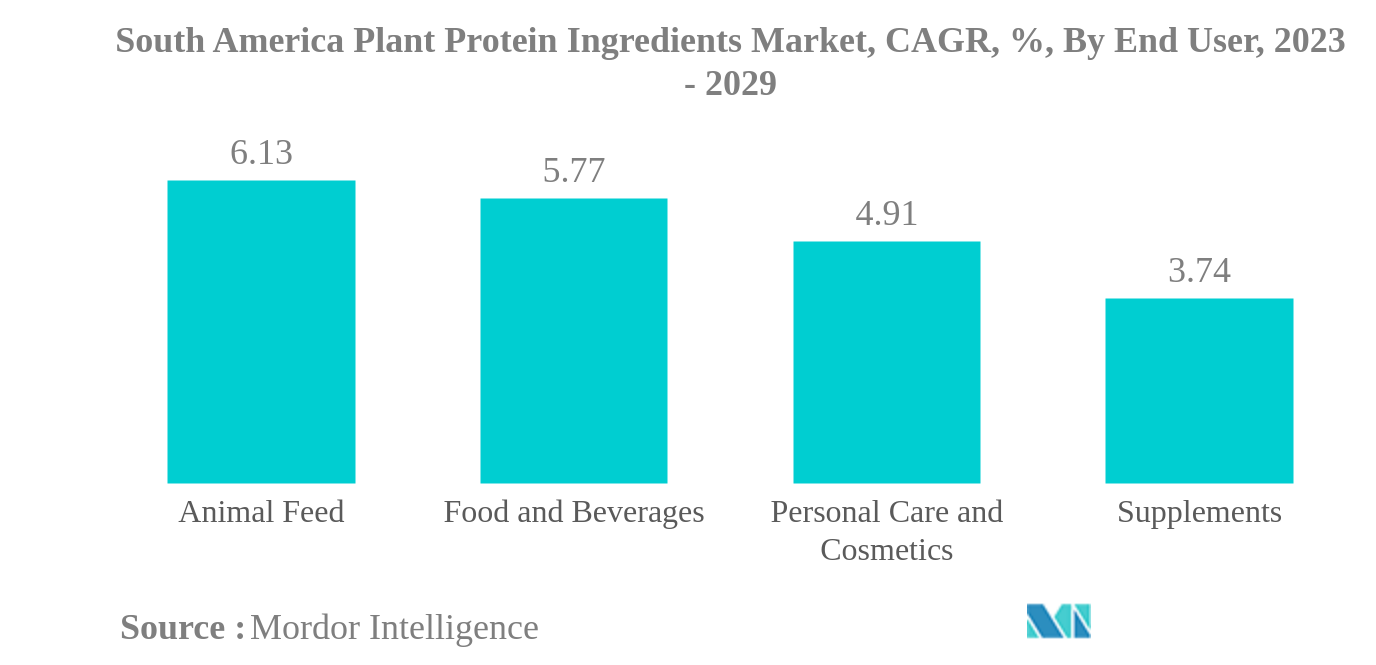
Largest Share by End User | Food and Beverages |
|
|
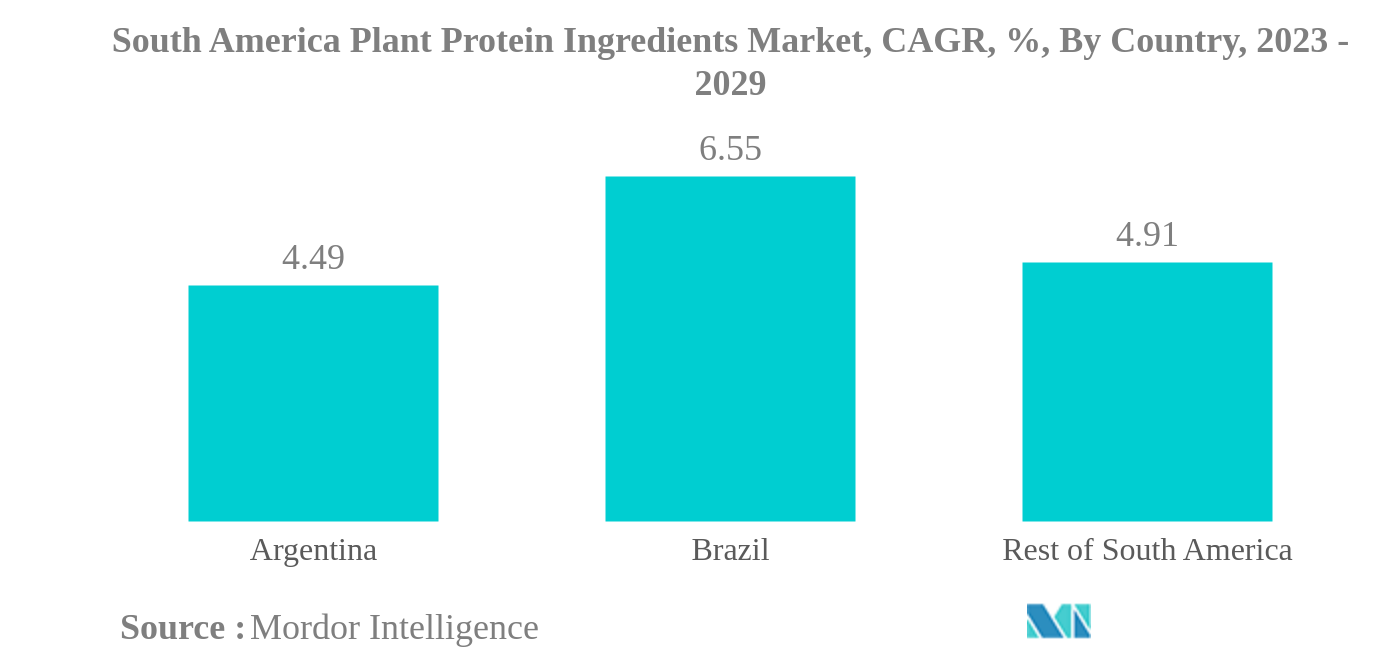
Largest Share by Country | Brazil |
|
|
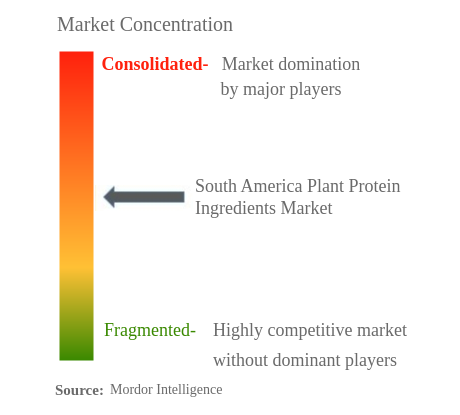
Market Concentration | High |
Major Players |
||
|
|
||
|
*Disclaimer: Major Players sorted in no particular order |
South America Plant Protein Ingredients Market Analysis
The South America Plant Protein Ingredients Market is projected to register a CAGR of 5.88%
- Soy Protein is the Largest Protein Type : Among all plant proteins, soy protein remained the most favored in the South American plant proteins market owing to its low cost and excellent quality. The animal feed and F&B sectors drove the soy protein type in the region.
- Food and Beverages is the Largest End User : The high supply of plant proteins (rice, pea, and wheat) that have the ability to mimic meat texture, together with protein fortification, is boosting the food and beverage segment.
- Pea Protein is the Fastest-growing Protein Type : Pea proteins are gaining demand from meat alternatives due to their quick rehydration, neutral flavor, and texturizing abilities, leading to a slew of new products.
- Animal Feed is the Fastest-growing End User : Soy and wheat proteins are the plant proteins used in the animal feed segment due to their functionality traits, which makes them ideal alternatives to fish and animal-based feeds.
South America Plant Protein Ingredients Market Trends
This section covers the major market trends shaping the South America Plant Protein Ingredients Market according to our research experts:
Food and Beverages is the largest End User
- The F&B segment is dominated by the meat and meat alternatives sub-segment, which is expected to record a CAGR of 4.74%, by volume, during the forecast period. Protein ingredients provide properties that mimic meat texture, making them suitable for vegans. The growing knowledge of healthy eating habits and environmental concerns are driving the demand for these items in the region. Pea protein and wheat protein are the major plant protein ingredients used in manufacturing meat substitutes. Wheat protein is growing at the fastest rate, and it is expected to record a CAGR of 3.15%, by volume, during the forecast year. This growth is due to the elasticity and flexibility traits of gluten, which are present in wheat protein, specifically changing the structure of meat products. The presence of high-quality amino acid composition, which is similar to animal protein, is used in structured plant protein products.
- Animal feed remained the second-largest end-user segment. Argentina dominated the market, and it is expected to record a CAGR of 7.34%, by value, during the forecast year. Soy is a rich nutritional source with a less variable chemical composition than other protein sources. Thus, soy is widely used in feed. Soy concentrates are ideal for chicken's pre-starter meal as they contain easily digestible amino acids and aid with lipid and water retention. The high sales of proteins in this segment are attributed to the nation's massive soy production. In 2022, soybean production in Argentina was 48.95 million ton. It is expected to grow by 52.86 million ton in 2031. As soy production is high in the country, there will be a high supply volume at affordable prices. The rise in supply led the manufacturers to incorporate soy protein instead of others in animal feed.
Brazil is the largest Country
- Plant protein consumption in South America is driven primarily by an increase in demand for soy proteins. Over the last five years, soy, whey, and milk protein products accounted for 70% of all regional high-protein launches, but plant-based protein sources are gaining traction. Mainstream food and beverage products incorporate proteins derived from peas, rice, chia seeds, oats, and potatoes. More than 40% of Latin American consumers reported that plant-based protein improves their health. Pea and rice proteins are the most popular plant proteins on the market. Pea protein is expected to register the highest CAGR of 9.82%, by volume, during the forecast period. The application of plant proteins has been supported by application in the F&B segment, supported by the growing protein fortification of baked products. Conventional plant proteins dominate the bakery industry, but emerging sources are also gaining traction because of their specific functional properties and nutritional value.
- Brazil claimed the largest share in 2022, where the plant protein demand in the F&B segment dominated sales. This high demand can be attributed to the country's aging population, and it is estimated to triple by 2050, covering around 66 million Brazilians. Consumers are increasingly adopting healthy diets. During the review period, the nation witnessed several plant protein-based product launches with the emergence of start-ups, The New Butchers, Future Farm, Behind The Foods, and Superbom. Brazil recorded the fastest growth potential among all South American countries, and it is expected to register a CAGR of 6.46% during the forecast period. The country, bearing about half of the region's population, has a vast consumer base and, thus, receives a major focus from competitors.
South America Plant Protein Ingredients Industry Overview
The South America Plant Protein Ingredients Market is moderately consolidated, with the top five companies occupying 46.14%. The major players in this market are Archer Daniels Midland Company, Ingredion Incorporated, International Flavors & Fragrances, Inc., Kerry Group plc and Südzucker AG (sorted alphabetically).
South America Plant Protein Ingredients Market Leaders
Archer Daniels Midland Company
Ingredion Incorporated
International Flavors & Fragrances, Inc.
Kerry Group plc
Südzucker AG
*Disclaimer: Major Players sorted in no particular order
South America Plant Protein Ingredients Market News
- July 2022: BENEO, a functional ingredients manufacturer, displayed its new fava bean protein concentrate at the 2022 IFT FIRST Annual Event and Expo in Chicago, the United States. It was held under the theme "Rooted in Nature - the Power of Plants." With a mild taste, great amino acid profile, high solubility, and emulsifying qualities, the company claims that its fava bean ingredients are suited for animal or soy protein substitution.
- May 2022: BENEO, a subsidiary of Südzucker, entered a purchase agreement to acquire Meatless BV, a producer of functional ingredients. BENEO is expanding its existing product offering with the acquisition to offer an even broader range of texturizing solutions for meat and fish alternatives.
- May 2022: BENEO, a producer of functional ingredients, announced the opening of a new fava bean processing plant in Offstein, Germany. The beans are expected to be processed into protein concentrate, flour, and hulls, with the potential of other pulses joining in the future. The new site, which will cost EUR 50 million, is expected to enable BENEO to enhance its portfolio and address the growing demand for plant-based proteins.
South America Plant Protein Ingredients Market Report - Table of Contents
EXECUTIVE SUMMARY & KEY FINDINGS
1. INTRODUCTION
1.1. Study Assumptions & Market Definition
1.2. Scope of the Study
1.3. Research Methodology
2. KEY INDUSTRY TRENDS
2.1. End User Market Volume
2.2. Protein Consumption Trends
2.3. Production Trends
2.4. Regulatory Framework
2.5. Value Chain & Distribution Channel Analysis
3. MARKET SEGMENTATION
3.1. Protein Type
3.1.1. Hemp Protein
3.1.2. Pea Protein
3.1.3. Potato Protein
3.1.4. Rice Protein
3.1.5. Soy Protein
3.1.6. Wheat Protein
3.1.7. Other Plant Protein
3.2. End User
3.2.1. Animal Feed
3.2.2. Food And Beverages
3.2.2.1. By Sub End User
3.2.2.1.1. Bakery
3.2.2.1.2. Beverages
3.2.2.1.3. Breakfast Cereals
3.2.2.1.4. Condiments/Sauces
3.2.2.1.5. Confectionery
3.2.2.1.6. Dairy And Dairy Alternative Products
3.2.2.1.7. Meat/Poultry/Seafood And Meat Alternative Products
3.2.2.1.8. RTE/RTC Food Products
3.2.2.1.9. Snacks
3.2.3. Personal Care And Cosmetics
3.2.4. Supplements
3.2.4.1. By Sub End User
3.2.4.1.1. Baby Food And Infant Formula
3.2.4.1.2. Elderly Nutrition And Medical Nutrition
3.2.4.1.3. Sport/Performance Nutrition
3.3. Country
3.3.1. Argentina
3.3.2. Brazil
3.3.3. Rest Of South America
4. COMPETITIVE LANDSCAPE
4.1. Key Strategic Moves
4.2. Market Share Analysis
4.3. Company Landscape
4.4. Company Profiles
4.4.1. Archer Daniels Midland Company
4.4.2. Bremil Group
4.4.3. BRF S.A.
4.4.4. Bunge Limited
4.4.5. Ingredion Incorporated
4.4.6. International Flavors & Fragrances, Inc.
4.4.7. Kerry Group plc
4.4.8. Südzucker AG
4.4.9. Tereos SCA
5. KEY STRATEGIC QUESTIONS FOR PROTEIN INGREDIENTS INDUSTRY CEOS
6. APPENDIX
6.1. Global Overview
6.1.1. Overview
6.1.2. Porter’s Five Forces Framework
6.1.3. Global Value Chain Analysis
6.1.4. Market Dynamics (DROs)
6.2. Sources & References
6.3. List of Tables & Figures
6.4. Primary Insights
6.5. Data Pack
6.6. Glossary of Terms
List of Tables & Figures
- Figure 1:
- SOUTH AMERICA BABY FOOD AND INFANT FORMULA MARKET, VOLUME IN METRIC TONNES, 2017 - 2029
- Figure 2:
- SOUTH AMERICA BAKERY MARKET, VOLUME IN METRIC TONNES, 2017 - 2029
- Figure 3:
- SOUTH AMERICA BEVERAGES MARKET, VOLUME IN METRIC TONNES, 2017 - 2029
- Figure 4:
- SOUTH AMERICA BREAKFAST CEREALS MARKET, VOLUME IN METRIC TONNES, 2017 - 2029
- Figure 5:
- SOUTH AMERICA CONDIMENTS/SAUCES MARKET, VOLUME IN METRIC TONNES, 2017 - 2029
- Figure 6:
- SOUTH AMERICA CONFECTIONERY MARKET, VOLUME IN METRIC TONNES, 2017 - 2029
- Figure 7:
- SOUTH AMERICA DAIRY AND DAIRY ALTERNATIVE PRODUCTS MARKET, VOLUME IN METRIC TONNES, 2017 - 2029
- Figure 8:
- SOUTH AMERICA ELDERLY NUTRITION AND MEDICAL NUTRITION MARKET, VOLUME IN METRIC TONNES, 2017 - 2029
- Figure 9:
- SOUTH AMERICA MEAT/POULTRY/SEAFOOD AND MEAT ALTERNATIVE PRODUCTS MARKET, VOLUME IN METRIC TONNES, 2017 - 2029
- Figure 10:
- SOUTH AMERICA RTE/RTC FOOD PRODUCTS MARKET, VOLUME IN METRIC TONNES, 2017 - 2029
- Figure 11:
- SOUTH AMERICA SNACKS MARKET, VOLUME IN METRIC TONNES, 2017 - 2029
- Figure 12:
- SOUTH AMERICA SPORT/PERFORMANCE NUTRITION MARKET, VOLUME IN METRIC TONNES, 2017 - 2029
- Figure 13:
- SOUTH AMERICA ANIMAL FEED MARKET, VOLUME IN METRIC TONNES, 2017 - 2029
- Figure 14:
- SOUTH AMERICA PERSONAL CARE AND COSMETICS MARKET, VOLUME IN METRIC TONNES, 2017 - 2029
- Figure 15:
- SOUTH AMERICA PER CAPITA CONSUMPTION OF PLANT PROTEIN, IN GRAM, 2017 - 2029
- Figure 16:
- SOUTH AMERICA PLANT PROTEIN RAW MATERIAL PRODUCTION, IN METRIC TONNES, 2017 - 2021
- Figure 17:
- SOUTH AMERICA PLANT PROTEIN INGREDIENTS MARKET, 2015-2026
- Figure 18:
- SOUTH AMERICA PLANT PROTEIN INGREDIENTS MARKET, 2015-2026
- Figure 19:
- SOUTH AMERICA PLANT PROTEIN INGREDIENTS MARKET, VOLUME IN METRIC TONNES, BY PROTEIN TYPE, 2017 - 2029
- Figure 20:
- SOUTH AMERICA PLANT PROTEIN INGREDIENTS MARKET, VALUE IN USD, BY PROTEIN TYPE, 2017 - 2029
- Figure 21:
- SOUTH AMERICA PLANT PROTEIN INGREDIENTS MARKET, VALUE SHARE (%), BY PROTEIN TYPE, 2017 VS 2023 VS 2029
- Figure 22:
- SOUTH AMERICA PLANT PROTEIN INGREDIENTS MARKET, VOLUME SHARE (%), BY PROTEIN TYPE, 2017 VS 2023 VS 2029
- Figure 23:
- SOUTH AMERICA PLANT PROTEIN INGREDIENTS MARKET, VOLUME IN METRIC TONNES, HEMP PROTEIN, 2017 - 2029
- Figure 24:
- SOUTH AMERICA PLANT PROTEIN INGREDIENTS MARKET, VALUE IN USD, HEMP PROTEIN, 2017 - 2029
- Figure 25:
- SOUTH AMERICA PLANT PROTEIN INGREDIENTS MARKET, HEMP PROTEIN, VALUE SHARE (%), BY END USER, 2022 VS 2029
- Figure 26:
- SOUTH AMERICA PLANT PROTEIN INGREDIENTS MARKET, VOLUME IN METRIC TONNES, PEA PROTEIN, 2017 - 2029
- Figure 27:
- SOUTH AMERICA PLANT PROTEIN INGREDIENTS MARKET, VALUE IN USD, PEA PROTEIN, 2017 - 2029
- Figure 28:
- SOUTH AMERICA PLANT PROTEIN INGREDIENTS MARKET, PEA PROTEIN, VALUE SHARE (%), BY END USER, 2022 VS 2029
- Figure 29:
- SOUTH AMERICA PLANT PROTEIN INGREDIENTS MARKET, VOLUME IN METRIC TONNES, POTATO PROTEIN, 2017 - 2029
- Figure 30:
- SOUTH AMERICA PLANT PROTEIN INGREDIENTS MARKET, VALUE IN USD, POTATO PROTEIN, 2017 - 2029
- Figure 31:
- SOUTH AMERICA PLANT PROTEIN INGREDIENTS MARKET, POTATO PROTEIN, VALUE SHARE (%), BY END USER, 2022 VS 2029
- Figure 32:
- SOUTH AMERICA PLANT PROTEIN INGREDIENTS MARKET, VOLUME IN METRIC TONNES, RICE PROTEIN, 2017 - 2029
- Figure 33:
- SOUTH AMERICA PLANT PROTEIN INGREDIENTS MARKET, VALUE IN USD, RICE PROTEIN, 2017 - 2029
- Figure 34:
- SOUTH AMERICA PLANT PROTEIN INGREDIENTS MARKET, RICE PROTEIN, VALUE SHARE (%), BY END USER, 2022 VS 2029
- Figure 35:
- SOUTH AMERICA PLANT PROTEIN INGREDIENTS MARKET, VOLUME IN METRIC TONNES, SOY PROTEIN, 2017 - 2029
- Figure 36:
- SOUTH AMERICA PLANT PROTEIN INGREDIENTS MARKET, VALUE IN USD, SOY PROTEIN, 2017 - 2029
- Figure 37:
- SOUTH AMERICA PLANT PROTEIN INGREDIENTS MARKET, SOY PROTEIN, VALUE SHARE (%), BY END USER, 2022 VS 2029
- Figure 38:
- SOUTH AMERICA PLANT PROTEIN INGREDIENTS MARKET, VOLUME IN METRIC TONNES, WHEAT PROTEIN, 2017 - 2029
- Figure 39:
- SOUTH AMERICA PLANT PROTEIN INGREDIENTS MARKET, VALUE IN USD, WHEAT PROTEIN, 2017 - 2029
- Figure 40:
- SOUTH AMERICA PLANT PROTEIN INGREDIENTS MARKET, WHEAT PROTEIN, VALUE SHARE (%), BY END USER, 2022 VS 2029
- Figure 41:
- SOUTH AMERICA PLANT PROTEIN INGREDIENTS MARKET, VOLUME IN METRIC TONNES, OTHER PLANT PROTEIN, 2017 - 2029
- Figure 42:
- SOUTH AMERICA PLANT PROTEIN INGREDIENTS MARKET, VALUE IN USD, OTHER PLANT PROTEIN, 2017 - 2029
- Figure 43:
- SOUTH AMERICA PLANT PROTEIN INGREDIENTS MARKET, OTHER PLANT PROTEIN, VALUE SHARE (%), BY END USER, 2022 VS 2029
- Figure 44:
- SOUTH AMERICA PLANT PROTEIN INGREDIENTS MARKET, VOLUME IN METRIC TONNES, BY END USER, 2017 - 2029
- Figure 45:
- SOUTH AMERICA PLANT PROTEIN INGREDIENTS MARKET, VALUE IN USD, BY END USER, 2017 - 2029
- Figure 46:
- SOUTH AMERICA PLANT PROTEIN INGREDIENTS MARKET, VALUE SHARE (%), BY END USER, 2017 VS 2023 VS 2029
- Figure 47:
- SOUTH AMERICA PLANT PROTEIN INGREDIENTS MARKET, VOLUME SHARE (%), BY END USER, 2017 VS 2023 VS 2029
- Figure 48:
- SOUTH AMERICA PLANT PROTEIN INGREDIENTS MARKET, VOLUME IN METRIC TONNES, ANIMAL FEED, 2017 - 2029
- Figure 49:
- SOUTH AMERICA PLANT PROTEIN INGREDIENTS MARKET, VALUE IN USD, ANIMAL FEED, 2017 - 2029
- Figure 50:
- SOUTH AMERICA PLANT PROTEIN INGREDIENTS MARKET, ANIMAL FEED, VALUE SHARE (%), BY PROTEIN TYPE, 2022 VS 2029
- Figure 51:
- SOUTH AMERICA PLANT PROTEIN INGREDIENTS MARKET, VOLUME IN METRIC TONNES, BY SUB END USER, 2017 - 2029
- Figure 52:
- SOUTH AMERICA PLANT PROTEIN INGREDIENTS MARKET, VALUE IN USD, BY SUB END USER, 2017 - 2029
- Figure 53:
- SOUTH AMERICA PLANT PROTEIN INGREDIENTS MARKET, VALUE SHARE (%), BY SUB END USER, 2017 VS 2023 VS 2029
- Figure 54:
- SOUTH AMERICA PLANT PROTEIN INGREDIENTS MARKET, VOLUME SHARE (%), BY SUB END USER, 2017 VS 2023 VS 2029
- Figure 55:
- SOUTH AMERICA PLANT PROTEIN INGREDIENTS MARKET, VOLUME IN METRIC TONNES, BAKERY, 2017 - 2029
- Figure 56:
- SOUTH AMERICA PLANT PROTEIN INGREDIENTS MARKET, VALUE IN USD, BAKERY, 2017 - 2029
- Figure 57:
- SOUTH AMERICA PLANT PROTEIN INGREDIENTS MARKET, BAKERY, VALUE SHARE (%), BY PROTEIN TYPE, 2022 VS 2029
- Figure 58:
- SOUTH AMERICA PLANT PROTEIN INGREDIENTS MARKET, VOLUME IN METRIC TONNES, BEVERAGES, 2017 - 2029
- Figure 59:
- SOUTH AMERICA PLANT PROTEIN INGREDIENTS MARKET, VALUE IN USD, BEVERAGES, 2017 - 2029
- Figure 60:
- SOUTH AMERICA PLANT PROTEIN INGREDIENTS MARKET, BEVERAGES, VALUE SHARE (%), BY PROTEIN TYPE, 2022 VS 2029
- Figure 61:
- SOUTH AMERICA PLANT PROTEIN INGREDIENTS MARKET, VOLUME IN METRIC TONNES, BREAKFAST CEREALS, 2017 - 2029
- Figure 62:
- SOUTH AMERICA PLANT PROTEIN INGREDIENTS MARKET, VALUE IN USD, BREAKFAST CEREALS, 2017 - 2029
- Figure 63:
- SOUTH AMERICA PLANT PROTEIN INGREDIENTS MARKET, BREAKFAST CEREALS, VALUE SHARE (%), BY PROTEIN TYPE, 2022 VS 2029
- Figure 64:
- SOUTH AMERICA PLANT PROTEIN INGREDIENTS MARKET, VOLUME IN METRIC TONNES, CONDIMENTS/SAUCES, 2017 - 2029
- Figure 65:
- SOUTH AMERICA PLANT PROTEIN INGREDIENTS MARKET, VALUE IN USD, CONDIMENTS/SAUCES, 2017 - 2029
- Figure 66:
- SOUTH AMERICA PLANT PROTEIN INGREDIENTS MARKET, CONDIMENTS/SAUCES, VALUE SHARE (%), BY PROTEIN TYPE, 2022 VS 2029
- Figure 67:
- SOUTH AMERICA PLANT PROTEIN INGREDIENTS MARKET, VOLUME IN METRIC TONNES, CONFECTIONERY, 2017 - 2029
- Figure 68:
- SOUTH AMERICA PLANT PROTEIN INGREDIENTS MARKET, VALUE IN USD, CONFECTIONERY, 2017 - 2029
- Figure 69:
- SOUTH AMERICA PLANT PROTEIN INGREDIENTS MARKET, CONFECTIONERY, VALUE SHARE (%), BY PROTEIN TYPE, 2022 VS 2029
- Figure 70:
- SOUTH AMERICA PLANT PROTEIN INGREDIENTS MARKET, VOLUME IN METRIC TONNES, DAIRY AND DAIRY ALTERNATIVE PRODUCTS, 2017 - 2029
- Figure 71:
- SOUTH AMERICA PLANT PROTEIN INGREDIENTS MARKET, VALUE IN USD, DAIRY AND DAIRY ALTERNATIVE PRODUCTS, 2017 - 2029
- Figure 72:
- SOUTH AMERICA PLANT PROTEIN INGREDIENTS MARKET, DAIRY AND DAIRY ALTERNATIVE PRODUCTS, VALUE SHARE (%), BY PROTEIN TYPE, 2022 VS 2029
- Figure 73:
- SOUTH AMERICA PLANT PROTEIN INGREDIENTS MARKET, VOLUME IN METRIC TONNES, MEAT/POULTRY/SEAFOOD AND MEAT ALTERNATIVE PRODUCTS, 2017 - 2029
- Figure 74:
- SOUTH AMERICA PLANT PROTEIN INGREDIENTS MARKET, VALUE IN USD, MEAT/POULTRY/SEAFOOD AND MEAT ALTERNATIVE PRODUCTS, 2017 - 2029
- Figure 75:
- SOUTH AMERICA PLANT PROTEIN INGREDIENTS MARKET, MEAT/POULTRY/SEAFOOD AND MEAT ALTERNATIVE PRODUCTS, VALUE SHARE (%), BY PROTEIN TYPE, 2022 VS 2029
- Figure 76:
- SOUTH AMERICA PLANT PROTEIN INGREDIENTS MARKET, VOLUME IN METRIC TONNES, RTE/RTC FOOD PRODUCTS, 2017 - 2029
- Figure 77:
- SOUTH AMERICA PLANT PROTEIN INGREDIENTS MARKET, VALUE IN USD, RTE/RTC FOOD PRODUCTS, 2017 - 2029
- Figure 78:
- SOUTH AMERICA PLANT PROTEIN INGREDIENTS MARKET, RTE/RTC FOOD PRODUCTS, VALUE SHARE (%), BY PROTEIN TYPE, 2022 VS 2029
- Figure 79:
- SOUTH AMERICA PLANT PROTEIN INGREDIENTS MARKET, VOLUME IN METRIC TONNES, SNACKS, 2017 - 2029
- Figure 80:
- SOUTH AMERICA PLANT PROTEIN INGREDIENTS MARKET, VALUE IN USD, SNACKS, 2017 - 2029
- Figure 81:
- SOUTH AMERICA PLANT PROTEIN INGREDIENTS MARKET, SNACKS, VALUE SHARE (%), BY PROTEIN TYPE, 2022 VS 2029
- Figure 82:
- SOUTH AMERICA PLANT PROTEIN INGREDIENTS MARKET, VOLUME IN METRIC TONNES, PERSONAL CARE AND COSMETICS, 2017 - 2029
- Figure 83:
- SOUTH AMERICA PLANT PROTEIN INGREDIENTS MARKET, VALUE IN USD, PERSONAL CARE AND COSMETICS, 2017 - 2029
- Figure 84:
- SOUTH AMERICA PLANT PROTEIN INGREDIENTS MARKET, PERSONAL CARE AND COSMETICS, VALUE SHARE (%), BY PROTEIN TYPE, 2022 VS 2029
- Figure 85:
- SOUTH AMERICA PLANT PROTEIN INGREDIENTS MARKET, VOLUME IN METRIC TONNES, BY SUB END USER, 2017 - 2029
- Figure 86:
- SOUTH AMERICA PLANT PROTEIN INGREDIENTS MARKET, VALUE IN USD, BY SUB END USER, 2017 - 2029
- Figure 87:
- SOUTH AMERICA PLANT PROTEIN INGREDIENTS MARKET, VALUE SHARE (%), BY SUB END USER, 2017 VS 2023 VS 2029
- Figure 88:
- SOUTH AMERICA PLANT PROTEIN INGREDIENTS MARKET, VOLUME SHARE (%), BY SUB END USER, 2017 VS 2023 VS 2029
- Figure 89:
- SOUTH AMERICA PLANT PROTEIN INGREDIENTS MARKET, VOLUME IN METRIC TONNES, BABY FOOD AND INFANT FORMULA, 2017 - 2029
- Figure 90:
- SOUTH AMERICA PLANT PROTEIN INGREDIENTS MARKET, VALUE IN USD, BABY FOOD AND INFANT FORMULA, 2017 - 2029
- Figure 91:
- SOUTH AMERICA PLANT PROTEIN INGREDIENTS MARKET, BABY FOOD AND INFANT FORMULA, VALUE SHARE (%), BY PROTEIN TYPE, 2022 VS 2029
- Figure 92:
- SOUTH AMERICA PLANT PROTEIN INGREDIENTS MARKET, VOLUME IN METRIC TONNES, ELDERLY NUTRITION AND MEDICAL NUTRITION, 2017 - 2029
- Figure 93:
- SOUTH AMERICA PLANT PROTEIN INGREDIENTS MARKET, VALUE IN USD, ELDERLY NUTRITION AND MEDICAL NUTRITION, 2017 - 2029
- Figure 94:
- SOUTH AMERICA PLANT PROTEIN INGREDIENTS MARKET, ELDERLY NUTRITION AND MEDICAL NUTRITION, VALUE SHARE (%), BY PROTEIN TYPE, 2022 VS 2029
- Figure 95:
- SOUTH AMERICA PLANT PROTEIN INGREDIENTS MARKET, VOLUME IN METRIC TONNES, SPORT/PERFORMANCE NUTRITION, 2017 - 2029
- Figure 96:
- SOUTH AMERICA PLANT PROTEIN INGREDIENTS MARKET, VALUE IN USD, SPORT/PERFORMANCE NUTRITION, 2017 - 2029
- Figure 97:
- SOUTH AMERICA PLANT PROTEIN INGREDIENTS MARKET, SPORT/PERFORMANCE NUTRITION, VALUE SHARE (%), BY PROTEIN TYPE, 2022 VS 2029
- Figure 98:
- SOUTH AMERICA PLANT PROTEIN INGREDIENTS MARKET, VOLUME IN METRIC TONNES, BY COUNTRY, 2017 - 2029
- Figure 99:
- SOUTH AMERICA PLANT PROTEIN INGREDIENTS MARKET, VALUE IN USD, BY COUNTRY, 2017 - 2029
- Figure 100:
- SOUTH AMERICA PLANT PROTEIN INGREDIENTS MARKET, VALUE SHARE (%), BY COUNTRY, 2017 VS 2023 VS 2029
- Figure 101:
- SOUTH AMERICA PLANT PROTEIN INGREDIENTS MARKET, VOLUME SHARE (%), BY COUNTRY, 2017 VS 2023 VS 2029
- Figure 102:
- SOUTH AMERICA PLANT PROTEIN INGREDIENTS MARKET, VOLUME IN METRIC TONNES, ARGENTINA, 2017 - 2029
- Figure 103:
- SOUTH AMERICA PLANT PROTEIN INGREDIENTS MARKET, VALUE IN USD, ARGENTINA, 2017 - 2029
- Figure 104:
- SOUTH AMERICA PLANT PROTEIN INGREDIENTS MARKET, VALUE SHARE (%), ARGENTINA, BY PROTEIN TYPE, 2022 VS 2029
- Figure 105:
- SOUTH AMERICA PLANT PROTEIN INGREDIENTS MARKET, VOLUME IN METRIC TONNES, BRAZIL, 2017 - 2029
- Figure 106:
- SOUTH AMERICA PLANT PROTEIN INGREDIENTS MARKET, VALUE IN USD, BRAZIL, 2017 - 2029
- Figure 107:
- SOUTH AMERICA PLANT PROTEIN INGREDIENTS MARKET, VALUE SHARE (%), BRAZIL, BY PROTEIN TYPE, 2022 VS 2029
- Figure 108:
- SOUTH AMERICA PLANT PROTEIN INGREDIENTS MARKET, VOLUME IN METRIC TONNES, REST OF SOUTH AMERICA, 2017 - 2029
- Figure 109:
- SOUTH AMERICA PLANT PROTEIN INGREDIENTS MARKET, VALUE IN USD, REST OF SOUTH AMERICA, 2017 - 2029
- Figure 110:
- SOUTH AMERICA PLANT PROTEIN INGREDIENTS MARKET, VALUE SHARE (%), REST OF SOUTH AMERICA, BY PROTEIN TYPE, 2022 VS 2029
- Figure 111:
- SOUTH AMERICA PLANT PROTEIN INGREDIENTS MARKET, MOST ACTIVE COMPANIES, BY NUMBER OF STRATEGIC MOVES, 2017 - 2022
- Figure 112:
- SOUTH AMERICA PLANT PROTEIN INGREDIENTS MARKET, TOTAL NUMBER OF STRATEGIC MOVES, 2017 - 2022
- Figure 113:
- SOUTH AMERICA PLANT PROTEIN INGREDIENTS MARKET SHARE(%), BY KEY PLAYERS, 2021
South America Plant Protein Ingredients Industry Segmentation
Hemp Protein, Pea Protein, Potato Protein, Rice Protein, Soy Protein, Wheat Protein are covered as segments by Protein Type. Animal Feed, Food And Beverages, Personal Care And Cosmetics, Supplements are covered as segments by End User. Argentina, Brazil are covered as segments by Country.| Protein Type | |
| Hemp Protein | |
| Pea Protein | |
| Potato Protein | |
| Rice Protein | |
| Soy Protein | |
| Wheat Protein | |
| Other Plant Protein |
| End User | |||||||||||||
| Animal Feed | |||||||||||||
| |||||||||||||
| Personal Care And Cosmetics | |||||||||||||
|
| Country | |
| Argentina | |
| Brazil | |
| Rest Of South America |
Market Definition
- End User - The Protein Ingredients Market operates on a B2B basis. Food, Beverages, Supplements, Animal Feed, and Personal Care & Cosmetic manufacturers are considered to be end-consumers in the market studied. The scope excludes manufacturers buying liquid/dry whey to be used for application as a binding agent or thickener or other non-protein applications.
- Penetration Rate - Penetration Rate is defined as the percentage of Protein-Fortified End User Market Volume in the Overall End User Market Volume.
- Average Protein Content - It is the average protein content present in per 100 g of product manufactured by all end-user companies considered under the scope of this report.
Research Methodology
Mordor Intelligence follows a four-step methodology in all our reports.
- Step-1: Identify Key Variables: The quantifiable key variables (industry and extraneous) pertaining to the specific product segment and country are selected from a group of relevant variables & factors based on desk research & literature review; along with primary expert inputs. These variables are further confirmed through regression modeling (wherever required).
- Step-2: Build a Market Model: In order to build a robust forecasting methodology, the variables and factors identified in Step-1 are tested against available historical market numbers. Through an iterative process, the variables required for market forecast are set and the model is built on the basis of these variables.
- Step-3: Validate and Finalize: In this important step, all market numbers, variables and analyst calls are validated through an extensive network of primary research experts from the market studied. The respondents are selected across levels and functions to generate a holistic picture of the market studied.
- Step-4: Research Outputs: Syndicated Reports, Custom Consulting Assignments, Databases & Subscription Platforms


