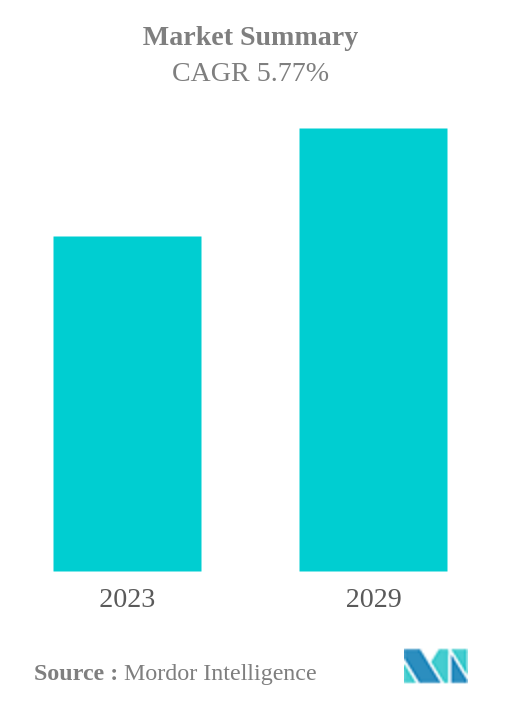
United Kingdom Animal Protein Market Size

| Icons | Lable | Value |
|---|---|---|
|
|
Study Period | 2017 - 2029 |
|
|
Base Year For Estimation | 2022 |
|
|
CAGR | 5.77 % |
|
|
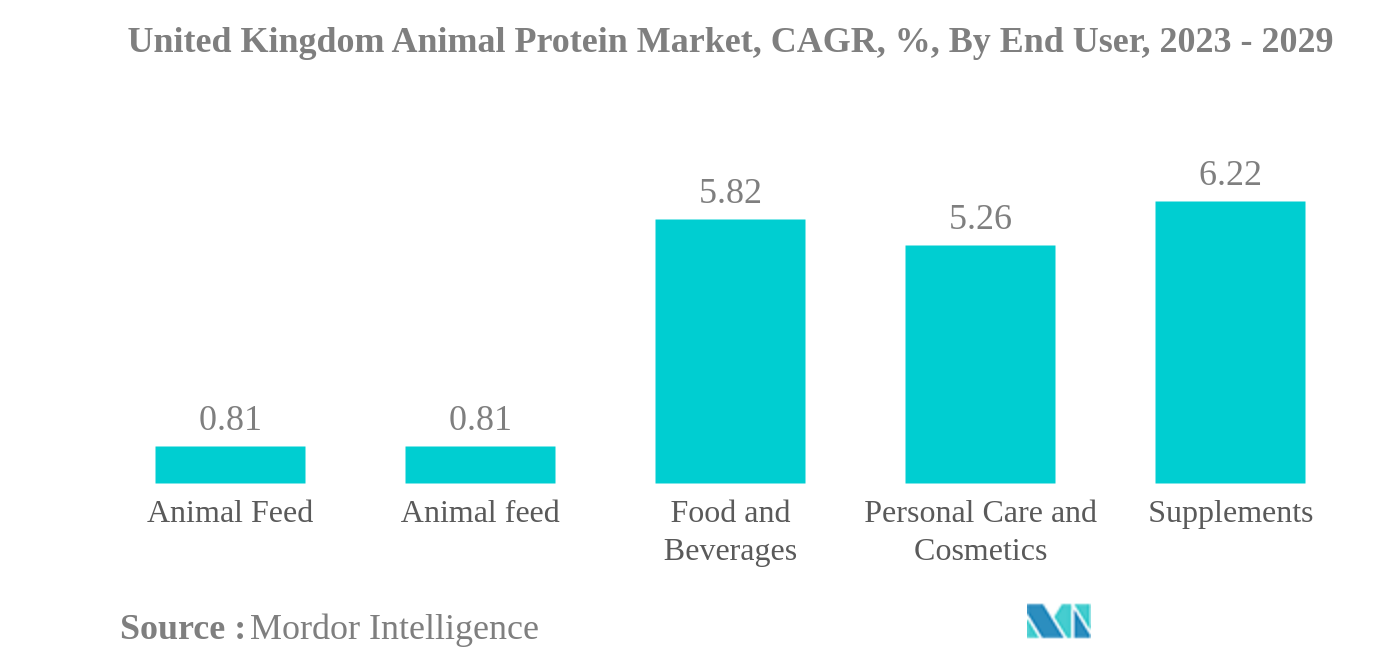
Largest Share by End User | Food and Beverages |
|
|
Fastest Growing by End User | Supplements |
|
|
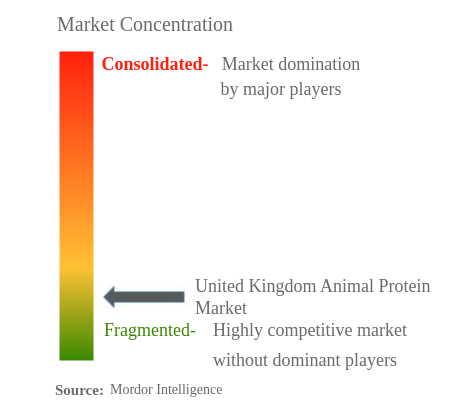
Market Concentration | High |
Major Players |
||
|
|
||
|
*Disclaimer: Major Players sorted in no particular order |
United Kingdom Animal Protein Market Analysis
The United Kingdom Animal Protein Market is projected to register a CAGR of 5.77%
- Whey Protein is the Largest Protein Type: Constant product developments, the rising demand for beverage applications, and high nutritional profiles were the major factors that boosted whey protein applications in the market.
- Food and Beverages is the Largest End User: The increased need for healthy foods, especially with claims such as organic, sustainable, and grass-fed, is driving the demand for animal proteins in the food and beverage segment.
- Gelatin is the Fastest-growing Protein Type: The sales of skin-boosting foods are driving the demand for gelatin, making it the fastest-growing segment in the market. By form, this segment is majorly dominated by animal-sourced gelatin.
- Supplements is the Fastest-growing End User: Supplements is the fastest-growing end-use segment in the market, supported by the sports and nutrition sub-segment. The rise in the number of fitness enthusiasts in the country is boosting the demand for animal proteins.
United Kingdom Animal Protein Market Trends
This section covers the major market trends shaping the United Kingdom Animal Protein Market according to our research experts:
Food and Beverages is the largest End User
- By application, the food and beverage industry is the leading end-user segment in the UK animal protein market, followed by supplements. The bakery products sub-segment accounts for the major volume in the food and beverage segment, followed by the snacks sub-segment. The food and beverage segment is likely to outpace the growth of other applications in terms of value and record a CAGR of 6.79% during the forecast period (2023-2029). Around 4,000 bakers in the country are continuously innovating and developing products like lactose-free animal proteins, like gelatin, collagen, and insect proteins, because the lactose-intolerant population is increasing in the United Kingdom.
- The supplements segment accounts for the second-largest share of the UK animal protein market, led by the sports/performance nutrition industry, which is anticipated to register a CAGR value of 6.67% during the forecast period. Among all animal proteins, insect protein has a price advantage in the market because it costs 40% lesser than other well-known animal proteins, such as milk proteins. The number of sports and fitness enthusiasts increased to around 180,000 in 2021, thereby increasing the demand for supplements.
- The market observed a hike of 0.91% in terms of value on a Y-o-Y basis from 2018 to 2020. Due to the COVID-19 pandemic-related restrictions and work-from-home norms, the market for snacks grew by around USD 2 million from 2019 to 2020. This situation positively impacted the growth of the animal protein market in the United Kingdom. For instance, around 5.6 million people were working from home in 2020 and 2021, which majorly increased the consumption of snacks, beverages, and bakery products.
United Kingdom Animal Protein Industry Overview
The United Kingdom Animal Protein Market is fragmented, with the top five companies occupying 31.43%. The major players in this market are Arla Foods AmbA, Darling Ingredients Inc., Glanbia PLC, Kerry Group PLC and Koninklijke FrieslandCampina NV (sorted alphabetically).
United Kingdom Animal Protein Market Leaders
Arla Foods AmbA
Darling Ingredients Inc.
Glanbia PLC
Kerry Group PLC
Koninklijke FrieslandCampina NV
*Disclaimer: Major Players sorted in no particular order
United Kingdom Animal Protein Market News
- January 2021: Rousselot, a Darling Ingredients brand that produces collagen-based solutions, launched an MSC-certified marine collagen peptide, known as Peptan®, at the virtual Beauty & Skincare Formulation Conference in 2021. This ingredient is sourced from 100% wild-caught marine white fish, certified by the Marine Stewardship Council (MSC), and it is majorly used in premium nutricosmetics and dietary supplements. The ingredient is produced at Rousselot’s facilities in France, but it is available worldwide. The major driving factor behind this launch is the increasing product developments with collagen sourced from wild-caught ocean fish and the rising demand for fish collagen-based beauty and dietary supplement products.
- January 2021: Darling Ingredients acquired the remaining 50% stake in the insect protein company, EnviroFlight.
- November 2020: Rousselot launched gummy caps, a new delivery format for nutraceutical and pharmaceutical gelatin ingredients, offered under its SiMoGel brand, thereby enabling manufacturers to tap into the growing popularity of chews and gummies. Gummy caps combine the benefits of capsules, soft gels, and gummies in a single delivery format. Created with SiMoGel in a starchless depositing process, gummy caps can be used to deliver a broad range of active ingredients at highly accurate dosages, ranging from nutritional solutions to OTC products.
United Kingdom Animal Protein Market Report - Table of Contents
EXECUTIVE SUMMARY & KEY FINDINGS
1. INTRODUCTION
1.1. Study Assumptions & Market Definition
1.2. Scope of the Study
1.3. Research Methodology
2. KEY INDUSTRY TRENDS
2.1. End User Market Volume
2.2. Protein Consumption Trends
2.3. Production Trends
2.4. Regulatory Framework
2.5. Value Chain & Distribution Channel Analysis
3. MARKET SEGMENTATION
3.1. Protein Type
3.1.1. Casein and Caseinates
3.1.2. Collagen
3.1.3. Egg Protein
3.1.4. Gelatin
3.1.5. Insect Protein
3.1.6. Milk Protein
3.1.7. Whey Protein
3.1.8. Other Animal Protein
3.2. End User
3.2.1. Animal Feed
3.2.2. Food and Beverages
3.2.2.1. By Sub End User
3.2.2.1.1. Bakery
3.2.2.1.2. Beverages
3.2.2.1.3. Breakfast Cereals
3.2.2.1.4. Condiments/Sauces
3.2.2.1.5. Confectionery
3.2.2.1.6. Dairy and Dairy Alternative Products
3.2.2.1.7. RTE/RTC Food Products
3.2.2.1.8. Snacks
3.2.3. Personal Care and Cosmetics
3.2.4. Supplements
3.2.4.1. By Sub End User
3.2.4.1.1. Baby Food and Infant Formula
3.2.4.1.2. Elderly Nutrition and Medical Nutrition
3.2.4.1.3. Sport/Performance Nutrition
4. COMPETITIVE LANDSCAPE
4.1. Key Strategic Moves
4.2. Market Share Analysis
4.3. Company Landscape
4.4. Company Profiles
4.4.1. Agrial Enterprise
4.4.2. Arla Foods AmbA
4.4.3. Carbery Food Ingredients Limited
4.4.4. Darling Ingredients Inc.
4.4.5. Glanbia PLC
4.4.6. Insect Technology Group Holdings UK Limited
4.4.7. Jellice Pioneer Private Limited
4.4.8. Kerry Group PLC
4.4.9. Koninklijke FrieslandCampina NV
5. KEY STRATEGIC QUESTIONS FOR PROTEIN INGREDIENTS INDUSTRY CEOS
6. APPENDIX
6.1. Global Overview
6.1.1. Overview
6.1.2. Porter’s Five Forces Framework
6.1.3. Global Value Chain Analysis
6.1.4. Market Dynamics (DROs)
6.2. Sources & References
6.3. List of Tables & Figures
6.4. Primary Insights
6.5. Data Pack
6.6. Glossary of Terms
List of Tables & Figures
- Figure 1:
- UNITED KINGDOM BABY FOOD AND INFANT FORMULA MARKET, VOLUME IN METRIC TONNES, 2017 - 2029
- Figure 2:
- UNITED KINGDOM BAKERY MARKET, VOLUME IN METRIC TONNES, 2017 - 2029
- Figure 3:
- UNITED KINGDOM BEVERAGES MARKET, VOLUME IN METRIC TONNES, 2017 - 2029
- Figure 4:
- UNITED KINGDOM BREAKFAST CEREALS MARKET, VOLUME IN METRIC TONNES, 2017 - 2029
- Figure 5:
- UNITED KINGDOM CONDIMENTS/SAUCES MARKET, VOLUME IN METRIC TONNES, 2017 - 2029
- Figure 6:
- UNITED KINGDOM CONFECTIONERY MARKET, VOLUME IN METRIC TONNES, 2017 - 2029
- Figure 7:
- UNITED KINGDOM DAIRY AND DAIRY ALTERNATIVE PRODUCTS MARKET, VOLUME IN METRIC TONNES, 2017 - 2029
- Figure 8:
- UNITED KINGDOM ELDERLY NUTRITION AND MEDICAL NUTRITION MARKET, VOLUME IN METRIC TONNES, 2017 - 2029
- Figure 9:
- UNITED KINGDOM MEAT/POULTRY/SEAFOOD AND MEAT ALTERNATIVE PRODUCTS MARKET, VOLUME IN METRIC TONNES, 2017 - 2029
- Figure 10:
- UNITED KINGDOM RTE/RTC FOOD PRODUCTS MARKET, VOLUME IN METRIC TONNES, 2017 - 2029
- Figure 11:
- UNITED KINGDOM SNACKS MARKET, VOLUME IN METRIC TONNES, 2017 - 2029
- Figure 12:
- UNITED KINGDOM SPORT/PERFORMANCE NUTRITION MARKET, VOLUME IN METRIC TONNES, 2017 - 2029
- Figure 13:
- UNITED KINGDOM ANIMAL FEED MARKET, VOLUME IN METRIC TONNES, 2017 - 2029
- Figure 14:
- UNITED KINGDOM PERSONAL CARE AND COSMETICS MARKET, VOLUME IN METRIC TONNES, 2017 - 2029
- Figure 15:
- UNITED KINGDOM PER CAPITA CONSUMPTION OF ANIMAL PROTEIN, IN GRAM, 2017 - 2029
- Figure 16:
- UNITED KINGDOM ANIMAL PROTEIN RAW MATERIAL PRODUCTION, IN METRIC TONNES, 2017 - 2021
- Figure 17:
- UNITED KINGDOM ANIMAL PROTEIN MARKET, 2015-2026
- Figure 18:
- UNITED KINGDOM ANIMAL PROTEIN MARKET, 2015-2026
- Figure 19:
- UNITED KINGDOM ANIMAL PROTEIN MARKET, VOLUME IN METRIC TONNES, BY PROTEIN TYPE, 2017 - 2029
- Figure 20:
- UNITED KINGDOM ANIMAL PROTEIN MARKET, VALUE IN USD, BY PROTEIN TYPE, 2017 - 2029
- Figure 21:
- UNITED KINGDOM ANIMAL PROTEIN MARKET, VALUE SHARE (%), BY PROTEIN TYPE, 2017 VS 2023 VS 2029
- Figure 22:
- UNITED KINGDOM ANIMAL PROTEIN MARKET, VOLUME SHARE (%), BY PROTEIN TYPE, 2017 VS 2023 VS 2029
- Figure 23:
- UNITED KINGDOM ANIMAL PROTEIN MARKET, VOLUME IN METRIC TONNES, CASEIN AND CASEINATES, 2017 - 2029
- Figure 24:
- UNITED KINGDOM ANIMAL PROTEIN MARKET, VALUE IN USD, CASEIN AND CASEINATES, 2017 - 2029
- Figure 25:
- UNITED KINGDOM ANIMAL PROTEIN MARKET, CASEIN AND CASEINATES, VALUE SHARE (%), BY END USER, 2022 VS 2029
- Figure 26:
- UNITED KINGDOM ANIMAL PROTEIN MARKET, VOLUME IN METRIC TONNES, COLLAGEN, 2017 - 2029
- Figure 27:
- UNITED KINGDOM ANIMAL PROTEIN MARKET, VALUE IN USD, COLLAGEN, 2017 - 2029
- Figure 28:
- UNITED KINGDOM ANIMAL PROTEIN MARKET, COLLAGEN, VALUE SHARE (%), BY END USER, 2022 VS 2029
- Figure 29:
- UNITED KINGDOM ANIMAL PROTEIN MARKET, VOLUME IN METRIC TONNES, EGG PROTEIN, 2017 - 2029
- Figure 30:
- UNITED KINGDOM ANIMAL PROTEIN MARKET, VALUE IN USD, EGG PROTEIN, 2017 - 2029
- Figure 31:
- UNITED KINGDOM ANIMAL PROTEIN MARKET, EGG PROTEIN, VALUE SHARE (%), BY END USER, 2022 VS 2029
- Figure 32:
- UNITED KINGDOM ANIMAL PROTEIN MARKET, VOLUME IN METRIC TONNES, GELATIN, 2017 - 2029
- Figure 33:
- UNITED KINGDOM ANIMAL PROTEIN MARKET, VALUE IN USD, GELATIN, 2017 - 2029
- Figure 34:
- UNITED KINGDOM ANIMAL PROTEIN MARKET, GELATIN, VALUE SHARE (%), BY END USER, 2022 VS 2029
- Figure 35:
- UNITED KINGDOM ANIMAL PROTEIN MARKET, VOLUME IN METRIC TONNES, INSECT PROTEIN, 2017 - 2029
- Figure 36:
- UNITED KINGDOM ANIMAL PROTEIN MARKET, VALUE IN USD, INSECT PROTEIN, 2017 - 2029
- Figure 37:
- UNITED KINGDOM ANIMAL PROTEIN MARKET, INSECT PROTEIN, VALUE SHARE (%), BY END USER, 2022 VS 2029
- Figure 38:
- UNITED KINGDOM ANIMAL PROTEIN MARKET, VOLUME IN METRIC TONNES, MILK PROTEIN, 2017 - 2029
- Figure 39:
- UNITED KINGDOM ANIMAL PROTEIN MARKET, VALUE IN USD, MILK PROTEIN, 2017 - 2029
- Figure 40:
- UNITED KINGDOM ANIMAL PROTEIN MARKET, MILK PROTEIN, VALUE SHARE (%), BY END USER, 2022 VS 2029
- Figure 41:
- UNITED KINGDOM ANIMAL PROTEIN MARKET, VOLUME IN METRIC TONNES, WHEY PROTEIN, 2017 - 2029
- Figure 42:
- UNITED KINGDOM ANIMAL PROTEIN MARKET, VALUE IN USD, WHEY PROTEIN, 2017 - 2029
- Figure 43:
- UNITED KINGDOM ANIMAL PROTEIN MARKET, WHEY PROTEIN, VALUE SHARE (%), BY END USER, 2022 VS 2029
- Figure 44:
- UNITED KINGDOM ANIMAL PROTEIN MARKET, VOLUME IN METRIC TONNES, OTHER ANIMAL PROTEIN, 2017 - 2029
- Figure 45:
- UNITED KINGDOM ANIMAL PROTEIN MARKET, VALUE IN USD, OTHER ANIMAL PROTEIN, 2017 - 2029
- Figure 46:
- UNITED KINGDOM ANIMAL PROTEIN MARKET, OTHER ANIMAL PROTEIN, VALUE SHARE (%), BY END USER, 2022 VS 2029
- Figure 47:
- UNITED KINGDOM ANIMAL PROTEIN MARKET, VOLUME IN METRIC TONNES, BY END USER, 2017 - 2029
- Figure 48:
- UNITED KINGDOM ANIMAL PROTEIN MARKET, VALUE IN USD, BY END USER, 2017 - 2029
- Figure 49:
- UNITED KINGDOM ANIMAL PROTEIN MARKET, VALUE SHARE (%), BY END USER, 2017 VS 2023 VS 2029
- Figure 50:
- UNITED KINGDOM ANIMAL PROTEIN MARKET, VOLUME SHARE (%), BY END USER, 2017 VS 2023 VS 2029
- Figure 51:
- UNITED KINGDOM ANIMAL PROTEIN MARKET, VOLUME IN METRIC TONNES, ANIMAL FEED, 2017 - 2029
- Figure 52:
- UNITED KINGDOM ANIMAL PROTEIN MARKET, VALUE IN USD, ANIMAL FEED, 2017 - 2029
- Figure 53:
- UNITED KINGDOM ANIMAL PROTEIN MARKET, ANIMAL FEED, VALUE SHARE (%), BY PROTEIN TYPE, 2022 VS 2029
- Figure 54:
- UNITED KINGDOM ANIMAL PROTEIN MARKET, VOLUME IN METRIC TONNES, BY SUB END USER, 2017 - 2029
- Figure 55:
- UNITED KINGDOM ANIMAL PROTEIN MARKET, VALUE IN USD, BY SUB END USER, 2017 - 2029
- Figure 56:
- UNITED KINGDOM ANIMAL PROTEIN MARKET, VALUE SHARE (%), BY SUB END USER, 2017 VS 2023 VS 2029
- Figure 57:
- UNITED KINGDOM ANIMAL PROTEIN MARKET, VOLUME SHARE (%), BY SUB END USER, 2017 VS 2023 VS 2029
- Figure 58:
- UNITED KINGDOM ANIMAL PROTEIN MARKET, VOLUME IN METRIC TONNES, BAKERY, 2017 - 2029
- Figure 59:
- UNITED KINGDOM ANIMAL PROTEIN MARKET, VALUE IN USD, BAKERY, 2017 - 2029
- Figure 60:
- UNITED KINGDOM ANIMAL PROTEIN MARKET, BAKERY, VALUE SHARE (%), BY PROTEIN TYPE, 2022 VS 2029
- Figure 61:
- UNITED KINGDOM ANIMAL PROTEIN MARKET, VOLUME IN METRIC TONNES, BEVERAGES, 2017 - 2029
- Figure 62:
- UNITED KINGDOM ANIMAL PROTEIN MARKET, VALUE IN USD, BEVERAGES, 2017 - 2029
- Figure 63:
- UNITED KINGDOM ANIMAL PROTEIN MARKET, BEVERAGES, VALUE SHARE (%), BY PROTEIN TYPE, 2022 VS 2029
- Figure 64:
- UNITED KINGDOM ANIMAL PROTEIN MARKET, VOLUME IN METRIC TONNES, BREAKFAST CEREALS, 2017 - 2029
- Figure 65:
- UNITED KINGDOM ANIMAL PROTEIN MARKET, VALUE IN USD, BREAKFAST CEREALS, 2017 - 2029
- Figure 66:
- UNITED KINGDOM ANIMAL PROTEIN MARKET, BREAKFAST CEREALS, VALUE SHARE (%), BY PROTEIN TYPE, 2022 VS 2029
- Figure 67:
- UNITED KINGDOM ANIMAL PROTEIN MARKET, VOLUME IN METRIC TONNES, CONDIMENTS/SAUCES, 2017 - 2029
- Figure 68:
- UNITED KINGDOM ANIMAL PROTEIN MARKET, VALUE IN USD, CONDIMENTS/SAUCES, 2017 - 2029
- Figure 69:
- UNITED KINGDOM ANIMAL PROTEIN MARKET, CONDIMENTS/SAUCES, VALUE SHARE (%), BY PROTEIN TYPE, 2022 VS 2029
- Figure 70:
- UNITED KINGDOM ANIMAL PROTEIN MARKET, VOLUME IN METRIC TONNES, CONFECTIONERY, 2017 - 2029
- Figure 71:
- UNITED KINGDOM ANIMAL PROTEIN MARKET, VALUE IN USD, CONFECTIONERY, 2017 - 2029
- Figure 72:
- UNITED KINGDOM ANIMAL PROTEIN MARKET, CONFECTIONERY, VALUE SHARE (%), BY PROTEIN TYPE, 2022 VS 2029
- Figure 73:
- UNITED KINGDOM ANIMAL PROTEIN MARKET, VOLUME IN METRIC TONNES, DAIRY AND DAIRY ALTERNATIVE PRODUCTS, 2017 - 2029
- Figure 74:
- UNITED KINGDOM ANIMAL PROTEIN MARKET, VALUE IN USD, DAIRY AND DAIRY ALTERNATIVE PRODUCTS, 2017 - 2029
- Figure 75:
- UNITED KINGDOM ANIMAL PROTEIN MARKET, DAIRY AND DAIRY ALTERNATIVE PRODUCTS, VALUE SHARE (%), BY PROTEIN TYPE, 2022 VS 2029
- Figure 76:
- UNITED KINGDOM ANIMAL PROTEIN MARKET, VOLUME IN METRIC TONNES, RTE/RTC FOOD PRODUCTS, 2017 - 2029
- Figure 77:
- UNITED KINGDOM ANIMAL PROTEIN MARKET, VALUE IN USD, RTE/RTC FOOD PRODUCTS, 2017 - 2029
- Figure 78:
- UNITED KINGDOM ANIMAL PROTEIN MARKET, RTE/RTC FOOD PRODUCTS, VALUE SHARE (%), BY PROTEIN TYPE, 2022 VS 2029
- Figure 79:
- UNITED KINGDOM ANIMAL PROTEIN MARKET, VOLUME IN METRIC TONNES, SNACKS, 2017 - 2029
- Figure 80:
- UNITED KINGDOM ANIMAL PROTEIN MARKET, VALUE IN USD, SNACKS, 2017 - 2029
- Figure 81:
- UNITED KINGDOM ANIMAL PROTEIN MARKET, SNACKS, VALUE SHARE (%), BY PROTEIN TYPE, 2022 VS 2029
- Figure 82:
- UNITED KINGDOM ANIMAL PROTEIN MARKET, VOLUME IN METRIC TONNES, PERSONAL CARE AND COSMETICS, 2017 - 2029
- Figure 83:
- UNITED KINGDOM ANIMAL PROTEIN MARKET, VALUE IN USD, PERSONAL CARE AND COSMETICS, 2017 - 2029
- Figure 84:
- UNITED KINGDOM ANIMAL PROTEIN MARKET, PERSONAL CARE AND COSMETICS, VALUE SHARE (%), BY PROTEIN TYPE, 2022 VS 2029
- Figure 85:
- UNITED KINGDOM ANIMAL PROTEIN MARKET, VOLUME IN METRIC TONNES, BY SUB END USER, 2017 - 2029
- Figure 86:
- UNITED KINGDOM ANIMAL PROTEIN MARKET, VALUE IN USD, BY SUB END USER, 2017 - 2029
- Figure 87:
- UNITED KINGDOM ANIMAL PROTEIN MARKET, VALUE SHARE (%), BY SUB END USER, 2017 VS 2023 VS 2029
- Figure 88:
- UNITED KINGDOM ANIMAL PROTEIN MARKET, VOLUME SHARE (%), BY SUB END USER, 2017 VS 2023 VS 2029
- Figure 89:
- UNITED KINGDOM ANIMAL PROTEIN MARKET, VOLUME IN METRIC TONNES, BABY FOOD AND INFANT FORMULA, 2017 - 2029
- Figure 90:
- UNITED KINGDOM ANIMAL PROTEIN MARKET, VALUE IN USD, BABY FOOD AND INFANT FORMULA, 2017 - 2029
- Figure 91:
- UNITED KINGDOM ANIMAL PROTEIN MARKET, BABY FOOD AND INFANT FORMULA, VALUE SHARE (%), BY PROTEIN TYPE, 2022 VS 2029
- Figure 92:
- UNITED KINGDOM ANIMAL PROTEIN MARKET, VOLUME IN METRIC TONNES, ELDERLY NUTRITION AND MEDICAL NUTRITION, 2017 - 2029
- Figure 93:
- UNITED KINGDOM ANIMAL PROTEIN MARKET, VALUE IN USD, ELDERLY NUTRITION AND MEDICAL NUTRITION, 2017 - 2029
- Figure 94:
- UNITED KINGDOM ANIMAL PROTEIN MARKET, ELDERLY NUTRITION AND MEDICAL NUTRITION, VALUE SHARE (%), BY PROTEIN TYPE, 2022 VS 2029
- Figure 95:
- UNITED KINGDOM ANIMAL PROTEIN MARKET, VOLUME IN METRIC TONNES, SPORT/PERFORMANCE NUTRITION, 2017 - 2029
- Figure 96:
- UNITED KINGDOM ANIMAL PROTEIN MARKET, VALUE IN USD, SPORT/PERFORMANCE NUTRITION, 2017 - 2029
- Figure 97:
- UNITED KINGDOM ANIMAL PROTEIN MARKET, SPORT/PERFORMANCE NUTRITION, VALUE SHARE (%), BY PROTEIN TYPE, 2022 VS 2029
- Figure 98:
- UNITED KINGDOM ANIMAL PROTEIN MARKET, MOST ACTIVE COMPANIES, BY NUMBER OF STRATEGIC MOVES, 2017 - 2022
- Figure 99:
- UNITED KINGDOM ANIMAL PROTEIN MARKET, TOTAL NUMBER OF STRATEGIC MOVES, 2017 - 2022
- Figure 100:
- UNITED KINGDOM ANIMAL PROTEIN MARKET SHARE(%), BY KEY PLAYERS, 2021
United Kingdom Animal Protein Industry Segmentation
Casein and Caseinates, Collagen, Egg Protein, Gelatin, Insect Protein, Milk Protein, Whey Protein are covered as segments by Protein Type. Animal Feed, Food and Beverages, Personal Care and Cosmetics, Supplements are covered as segments by End User.| Protein Type | |
| Casein and Caseinates | |
| Collagen | |
| Egg Protein | |
| Gelatin | |
| Insect Protein | |
| Milk Protein | |
| Whey Protein | |
| Other Animal Protein |
| End User | ||||||||||||
| Animal Feed | ||||||||||||
| ||||||||||||
| Personal Care and Cosmetics | ||||||||||||
|
Market Definition
- End User - The Protein Ingredients Market operates on a B2B basis. Food, Beverages, Supplements, Animal Feed, and Personal Care & Cosmetic manufacturers are considered to be end-consumers in the market studied. The scope excludes manufacturers buying liquid/dry whey to be used for application as a binding agent or thickener or other non-protein applications.
- Penetration Rate - Penetration Rate is defined as the percentage of Protein-Fortified End User Market Volume in the Overall End User Market Volume.
- Average Protein Content - It is the average protein content present in per 100 g of product manufactured by all end-user companies considered under the scope of this report.
Research Methodology
Mordor Intelligence follows a four-step methodology in all our reports.
- Step-1: Identify Key Variables: The quantifiable key variables (industry and extraneous) pertaining to the specific product segment and country are selected from a group of relevant variables & factors based on desk research & literature review; along with primary expert inputs. These variables are further confirmed through regression modeling (wherever required).
- Step-2: Build a Market Model: In order to build a robust forecasting methodology, the variables and factors identified in Step-1 are tested against available historical market numbers. Through an iterative process, the variables required for market forecast are set and the model is built on the basis of these variables.
- Step-3: Validate and Finalize: In this important step, all market numbers, variables and analyst calls are validated through an extensive network of primary research experts from the market studied. The respondents are selected across levels and functions to generate a holistic picture of the market studied.
- Step-4: Research Outputs: Syndicated Reports, Custom Consulting Assignments, Databases & Subscription Platforms


