United States Biostimulants Market Size

| Icons | Lable | Value |
|---|---|---|
|
|
Study Period | 2017 - 2029 |
|
|
Base Year For Estimation | 2022 |
|
|
CAGR | 13.47 % |
|
|
Largest Share by Form | Protein Hydrolysates |
|
|
Fastest Growing by Form | Humic Acid |
|
|
Market Concentration | High |
Major Players |
||
|
|
||
|
*Disclaimer: Major Players sorted in no particular order |
United States Biostimulants Market Analysis
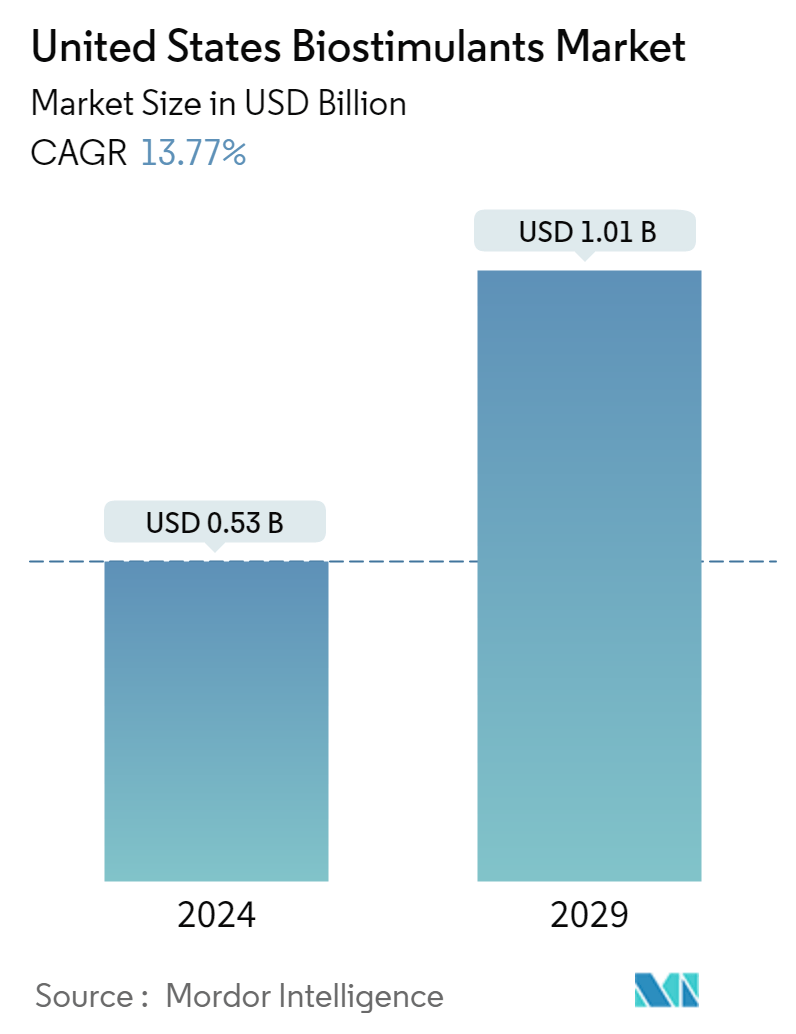
The United States Biostimulants Market is projected to register a CAGR of 13.47%
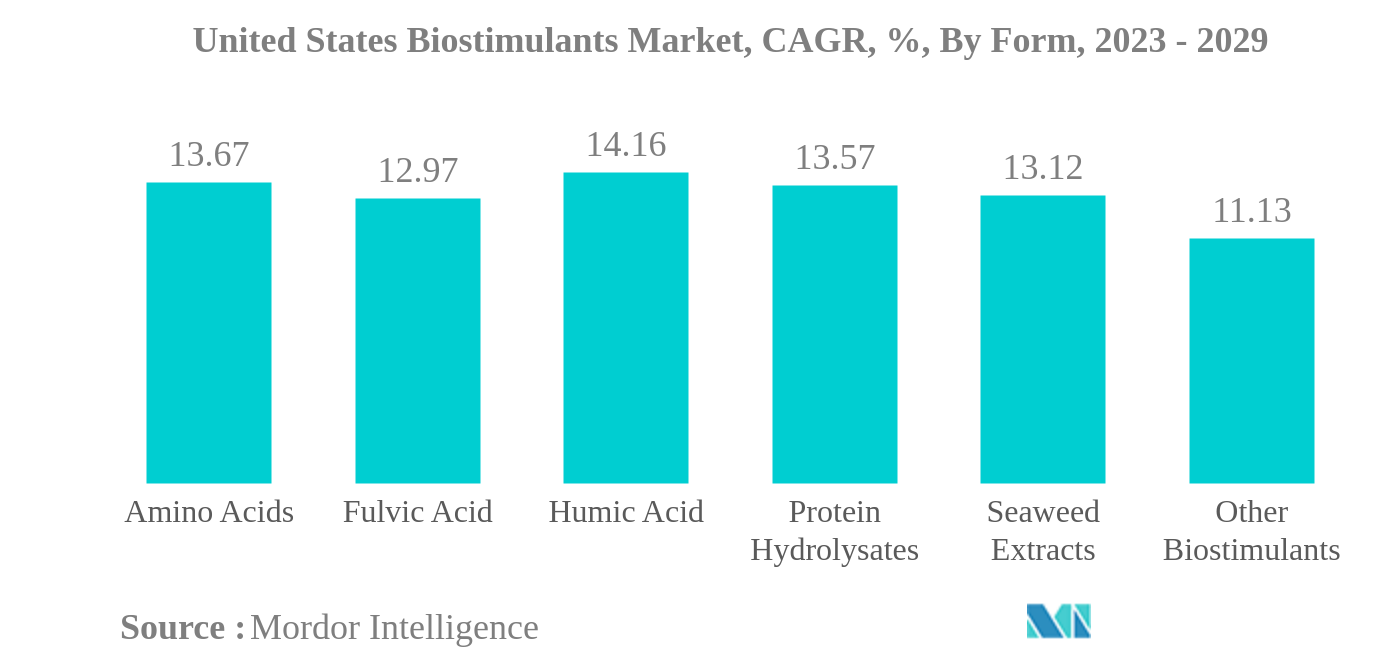
- Protein Hydrolysates is the Largest Form : Protein hydrolysates dominated United States biostimulants market in 2022 owing to their role in improving yield and quality traits in agricultural and horticultural crops.
- Humic Acid is the Fastest-growing Form : Humic acids aid in enhancing root, leaf, and shoot growth and also promote seed germination. Row crops dominated the market accounting for 70.7% of the market share in 2022.
- Row Crops is the Largest Crop Type : Major row crops grown in the country include corn, wheat, rice, soybean and barley. Protein hydrolysates dominated the row crops segment with a market share of 37.2% in 2022.
- Horticultural Crops is the Fastest-growing Crop Type : Potato, tomato, lettuce, cucumbers and watermelons are major horticulture crops grown in the country. Protein hydrolysates dominated the market with a share of 37.2% in 2022.
United States Biostimulants Market Trends
This section covers the major market trends shaping the United States Biostimulants Market according to our research experts:
Protein Hydrolysates is the largest Form
- The biostimulants market in the United States consists of many active ingredients, such as humic and fulvic acids, amino acids, protein hydrolysates, seaweed extracts, and other biostimulants like organic plants and animal derivatives.
- Protein hydrolysates held the highest share in the US biostimulants market, with a share of 37.3% in 2022. The market was valued at USD 70.1 million in 2022, with a consumption volume of 5.9 thousand metric tons. The use of protein hydrolysates can improve yield and quality traits in agricultural and horticultural crops, thus leading to their high share.
- Humic acids followed protein hydrolysates, accounting for a market share of 27.6% in 2022. Humic acids help improve the root system of crops such as soybean, wheat, rice, and maize; vegetable crops such as potato, tomato, cucumber, and pepper; and fruit crops such as citrus (Citrus limon) and grape (Vitis vinifera).
- The field crops held the maximum area under organic cultivation and accounted for a significant share of biostimulant consumption, i.e., 71.4% in 2022. These crops were followed by horticultural and cash crops, with shares of 27.5% and 1.1% in the same year, respectively.
- Despite the potentially positive effects on different crops reported in the scientific literature, there is little knowledge regarding biostimulant effects on commercially grown crops like citrus and strawberry and vegetables like tomato and capsicum, particularly in many states of the country, like Florida and California.
- The growing demand for organic products, the advancement of the agricultural industry, the increasing use of bio-based resources in farming, and supportive government policies drive the US market for biostimulants.
United States Biostimulants Industry Overview
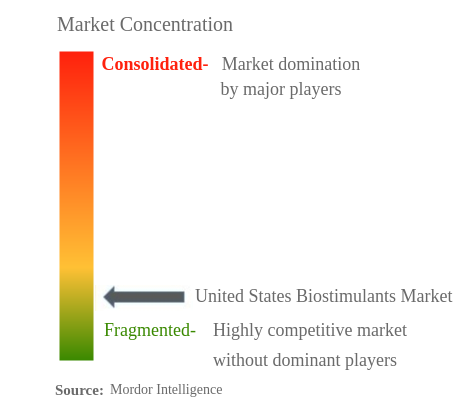
The United States Biostimulants Market is fragmented, with the top five companies occupying 6.66%. The major players in this market are BioLine Corporation, Corteva Agriscience, Hello Nature USA Inc., Humic Growth Solutions Inc. and Valagro USA (sorted alphabetically).
United States Biostimulants Market Leaders
BioLine Corporation
Corteva Agriscience
Hello Nature USA Inc.
Humic Growth Solutions Inc.
Valagro USA
*Disclaimer: Major Players sorted in no particular order
United States Biostimulants Market News
- July 2022: Corteva Agriscience introduced Sosdia Stress, an abiotic stress mitigator, to help farmers better manage drought-stressed crops. This product is derived from amino acids of natural origin.
- February 2022: Plant Response Inc. was acquired by The Mosaic Company, which is a global fertilizer manufacturer. This acquisition strengthened the company's global presence. Through the acquisition, the company develops new products and solutions for the customers in a sustainable way.
- May 2021: Plant Response Inc. announced its acquisition of WISErg, which is a startup that upcycles nutrients from recovered food for use in fertilizer and nutrient-efficient products that enhance plant and soil health.
United States Biostimulants Market Report - Table of Contents
EXECUTIVE SUMMARY & KEY FINDINGS
REPORT OFFERS
1. INTRODUCTION
1.1. Study Assumptions & Market Definition
1.2. Scope of the Study
1.3. Research Methodology
2. KEY INDUSTRY TRENDS
2.1. Area Under Organic Cultivation
2.2. Per Capita Spending On Organic Products
2.3. Regulatory Framework
2.4. Value Chain & Distribution Channel Analysis
3. MARKET SEGMENTATION
3.1. Form
3.1.1. Amino Acids
3.1.2. Fulvic Acid
3.1.3. Humic Acid
3.1.4. Protein Hydrolysates
3.1.5. Seaweed Extracts
3.1.6. Other Biostimulants
3.2. Crop Type
3.2.1. Cash Crops
3.2.2. Horticultural Crops
3.2.3. Row Crops
4. COMPETITIVE LANDSCAPE
4.1. Key Strategic Moves
4.2. Market Share Analysis
4.3. Company Landscape
4.4. Company Profiles
4.4.1. BioLine Corporation
4.4.2. Corteva Agriscience
4.4.3. FBSciences Inc.
4.4.4. Hello Nature USA Inc.
4.4.5. Humic Growth Solutions Inc.
4.4.6. Ocean Organics Corp.
4.4.7. Plant Response Biotech Inc.
4.4.8. Sigma Agriscience LLC
4.4.9. Symborg Inc.
4.4.10. Valagro USA
5. KEY STRATEGIC QUESTIONS FOR AGRICULTURAL BIOLOGICALS CEOS
6. APPENDIX
6.1. Global Overview
6.1.1. Overview
6.1.2. Porter’s Five Forces Framework
6.1.3. Global Value Chain Analysis
6.1.4. Market Dynamics (DROs)
6.2. Sources & References
6.3. List of Tables & Figures
6.4. Primary Insights
6.5. Data Pack
6.6. Glossary of Terms
List of Tables & Figures
- Figure 1:
- UNITED STATES BIOSTIMULANTS MARKET, AREA UNDER ORGANIC CULTIVATION, HECTARES, 2017 - 2022
- Figure 2:
- UNITED STATES BIOSTIMULANTS MARKET, PER CAPITA SPENDING ON ORGANIC PRODUCTS, USD, 2017 - 2022
- Figure 3:
- UNITED STATES BIOSTIMULANTS MARKET, VOLUME, METRIC TON, 2017 - 2029
- Figure 4:
- UNITED STATES BIOSTIMULANTS MARKET, VALUE, USD, 2017 - 2029
- Figure 5:
- UNITED STATES BIOSTIMULANTS MARKET, BY FORM, VOLUME, METRIC TON, 2017 - 2029
- Figure 6:
- UNITED STATES BIOSTIMULANTS MARKET, BY FORM, VALUE, USD, 2017 - 2029
- Figure 7:
- UNITED STATES BIOSTIMULANTS MARKET, VOLUME SHARE(%), BY FORM, 2017 - 2029
- Figure 8:
- UNITED STATES BIOSTIMULANTS MARKET, VALUE SHARE(%), BY FORM, 2017 - 2029
- Figure 9:
- UNITED STATES BIOSTIMULANTS MARKET, BY FORM, VOLUME, METRIC TON, 2017 - 2029
- Figure 10:
- UNITED STATES BIOSTIMULANTS MARKET, BY FORM, VALUE, USD, 2017 - 2029
- Figure 11:
- UNITED STATES BIOSTIMULANTS MARKET, VALUE SHARE(%), BY CROP TYPE, 2022 - 2029
- Figure 12:
- UNITED STATES BIOSTIMULANTS MARKET, BY FORM, VOLUME, METRIC TON, 2017 - 2029
- Figure 13:
- UNITED STATES BIOSTIMULANTS MARKET, BY FORM, VALUE, USD, 2017 - 2029
- Figure 14:
- UNITED STATES BIOSTIMULANTS MARKET, VALUE SHARE(%), BY CROP TYPE, 2022 - 2029
- Figure 15:
- UNITED STATES BIOSTIMULANTS MARKET, BY FORM, VOLUME, METRIC TON, 2017 - 2029
- Figure 16:
- UNITED STATES BIOSTIMULANTS MARKET, BY FORM, VALUE, USD, 2017 - 2029
- Figure 17:
- UNITED STATES BIOSTIMULANTS MARKET, VALUE SHARE(%), BY CROP TYPE, 2022 - 2029
- Figure 18:
- UNITED STATES BIOSTIMULANTS MARKET, BY FORM, VOLUME, METRIC TON, 2017 - 2029
- Figure 19:
- UNITED STATES BIOSTIMULANTS MARKET, BY FORM, VALUE, USD, 2017 - 2029
- Figure 20:
- UNITED STATES BIOSTIMULANTS MARKET, VALUE SHARE(%), BY CROP TYPE, 2022 - 2029
- Figure 21:
- UNITED STATES BIOSTIMULANTS MARKET, BY FORM, VOLUME, METRIC TON, 2017 - 2029
- Figure 22:
- UNITED STATES BIOSTIMULANTS MARKET, BY FORM, VALUE, USD, 2017 - 2029
- Figure 23:
- UNITED STATES BIOSTIMULANTS MARKET, VALUE SHARE(%), BY CROP TYPE, 2022 - 2029
- Figure 24:
- UNITED STATES BIOSTIMULANTS MARKET, BY FORM, VOLUME, METRIC TON, 2017 - 2029
- Figure 25:
- UNITED STATES BIOSTIMULANTS MARKET, BY FORM, VALUE, USD, 2017 - 2029
- Figure 26:
- UNITED STATES BIOSTIMULANTS MARKET, VALUE SHARE(%), BY CROP TYPE, 2022 - 2029
- Figure 27:
- UNITED STATES BIOSTIMULANTS MARKET, BY CROP TYPE, VOLUME, METRIC TON, 2017 - 2029
- Figure 28:
- UNITED STATES BIOSTIMULANTS MARKET, BY CROP TYPE, VALUE, USD, 2017 - 2029
- Figure 29:
- UNITED STATES BIOSTIMULANTS MARKET, VOLUME SHARE(%), BY CROP TYPE, 2017 - 2029
- Figure 30:
- UNITED STATES BIOSTIMULANTS MARKET, VALUE SHARE(%), BY CROP TYPE, 2017 - 2029
- Figure 31:
- UNITED STATES BIOSTIMULANTS MARKET, BY CROP TYPE, VOLUME, METRIC TON, 2017 - 2029
- Figure 32:
- UNITED STATES BIOSTIMULANTS MARKET, BY CROP TYPE, VALUE, USD, 2017 - 2029
- Figure 33:
- UNITED STATES BIOSTIMULANTS MARKET, VALUE SHARE(%), BY FORM, 2022 - 2029
- Figure 34:
- UNITED STATES BIOSTIMULANTS MARKET, BY CROP TYPE, VOLUME, METRIC TON, 2017 - 2029
- Figure 35:
- UNITED STATES BIOSTIMULANTS MARKET, BY CROP TYPE, VALUE, USD, 2017 - 2029
- Figure 36:
- UNITED STATES BIOSTIMULANTS MARKET, VALUE SHARE(%), BY FORM, 2022 - 2029
- Figure 37:
- UNITED STATES BIOSTIMULANTS MARKET, BY CROP TYPE, VOLUME, METRIC TON, 2017 - 2029
- Figure 38:
- UNITED STATES BIOSTIMULANTS MARKET, BY CROP TYPE, VALUE, USD, 2017 - 2029
- Figure 39:
- UNITED STATES BIOSTIMULANTS MARKET, VALUE SHARE(%), BY FORM, 2022 - 2029
- Figure 40:
- UNITED STATES BIOSTIMULANTS MARKET, MOST ACTIVE COMPANIES, BY NUMBER OF STRATEGIC MOVES, 2017-2022
- Figure 41:
- UNITED STATES BIOSTIMULANTS MARKET, MOST ADOPTED STRATEGIES, 2017-2022
- Figure 42:
- UNITED STATES BIOSTIMULANTS MARKET SHARE(%), BY MAJOR PLAYERS, 2022
United States Biostimulants Industry Segmentation
Amino Acids, Fulvic Acid, Humic Acid, Protein Hydrolysates, Seaweed Extracts are covered as segments by Form. Cash Crops, Horticultural Crops, Row Crops are covered as segments by Crop Type.| Form | |
| Amino Acids | |
| Fulvic Acid | |
| Humic Acid | |
| Protein Hydrolysates | |
| Seaweed Extracts | |
| Other Biostimulants |
| Crop Type | |
| Cash Crops | |
| Horticultural Crops | |
| Row Crops |
Market Definition
- AVERAGE DOSAGE RATE - This refers to the average volume of biostimulants applied per hectare of farmland in the country.
- CROP TYPE - Row Crops: Cereals, Pulses, Oilseeds, and Forage Crops Horticulture: Fruits, and Vegetables, Cash Crops: Plantation Crops and Spices.
- FUNCTIONS - Biostimulants
- MARKET ESTIMATION LEVEL - Market Estimations for various types of biostimulants has been done at the product-level.
Research Methodology
Mordor Intelligence follows a four-step methodology in all our reports.
- Step-1: Identify Key Variables: In order to build a robust forecasting methodology, the variables and factors identified in Step-1 are tested against available historical market numbers. Through an iterative process, the variables required for market forecast are set and the model is built on the basis of these variables.
- Step-2: Build a Market Model: Market-size estimations for the forecast years are in nominal terms. Inflation is not a part of the pricing, and the average selling price (ASP) is kept constant throughout the forecast period.
- Step-3: Validate and Finalize: In this important step, all market numbers, variables and analyst calls are validated through an extensive network of primary research experts from the market studied. The respondents are selected across levels and functions to generate a holistic picture of the market studied.
- Step-4: Research Outputs: Syndicated Reports, Custom Consulting Assignments, Databases & Subscription Platforms.


