United States Casein And Caseinate Market Size

| Icons | Lable | Value |
|---|---|---|
|
|
Study Period | 2017 - 2029 |
|
|
Base Year For Estimation | 2022 |
|
|
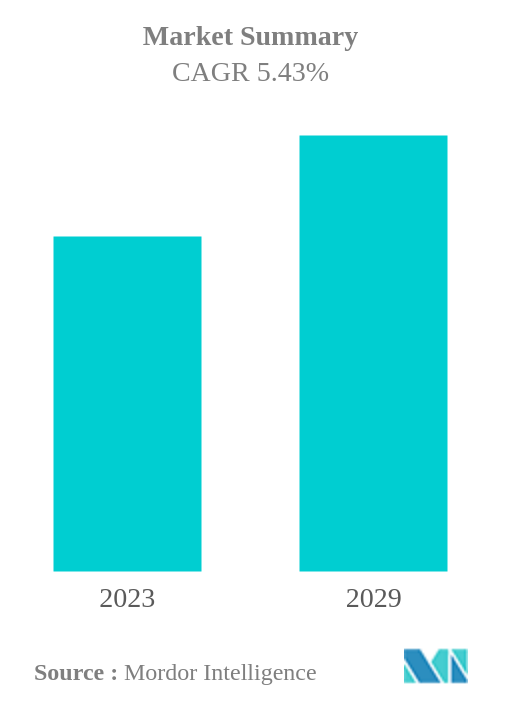
CAGR | 5.43 % |
|
|
Largest Share by End User | Supplements |
|
|
Fastest Growing by End User | Supplements |
|
|
Market Concentration | High |
Major Players |
||
|
|
||
|
*Disclaimer: Major Players sorted in no particular order |
United States Casein And Caseinate Market Analysis
The United States Casein And Caseinate Market is projected to register a CAGR of 5.43%
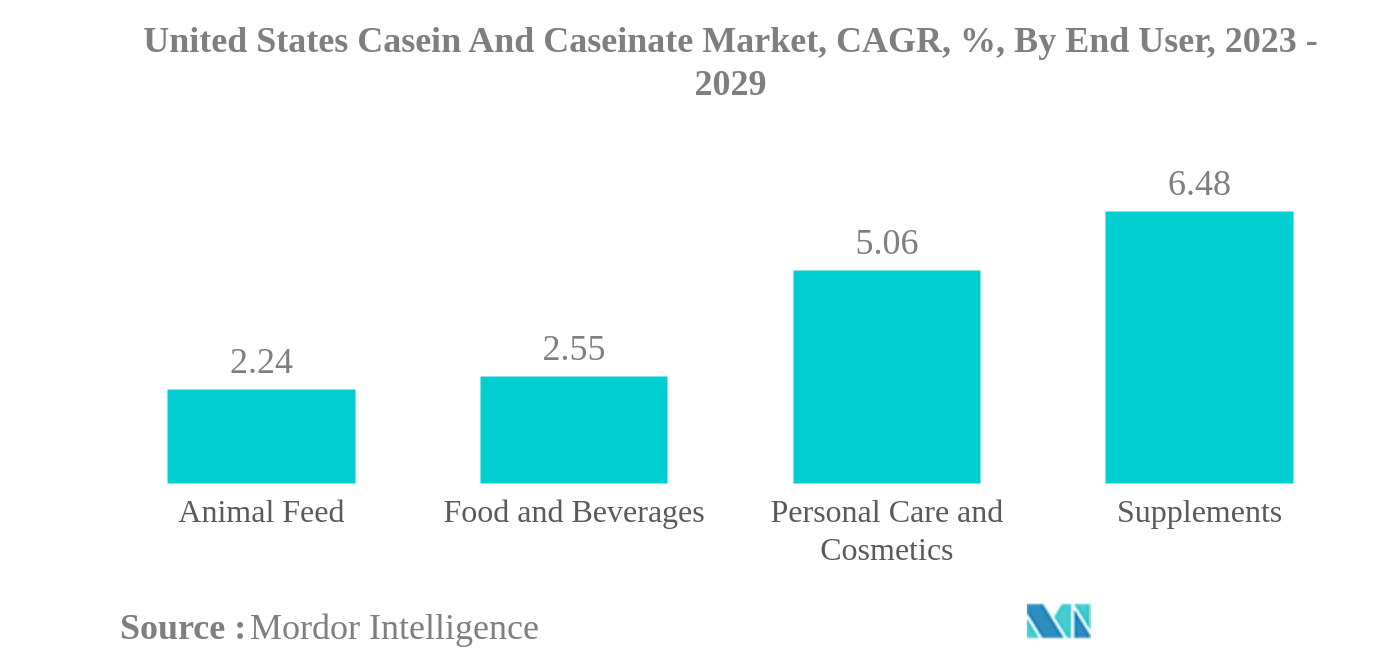
- Supplements is the Largest End User : The supplement industry has been identified as the largest end user. Casein and Caseinates aid in recovery and muscle loss reduction, which drives the application.
- Supplements is the Fastest-growing End User : The rising rate of gym memberships, along with trainers recommending protein consumption, is projected to propel the supplements segment’s growth during the forecast period.
United States Casein And Caseinate Market Trends
This section covers the major market trends shaping the United States Casein And Caseinate Market according to our research experts:
Supplements is the largest End User
- The supplements segment (particularly sports nutrition) dominated the market throughout the review period. Sports nutrition is also projected to register a CAGR of 6.75% during the forecast period (2023-2029). Being a slow-digesting protein (taking over a period of ~ 6–7 h), it can satiate for a longer period, allowing it to be used in products, such as meal replacement and weight loss products. Among all, micellar casein gained huge market penetration in the study period due to its high protein content (90% un-denatured protein) and high levels of bioavailable calcium.
- The sports nutrition segment majorly drives the casein market. An increase in awareness about the benefits of sports nutrition products has increased the growth of the sports nutrition segment in the country. However, the closure of gyms and health clubs in 2020 (22% in the US) resulted in an approximate loss of USD 29.2 billion in revenue) and suspended sports competitions during the COVID-19 pandemic, resulting in sluggish market growth.
- The food and beverage segment is the second major segment in the market. The value of the segment increased by around 25% from 2017 to 2022. The key reason for the rising application of caseins and caseinates in this segment is the ability of caseins to be digested slowly, which is highly required in products like meal replacement or weight loss products. Among the category, beverages is the fastest growing and is projected to register a CAGR of 2.73% during the forecast period. Consumers are increasingly reaching for dairy-based and other products containing functional ingredients to ward off illness or help with existing health issues. Companies are capitalizing on the trend by adding concentrated substances to their products.
United States Casein And Caseinate Industry Overview
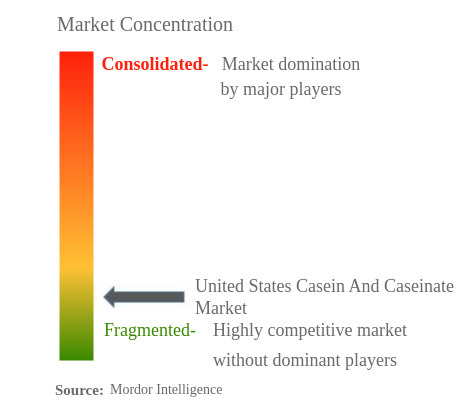
The United States Casein And Caseinate Market is fragmented, with the top five companies occupying 22.46%. The major players in this market are AMCO Proteins, Arla Foods amba, Fonterra Co-operative Group Limited, FrieslandCampina Ingredients and Tatua Co-operative Dairy Company Ltd (sorted alphabetically).
United States Casein And Caseinate Market Leaders
AMCO Proteins
Arla Foods amba
Fonterra Co-operative Group Limited
FrieslandCampina Ingredients
Tatua Co-operative Dairy Company Ltd
*Disclaimer: Major Players sorted in no particular order
United States Casein And Caseinate Market News
- January 2022: Hoogwegt has entered into a strategic long-term partnership with Royal A-ware for the sale of milk powders and cream produced by Royal A-ware.The collaboration strengthens the core activities of the companies.
- August 2021: Milk Specialties Global has acquired the 96,000-square-foot Kay’s Processing facility in Minnesota, as well as Kay’s Naturals high-protein and gluten-free snack brand. This is the 11th plant of the company has been renamed Milk Specialties Global Clara City Facility.
- April 2021: FrieslandCampina Ingredients launched a new portfolio, including Excellion Calcium Caseinate S, to aid in the production of softer protein bars. Other products launched included Nutri Whey 800F, Nutri Whey Isolate, Biotis GOS, Excellion EM9, and the new Excellion Textpro. The portfolio was a key solution to address the hardening problem many formulators currently face.
United States Casein And Caseinate Market Report - Table of Contents
EXECUTIVE SUMMARY & KEY FINDINGS
1. INTRODUCTION
1.1. Study Assumptions & Market Definition
1.2. Scope of the Study
1.3. Research Methodology
2. KEY INDUSTRY TRENDS
2.1. End User Market Volume
2.2. Protein Consumption Trends
2.3. Production Trends
2.4. Regulatory Framework
2.5. Value Chain & Distribution Channel Analysis
3. MARKET SEGMENTATION
3.1. End User
3.1.1. Animal Feed
3.1.2. Food And Beverages
3.1.2.1. By Sub End User
3.1.2.1.1. Bakery
3.1.2.1.2. Beverages
3.1.2.1.3. Confectionery
3.1.2.1.4. Dairy And Dairy Alternative Products
3.1.2.1.5. RTE/RTC Food Products
3.1.2.1.6. Snacks
3.1.3. Personal Care And Cosmetics
3.1.4. Supplements
3.1.4.1. By Sub End User
3.1.4.1.1. Baby Food And Infant Formula
3.1.4.1.2. Elderly Nutrition And Medical Nutrition
3.1.4.1.3. Sport/Performance Nutrition
4. COMPETITIVE LANDSCAPE
4.1. Key Strategic Moves
4.2. Market Share Analysis
4.3. Company Landscape
4.4. Company Profiles
4.4.1. AMCO Proteins
4.4.2. Arla Foods amba
4.4.3. Erie Group International Inc.
4.4.4. Farbest-Tallman Foods Corporation
4.4.5. Fonterra Co-operative Group Limited
4.4.6. FrieslandCampina Ingredients
4.4.7. Hoogwegt Group
4.4.8. Milk Specialties Global
4.4.9. Tatua Co-operative Dairy Company Ltd
5. KEY STRATEGIC QUESTIONS FOR PROTEIN INGREDIENTS INDUSTRY CEOS
6. APPENDIX
6.1. Global Overview
6.1.1. Overview
6.1.2. Porter’s Five Forces Framework
6.1.3. Global Value Chain Analysis
6.1.4. Market Dynamics (DROs)
6.2. Sources & References
6.3. List of Tables & Figures
6.4. Primary Insights
6.5. Data Pack
6.6. Glossary of Terms
List of Tables & Figures
- Figure 1:
- UNITED STATES BABY FOOD AND INFANT FORMULA MARKET, VOLUME IN METRIC TONNES, 2017 - 2029
- Figure 2:
- UNITED STATES BAKERY MARKET, VOLUME IN METRIC TONNES, 2017 - 2029
- Figure 3:
- UNITED STATES BEVERAGES MARKET, VOLUME IN METRIC TONNES, 2017 - 2029
- Figure 4:
- UNITED STATES BREAKFAST CEREALS MARKET, VOLUME IN METRIC TONNES, 2017 - 2029
- Figure 5:
- UNITED STATES CONDIMENTS/SAUCES MARKET, VOLUME IN METRIC TONNES, 2017 - 2029
- Figure 6:
- UNITED STATES CONFECTIONERY MARKET, VOLUME IN METRIC TONNES, 2017 - 2029
- Figure 7:
- UNITED STATES DAIRY AND DAIRY ALTERNATIVE PRODUCTS MARKET, VOLUME IN METRIC TONNES, 2017 - 2029
- Figure 8:
- UNITED STATES ELDERLY NUTRITION AND MEDICAL NUTRITION MARKET, VOLUME IN METRIC TONNES, 2017 - 2029
- Figure 9:
- UNITED STATES MEAT/POULTRY/SEAFOOD AND MEAT ALTERNATIVE PRODUCTS MARKET, VOLUME IN METRIC TONNES, 2017 - 2029
- Figure 10:
- UNITED STATES RTE/RTC FOOD PRODUCTS MARKET, VOLUME IN METRIC TONNES, 2017 - 2029
- Figure 11:
- UNITED STATES SNACKS MARKET, VOLUME IN METRIC TONNES, 2017 - 2029
- Figure 12:
- UNITED STATES SPORT/PERFORMANCE NUTRITION MARKET, VOLUME IN METRIC TONNES, 2017 - 2029
- Figure 13:
- UNITED STATES ANIMAL FEED MARKET, VOLUME IN METRIC TONNES, 2017 - 2029
- Figure 14:
- UNITED STATES PERSONAL CARE AND COSMETICS MARKET, VOLUME IN METRIC TONNES, 2017 - 2029
- Figure 15:
- UNITED STATES PER CAPITA CONSUMPTION OF ANIMAL PROTEIN, IN GRAM, 2017 - 2029
- Figure 16:
- UNITED STATES ANIMAL MILK PRODUCTION, IN METRIC TONNES, 2017 - 2021
- Figure 17:
- UNITED STATES CASEIN AND CASEINATE MARKET, 2015-2026
- Figure 18:
- UNITED STATES CASEIN AND CASEINATE MARKET, 2015-2026
- Figure 19:
- UNITED STATES CASEIN AND CASEINATE MARKET, VOLUME IN METRIC TONNES, BY END USER, 2017 - 2029
- Figure 20:
- UNITED STATES CASEIN AND CASEINATE MARKET, VALUE IN USD, BY END USER, 2017 - 2029
- Figure 21:
- UNITED STATES CASEIN AND CASEINATE MARKET, VALUE SHARE (%), BY END USER, 2017 VS 2023 VS 2029
- Figure 22:
- UNITED STATES CASEIN AND CASEINATE MARKET, VOLUME SHARE (%), BY END USER, 2017 VS 2023 VS 2029
- Figure 23:
- UNITED STATES CASEIN AND CASEINATE MARKET, VOLUME IN METRIC TONNES, ANIMAL FEED, 2017 - 2029
- Figure 24:
- UNITED STATES CASEIN AND CASEINATE MARKET, VALUE IN USD, ANIMAL FEED, 2017 - 2029
- Figure 25:
- UNITED STATES CASEIN AND CASEINATE MARKET, VOLUME IN METRIC TONNES, BY SUB END USER, 2017 - 2029
- Figure 26:
- UNITED STATES CASEIN AND CASEINATE MARKET, VALUE IN USD, BY SUB END USER, 2017 - 2029
- Figure 27:
- UNITED STATES CASEIN AND CASEINATE MARKET, VALUE SHARE (%), BY SUB END USER, 2017 VS 2023 VS 2029
- Figure 28:
- UNITED STATES CASEIN AND CASEINATE MARKET, VOLUME SHARE (%), BY SUB END USER, 2017 VS 2023 VS 2029
- Figure 29:
- UNITED STATES CASEIN AND CASEINATE MARKET, VOLUME IN METRIC TONNES, BAKERY, 2017 - 2029
- Figure 30:
- UNITED STATES CASEIN AND CASEINATE MARKET, VALUE IN USD, BAKERY, 2017 - 2029
- Figure 31:
- UNITED STATES CASEIN AND CASEINATE MARKET, VOLUME IN METRIC TONNES, BEVERAGES, 2017 - 2029
- Figure 32:
- UNITED STATES CASEIN AND CASEINATE MARKET, VALUE IN USD, BEVERAGES, 2017 - 2029
- Figure 33:
- UNITED STATES CASEIN AND CASEINATE MARKET, VOLUME IN METRIC TONNES, CONFECTIONERY, 2017 - 2029
- Figure 34:
- UNITED STATES CASEIN AND CASEINATE MARKET, VALUE IN USD, CONFECTIONERY, 2017 - 2029
- Figure 35:
- UNITED STATES CASEIN AND CASEINATE MARKET, VOLUME IN METRIC TONNES, DAIRY AND DAIRY ALTERNATIVE PRODUCTS, 2017 - 2029
- Figure 36:
- UNITED STATES CASEIN AND CASEINATE MARKET, VALUE IN USD, DAIRY AND DAIRY ALTERNATIVE PRODUCTS, 2017 - 2029
- Figure 37:
- UNITED STATES CASEIN AND CASEINATE MARKET, VOLUME IN METRIC TONNES, RTE/RTC FOOD PRODUCTS, 2017 - 2029
- Figure 38:
- UNITED STATES CASEIN AND CASEINATE MARKET, VALUE IN USD, RTE/RTC FOOD PRODUCTS, 2017 - 2029
- Figure 39:
- UNITED STATES CASEIN AND CASEINATE MARKET, VOLUME IN METRIC TONNES, SNACKS, 2017 - 2029
- Figure 40:
- UNITED STATES CASEIN AND CASEINATE MARKET, VALUE IN USD, SNACKS, 2017 - 2029
- Figure 41:
- UNITED STATES CASEIN AND CASEINATE MARKET, VOLUME IN METRIC TONNES, PERSONAL CARE AND COSMETICS, 2017 - 2029
- Figure 42:
- UNITED STATES CASEIN AND CASEINATE MARKET, VALUE IN USD, PERSONAL CARE AND COSMETICS, 2017 - 2029
- Figure 43:
- UNITED STATES CASEIN AND CASEINATE MARKET, VOLUME IN METRIC TONNES, BY SUB END USER, 2017 - 2029
- Figure 44:
- UNITED STATES CASEIN AND CASEINATE MARKET, VALUE IN USD, BY SUB END USER, 2017 - 2029
- Figure 45:
- UNITED STATES CASEIN AND CASEINATE MARKET, VALUE SHARE (%), BY SUB END USER, 2017 VS 2023 VS 2029
- Figure 46:
- UNITED STATES CASEIN AND CASEINATE MARKET, VOLUME SHARE (%), BY SUB END USER, 2017 VS 2023 VS 2029
- Figure 47:
- UNITED STATES CASEIN AND CASEINATE MARKET, VOLUME IN METRIC TONNES, BABY FOOD AND INFANT FORMULA, 2017 - 2029
- Figure 48:
- UNITED STATES CASEIN AND CASEINATE MARKET, VALUE IN USD, BABY FOOD AND INFANT FORMULA, 2017 - 2029
- Figure 49:
- UNITED STATES CASEIN AND CASEINATE MARKET, VOLUME IN METRIC TONNES, ELDERLY NUTRITION AND MEDICAL NUTRITION, 2017 - 2029
- Figure 50:
- UNITED STATES CASEIN AND CASEINATE MARKET, VALUE IN USD, ELDERLY NUTRITION AND MEDICAL NUTRITION, 2017 - 2029
- Figure 51:
- UNITED STATES CASEIN AND CASEINATE MARKET, VOLUME IN METRIC TONNES, SPORT/PERFORMANCE NUTRITION, 2017 - 2029
- Figure 52:
- UNITED STATES CASEIN AND CASEINATE MARKET, VALUE IN USD, SPORT/PERFORMANCE NUTRITION, 2017 - 2029
- Figure 53:
- UNITED STATES CASEIN AND CASEINATE MARKET, MOST ACTIVE COMPANIES, BY NUMBER OF STRATEGIC MOVES, 2017 - 2022
- Figure 54:
- UNITED STATES CASEIN AND CASEINATE MARKET, TOTAL NUMBER OF STRATEGIC MOVES, 2017 - 2022
- Figure 55:
- UNITED STATES CASEIN AND CASEINATE MARKET SHARE(%), BY KEY PLAYERS, 2021
United States Casein And Caseinate Industry Segmentation
Animal Feed, Food And Beverages, Personal Care And Cosmetics, Supplements are covered as segments by End User.| End User | ||||||||||
| Animal Feed | ||||||||||
| ||||||||||
| Personal Care And Cosmetics | ||||||||||
|
Market Definition
- End User - The Protein Ingredients Market operates on a B2B basis. Food, Beverages, Supplements, Animal Feed, and Personal Care & Cosmetic manufacturers are considered to be end-consumers in the market studied. The scope excludes manufacturers buying liquid/dry whey to be used for application as a binding agent or thickener or other non-protein applications.
- Penetration Rate - Penetration Rate is defined as the percentage of Protein-Fortified End User Market Volume in the Overall End User Market Volume.
- Average Protein Content - It is the average protein content present in per 100 g of product manufactured by all end-user companies considered under the scope of this report.
Research Methodology
Mordor Intelligence follows a four-step methodology in all our reports.
- Step-1: Identify Key Variables: The quantifiable key variables (industry and extraneous) pertaining to the specific product segment and country are selected from a group of relevant variables & factors based on desk research & literature review; along with primary expert inputs. These variables are further confirmed through regression modeling (wherever required).
- Step-2: Build a Market Model: In order to build a robust forecasting methodology, the variables and factors identified in Step-1 are tested against available historical market numbers. Through an iterative process, the variables required for market forecast are set and the model is built on the basis of these variables.
- Step-3: Validate and Finalize: In this important step, all market numbers, variables and analyst calls are validated through an extensive network of primary research experts from the market studied. The respondents are selected across levels and functions to generate a holistic picture of the market studied.
- Step-4: Research Outputs: Syndicated Reports, Custom Consulting Assignments, Databases & Subscription Platforms


