US Tofu Market Size

| Icons | Lable | Value |
|---|---|---|
|
|
Study Period | 2016 - 2028 |
|
|
Base Year For Estimation | 2021 |
|
|
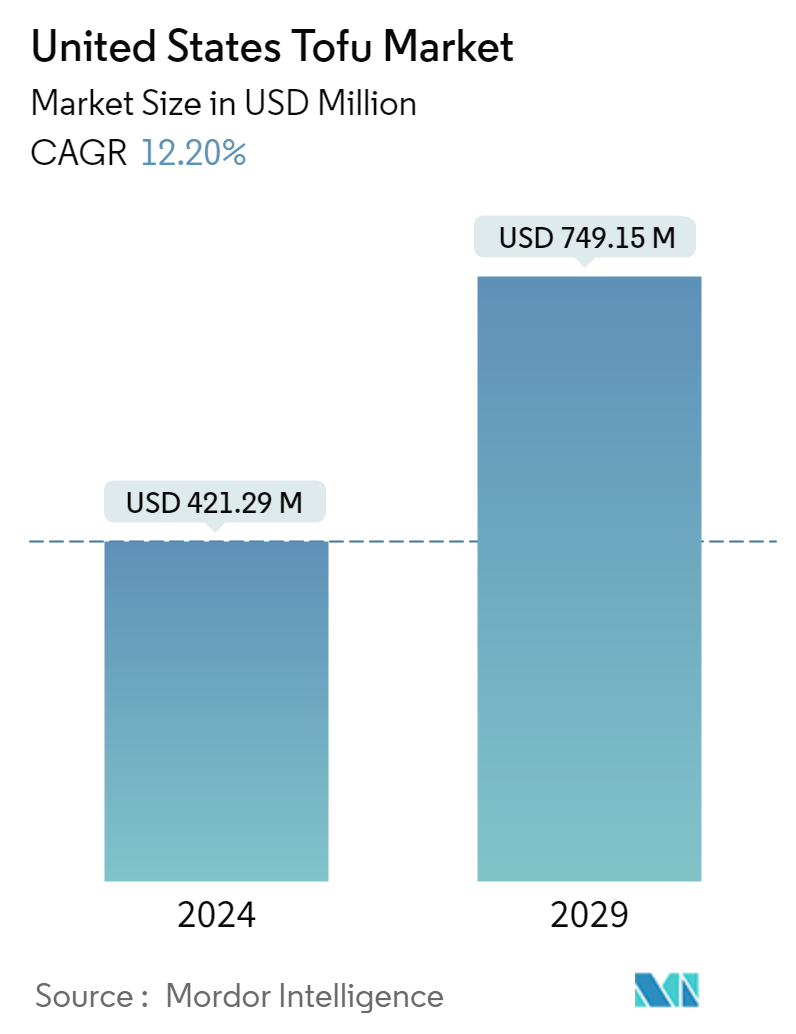
CAGR | 11.14 % |
|
|
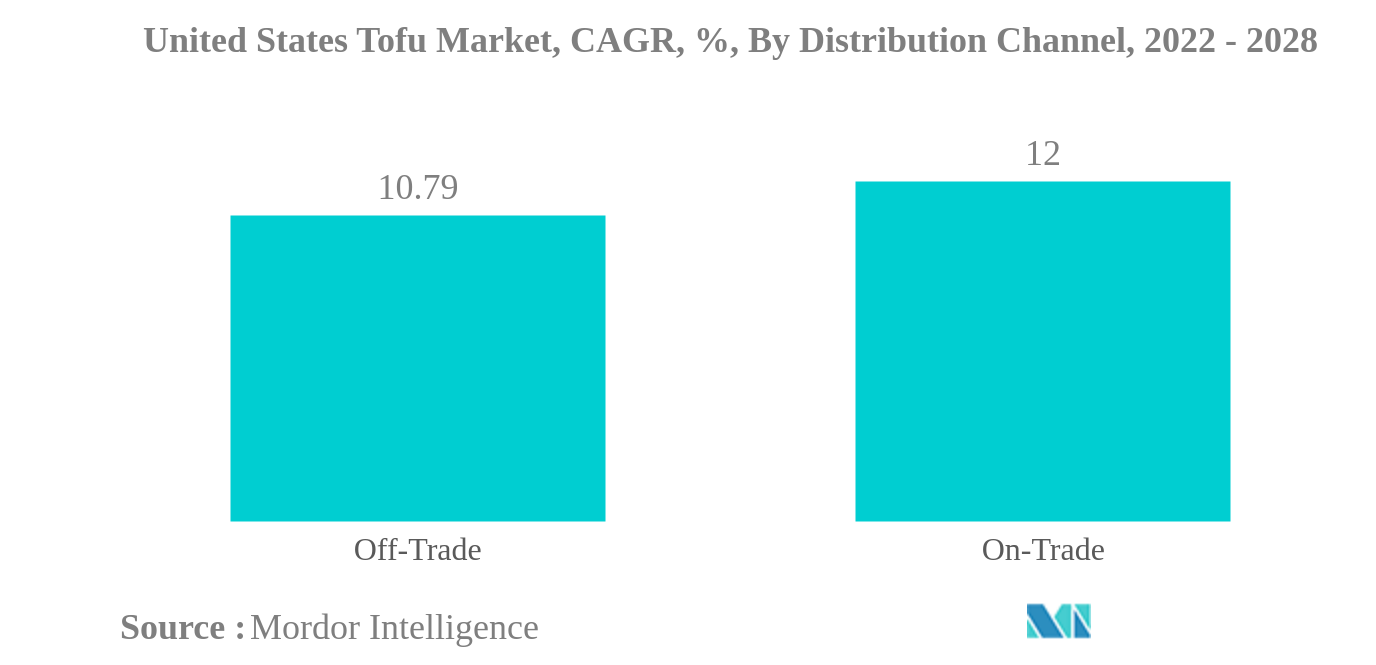
Largest Share by Distribution Channel | Off-Trade |
|
|
Fastest Growing by Distribution Channel | On-Trade |
|
|
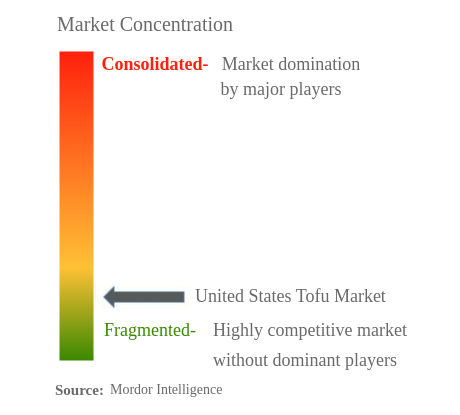
Market Concentration | High |
Major Players |
||
|
|
||
|
*Disclaimer: Major Players sorted in no particular order |
US Tofu Market Analysis
The United States Tofu Market is projected to register a CAGR of 11.14%
- Off-Trade is the Largest Distribution Channel : Online channel is likely to drive the growth of tofu sales through off-trade channels. The onset of the experiential economy has prompted customers to prefer this channel.
- On-Trade is the Fastest-growing Distribution Channel : On-trade distribution channel purchases of tofu are aligned with the country's growing foodservice sector, including vegan restaurants, impacting its bulk purchases.
US Tofu Market Trends
This section covers the major market trends shaping the United States Tofu Market according to our research experts:
Off-Trade is the largest Distribution Channel
- The US tofu market is dominated by the off-trade segment in terms of distribution channels, with 43% more share than the on-trade distribution channel. Among all the off-trade segments of the US tofu market, supermarkets and hypermarkets have the highest market share, with 68% by value, in 2022. The availability of different types of tofu-based products in bulk to cater to customer needs makes supermarkets a better place for purchasing. Post-pandemic, more consumers prefer one-stop centers to buy tofu products.
- The overall US tofu market increased at a rate of 38.05% by value and 30.80% by volume from 2016 to 2021. This increase was mainly due to the rise in the number of supermarkets, hotels, food enterprises, grocery stores, and other distribution channels. The number of supermarkets increased by 4.3% from 2021 to 2022, and online channels rose by 20% from 2020 to 2021. Also, the growth of customer touchpoints led to an increase in tofu sales.
- The online channel in the off-trade distribution channel is projected to be the fastest-growing distribution channel in the US tofu market, registering a CAGR value of 15.49% during the forecast period, 2022-2028. With the increase in technological adoption by consumers, manufacturers also increased their digital presence through e-commerce, offering B2C and B2B services and multiple tofu varieties. Increasing demand for new tofu varieties in online channels drives the market.
US Tofu Industry Overview
The United States Tofu Market is fragmented, with the top five companies occupying 25.68%. The major players in this market are Albertsons Companies, House Foods Group Inc., Morinaga Milk Industry Co. Ltd, Pulmuone Foods USA Inc. and The Hain Celestial Group, Inc. (sorted alphabetically).
US Tofu Market Leaders
Albertsons Companies
House Foods Group Inc.
Morinaga Milk Industry Co. Ltd
Pulmuone Foods USA Inc.
The Hain Celestial Group, Inc.
*Disclaimer: Major Players sorted in no particular order
US Tofu Market News
- May 2022: Albertsons Companies partnered with Veeve Inc., a leading retail technology startup, to help consumers skip the checkout line with fast, convenient, and contactless shopping.
- May 2022: The US-based ride-sharing service provider Uber Technologies partnered with Albertsons Companies by adding more US stores to Uber Eats. This partnership may help the company expand its market penetration.
- April 2022: Hodo launched the Vegan All-Day Egg Scramble, which contains high protein and is minimally processed. The primary ingredient used is soybeans.
US Tofu Market Report - Table of Contents
1. INTRODUCTION
1.1. Study Assumptions & Market Definition
1.2. Scope of the Study
1.3. Research Methodology
2. KEY INDUSTRY TRENDS
2.1. Price Trends
2.2. Regulatory Framework
2.3. Value Chain & Distribution Channel Analysis
3. MARKET SEGMENTATION
3.1. Distribution Channel
3.1.1. Off-Trade
3.1.1.1. Convenience Stores
3.1.1.2. Online Channel
3.1.1.3. Supermarkets And Hypermarkets
3.1.1.4. Others
3.1.2. On-Trade
4. COMPETITIVE LANDSCAPE
4.1. Key Strategic Moves
4.2. Market Share Analysis
4.3. Company Landscape
4.4. Company Profiles
4.4.1. AFC American Food Company
4.4.2. Albertsons Companies
4.4.3. Hodo Inc.
4.4.4. House Foods Group Inc.
4.4.5. Morinaga Milk Industry Co. Ltd
4.4.6. Pulmuone Foods USA Inc.
4.4.7. Superior Natural LLC
4.4.8. The Hain Celestial Group, Inc.
5. KEY STRATEGIC QUESTIONS FOR MEAT SUBSTITUTES INDUSTRY CEOS
6. APPENDIX
6.1. Global Overview
6.1.1. Overview
6.1.2. Porter’s Five Forces Framework
6.1.3. Global Value Chain Analysis
6.1.4. Market Dynamics (DROs)
6.2. Sources & References
6.3. List of Tables & Figures
6.4. Primary Insights
6.5. Data Pack
6.6. Glossary of Terms
List of Tables & Figures
- Figure 1:
- UNITED STATES TOFU MARKET, TOFU, PRICE IN USD/METRIC TONNES, 2016 - 2022
- Figure 2:
- UNITED STATES TOFU MARKET, VOLUME, METRIC TONNES, 2016 - 2028
- Figure 3:
- UNITED STATES TOFU MARKET, VALUE, USD, 2016 - 2028
- Figure 4:
- UNITED STATES TOFU MARKET, VOLUME IN METRIC TONNES, BY DISTRIBUTION CHANNEL, 2016 - 2028
- Figure 5:
- UNITED STATES TOFU MARKET, VALUE IN USD, BY DISTRIBUTION CHANNEL, 2016 - 2028
- Figure 6:
- UNITED STATES TOFU MARKET, VOLUME SHARE (%), BY DISTRIBUTION CHANNEL, 2016 VS 2022 VS 2028
- Figure 7:
- UNITED STATES TOFU MARKET, VALUE SHARE (%), BY DISTRIBUTION CHANNEL, 2016 VS 2022 VS 2028
- Figure 8:
- UNITED STATES TOFU MARKET, VOLUME IN METRIC TONNES, BY OFF-TRADE, 2016 - 2028
- Figure 9:
- UNITED STATES TOFU MARKET, VALUE IN USD, BY OFF-TRADE, 2016 - 2028
- Figure 10:
- UNITED STATES TOFU MARKET, VOLUME SHARE (%), BY OFF-TRADE, 2016 VS 2022 VS 2028
- Figure 11:
- UNITED STATES TOFU MARKET, VALUE SHARE (%), BY OFF-TRADE, 2016 VS 2022 VS 2028
- Figure 12:
- UNITED STATES TOFU MARKET, VOLUME IN METRIC TONNES, CONVENIENCE STORES, 2016 - 2028
- Figure 13:
- UNITED STATES TOFU MARKET, VALUE IN USD, CONVENIENCE STORES, 2016 - 2028
- Figure 14:
- UNITED STATES TOFU MARKET, VOLUME IN METRIC TONNES, ONLINE CHANNEL, 2016 - 2028
- Figure 15:
- UNITED STATES TOFU MARKET, VALUE IN USD, ONLINE CHANNEL, 2016 - 2028
- Figure 16:
- UNITED STATES TOFU MARKET, VOLUME IN METRIC TONNES, SUPERMARKETS AND HYPERMARKETS, 2016 - 2028
- Figure 17:
- UNITED STATES TOFU MARKET, VALUE IN USD, SUPERMARKETS AND HYPERMARKETS, 2016 - 2028
- Figure 18:
- UNITED STATES TOFU MARKET, VOLUME IN METRIC TONNES, OTHERS, 2016 - 2028
- Figure 19:
- UNITED STATES TOFU MARKET, VALUE IN USD, OTHERS, 2016 - 2028
- Figure 20:
- UNITED STATES TOFU MARKET, VOLUME IN METRIC TONNES, ON-TRADE, 2016 - 2028
- Figure 21:
- UNITED STATES TOFU MARKET, VALUE IN USD, ON-TRADE, 2016 - 2028
- Figure 22:
- UNITED STATES TOFU MARKET, MOST ACTIVE COMPANIES, BY NUMBER OF STRATEGIC MOVES, 2017 - 2022
- Figure 23:
- UNITED STATES TOFU MARKET, TOTAL NUMBER OF STRATEGIC MOVES, 2017 - 2022
- Figure 24:
- UNITED STATES TOFU MARKET SHARE(%), BY KEY PLAYERS, 2021
US Tofu Industry Segmentation
Off-Trade, On-Trade are covered as segments by Distribution Channel.| Distribution Channel | ||||||
| ||||||
| On-Trade |
Market Definition
- Meat Substitutes - It is a food product made from vegetarian or vegan ingredients, eaten as a replacement for meat. Meat substitutes typically approximate qualities of specific types of meat, such as mouthfeel, flavor, appearance, or chemical characteristics.
- Tempeh - It is a high protein Asian food prepared by fermenting soybeans with a Rhizopus.
- Textured Vegetable Protein - Food items made from consumable protein sources like soybean, pea, wheat, hemp, etc., are known as textured vegetable proteins. Each unit will withstand hydration during cooking and other processes used in preparing the food for consumption because it has structural integrity and a distinguishable texture.
- Tofu - Tofu is a soft food product prepared by treating soybean milk with coagulants.
Research Methodology
Mordor Intelligence follows a four-step methodology in all our reports.
- Step-1: Identify Key Variables: In order to build a robust forecasting methodology, the variables and factors identified in Step 1 are tested against available historical market numbers. Through an iterative process, the variables required for market forecast are set, and the model is built on the basis of these variables.
- Step-2: Build a Market Model: Market-size estimations for the forecast years are in nominal terms. Inflation is not a part of the pricing, and the average selling price (ASP) is kept constant throughout the forecast period for each country.
- Step-3: Validate and Finalize: In this important step, all market numbers, variables, and analyst calls are validated through an extensive network of primary research experts from the market studied. The respondents are selected across levels and functions to generate a holistic picture of the market studied.
- Step-4: Research Outputs: Syndicated Reports, Custom Consulting Assignments, Databases & Subscription Platforms


