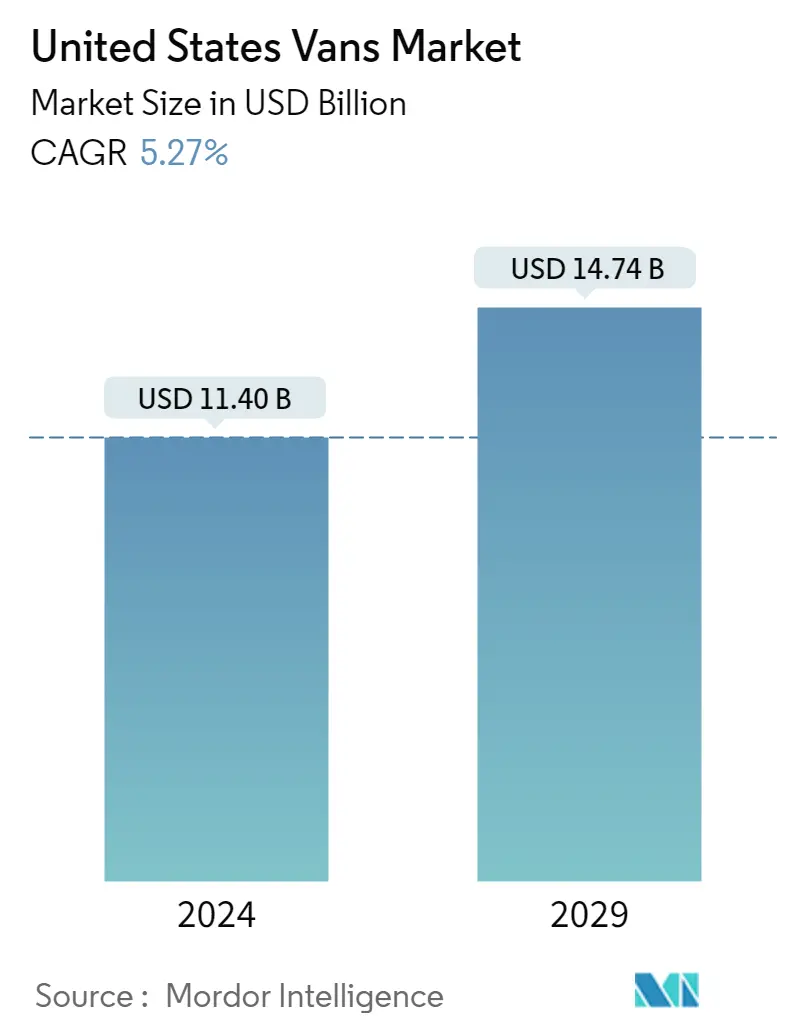
US Vans Market Size

| Icons | Lable | Value |
|---|---|---|
|
|
Study Period | 2016 - 2028 |
|
|
Base Year For Estimation | 2021 |
|
|
CAGR | 6.42 % |
|
|
Largest Share by Engine Type | ICE |
|
|
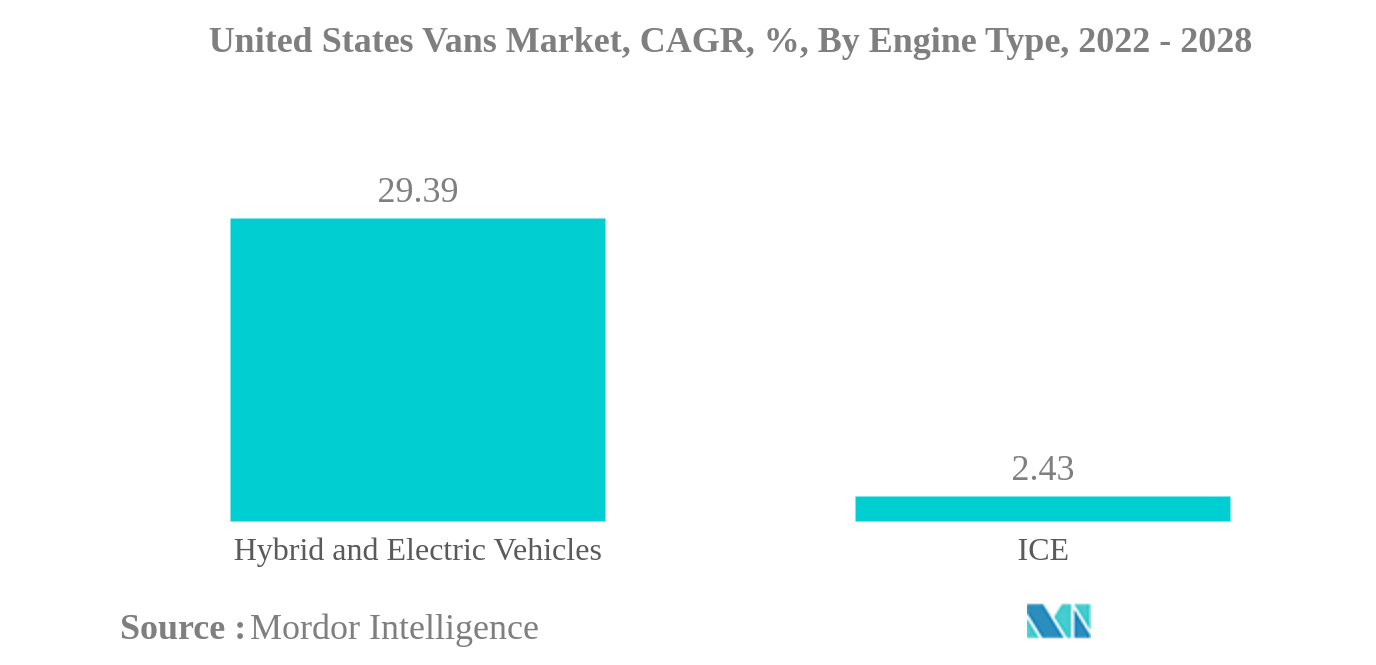
Fastest Growing by Engine Type | Hybrid and Electric Vehicles |
|
|
Market Concentration | High |
Major Players |
||
|
|
||
|
*Disclaimer: Major Players sorted in no particular order |
US Vans Market Analysis
The United States Vans Market is projected to register a CAGR of 6.42%
- Largest Segment by Fuel Type - Diesel : Traditional diesel engines cover the most sales of vans due to their reliability in commercial usage. Which makes diesel vans the largest fuel type in light commercial vehicle sales in the US.
- Fastest-growing Segment by Fuel Type - PHEV : With the increase in electric mobility, OEMs are manufacturing battery electric vans in the US market. The government-offered incentives are adding to the growth of pure electric vans in US.
US Vans Market Trends
This section covers the major market trends shaping the US Vans Market according to our research experts:
ICE is the largest segment by Engine Type.
- In 2021, the market for light commercial vans (LCVs) had the highest revenue share at 77.3%. LCVs are regarded as a financially advantageous solution for the transportation of both goods and people. LCVs reduce emissions and have several tax advantages. These vehicles are also quite active and adaptable for carrying both passengers and cargo. They are also economical, which is anticipated to favor the segment's expansion. Fleets that have already made significant commitments to electrification include Amazon (100,000 electric delivery vans ordered from Rivian), UPS (950 electric trucks ordered from Workhorse and 10,000 electric vans from Arrival), Pride Group (6,400 electric vehicles ordered from Workhorse, Tesla, and Lion), FedEx (500 electric delivery trucks ordered from Bright Drop).
- Governments are actively promoting the switch to electric vehicles among fleet operators. For instance, Washington approved ground-breaking legislation in May 2021, requiring all light-duty and passenger vehicles sold in the state be electric by 2030 or later. The new law, which puts Washington five years ahead of California's target date of 2035 for the transition to an all-electric future, is the most ambitious in the United States. In 15 additional states, as well as Washington, DC, all new trucks, vans, and buses must be electric by 2050.
- Due to rising emission norms and regulations, van manufacturers have started offering electric versions in their product lines. Daimler, Toyota, and others have begun plans to expand the van manufacturing segment in promising industrial zones to capitalize on the growing demand for vans. Several key players have also partnered with e-commerce and logistics companies to expand their fleet sizes.
US Vans Industry Overview
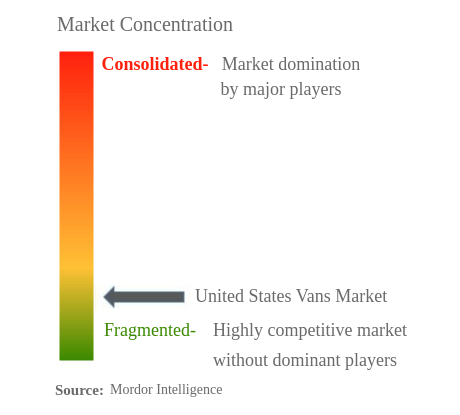
The United States Vans Market is fragmented, with the top five companies occupying 31.18%. The major players in this market are Chevrolet, Ford Motor Company, Mercedes-Benz Group, Nissan Motor Co., Ltd. and Toyota Motor Corporation (sorted alphabetically).
US Vans Market Leaders
Chevrolet
Ford Motor Company
Mercedes-Benz Group
Nissan Motor Co., Ltd.
Toyota Motor Corporation
*Disclaimer: Major Players sorted in no particular order
US Vans Market News
- March 2022: General Motors acquired SoftBank Vision Fund 1’s equity ownership stake in Cruise for US$2.1 billion.
- February 2022: Daimler AG merges with Mercedes Benz group.
- February 2022: E-Transit is Ford’s newest fully electric vehicle in the commercial vehicle segment for customers which will be available by spring.(Year)(
US Vans Market Report - Table of Contents
EXECUTIVE SUMMARY & KEY FINDINGS
REPORT OFFERS
1. INTRODUCTION
1.1. Study Assumptions & Market Definition
1.2. Scope of the Study
1.3. Research Methodology
2. KEY INDUSTRY TRENDS
2.1. Population
2.2. GDP
2.3. CVP
2.4. Inflation Rate
2.5. Interest Rate For Auto Loans
2.6. Battery Price (per Kwh)
2.7. Electrification Impact
2.8. New XEV Models Announced
2.9. Charging Stations Deployment
2.10. Regulatory Framework
2.11. Value Chain & Distribution Channel Analysis
3. MARKET SEGMENTATION
3.1. Engine Type
3.1.1. Hybrid And Electric Vehicles
3.1.1.1. By Fuel Type
3.1.1.1.1. BEV
3.1.1.1.2. FCEV
3.1.1.1.3. HEV
3.1.1.1.4. PHEV
3.1.2. ICE
3.1.2.1. By Fuel Type
3.1.2.1.1. CNG
3.1.2.1.2. Diesel
3.1.2.1.3. Gasoline
3.1.2.1.4. LPG
4. COMPETITIVE LANDSCAPE
4.1. Key Strategic Moves
4.2. Market Share Analysis
4.3. Company Landscape
4.4. Company Profiles
4.4.1. Chevrolet
4.4.2. FCA US LLC
4.4.3. Ford Motor Company
4.4.4. Hyundai Motor Company
4.4.5. Kia Corporation
4.4.6. Mercedes-Benz Group
4.4.7. Nissan Motor Co., Ltd.
4.4.8. Stellantis NV
4.4.9. Toyota Motor Corporation
5. KEY STRATEGIC QUESTIONS FOR VEHICLES CEOS
6. APPENDIX
6.1. Global Overview
6.1.1. Overview
6.1.2. Porter’s Five Forces Framework
6.1.3. Global Value Chain Analysis
6.1.4. Market Dynamics (DROs)
6.2. Sources & References
6.3. List of Tables & Figures
6.4. Primary Insights
6.5. Data Pack
6.6. Glossary of Terms
List of Tables & Figures
- Figure 1:
- UNITED STATES VANS MARKET, POPULATION YOY GROWTH RATE, MILLION UNITS, 2016 – 2026
- Figure 2:
- UNITED STATES VANS MARKET, GDP YOY GROWTH RATE, USD MILLION, 2016 – 2026
- Figure 3:
- UNITED STATES VANS MARKET, CVP YOY GROWTH RATE, 2016 – 2027
- Figure 4:
- UNITED STATES VANS MARKET, INFLATION RATE YOY GROWTH RATE, PERCENT, 2016 – 2026
- Figure 5:
- UNITED STATES VANS MARKET, INTEREST RATE FOR AUTO LOANS YOY GROWTH RATE, PERCENT, 2016 – 2026
- Figure 6:
- UNITED STATES VANS MARKET, BATTERY PRICES YOY GROWTH RATE, 2016 – 2026
- Figure 7:
- UNITED STATES VANS MARKET, ELECTRIFICATION IMPACT, VOLUME, YOY GROWTH RATE, PERCENT, 2016 – 2026
- Figure 8:
- UNITED STATES VANS MARKET, NEW XEV MODELS ANNOUNCED, VOLUME, YOY GROWTH RATE, UNITS, 2016 – 2026
- Figure 9:
- UNITED STATES VANS MARKET, CHARGING STATIONS DEPLOYMENT, VOLUME, YOY GROWTH RATE, UNITS, 2016 – 2026
- Figure 10:
- UNITED STATES VANS MARKET, VOLUME IN UNITS, 2016 – 2026
- Figure 11:
- UNITED STATES VANS MARKET, VALUE IN USD, 2016 – 2026
- Figure 12:
- UNITED STATES VANS MARKET, BY ENGINE TYPE, BY VOLUME IN UNITS, 2016-2028
- Figure 13:
- UNITED STATES VANS MARKET, BY ENGINE TYPE, BY VALUE IN USD, 2016-2028
- Figure 14:
- UNITED STATES VANS MARKET MARKET, SHARE(%), BY ENGINE TYPE, 2016 - 2016
- Figure 15:
- UNITED STATES VANS MARKET MARKET, SHARE(%), BY ENGINE TYPE, 2016 - 2016
- Figure 16:
- UNITED STATES VANS MARKET, BY FUEL TYPE, BY VOLUME IN UNITS, 2016-2028
- Figure 17:
- UNITED STATES VANS MARKET, BY FUEL TYPE, BY VALUE IN USD, 2016-2028
- Figure 18:
- UNITED STATES VANS MARKET MARKET, SHARE(%), BY FUEL TYPE, 2016 - 2016
- Figure 19:
- UNITED STATES VANS MARKET MARKET, SHARE(%), BY FUEL TYPE, 2016 - 2016
- Figure 20:
- UNITED STATES VANS MARKET, BY BEV, BY VOLUME IN UNITS, 2016-2028
- Figure 21:
- UNITED STATES VANS MARKET, BY BEV, BY VALUE IN USD, 2016-2028
- Figure 22:
- UNITED STATES VANS MARKET MARKET, SHARE(%), BY FUEL TYPE, 2021 - 2028
- Figure 23:
- UNITED STATES VANS MARKET, BY FCEV, BY VOLUME IN UNITS, 2016-2028
- Figure 24:
- UNITED STATES VANS MARKET, BY FCEV, BY VALUE IN USD, 2016-2028
- Figure 25:
- UNITED STATES VANS MARKET MARKET, SHARE(%), BY FUEL TYPE, 2021 - 2028
- Figure 26:
- UNITED STATES VANS MARKET, BY HEV, BY VOLUME IN UNITS, 2016-2028
- Figure 27:
- UNITED STATES VANS MARKET, BY HEV, BY VALUE IN USD, 2016-2028
- Figure 28:
- UNITED STATES VANS MARKET MARKET, SHARE(%), BY FUEL TYPE, 2021 - 2028
- Figure 29:
- UNITED STATES VANS MARKET, BY PHEV, BY VOLUME IN UNITS, 2016-2028
- Figure 30:
- UNITED STATES VANS MARKET, BY PHEV, BY VALUE IN USD, 2016-2028
- Figure 31:
- UNITED STATES VANS MARKET MARKET, SHARE(%), BY FUEL TYPE, 2021 - 2028
- Figure 32:
- UNITED STATES VANS MARKET, BY FUEL TYPE, BY VOLUME IN UNITS, 2016-2028
- Figure 33:
- UNITED STATES VANS MARKET, BY FUEL TYPE, BY VALUE IN USD, 2016-2028
- Figure 34:
- UNITED STATES VANS MARKET MARKET, SHARE(%), BY FUEL TYPE, 2016 - 2016
- Figure 35:
- UNITED STATES VANS MARKET MARKET, SHARE(%), BY FUEL TYPE, 2016 - 2016
- Figure 36:
- UNITED STATES VANS MARKET, BY CNG, BY VOLUME IN UNITS, 2016-2028
- Figure 37:
- UNITED STATES VANS MARKET, BY CNG, BY VALUE IN USD, 2016-2028
- Figure 38:
- UNITED STATES VANS MARKET MARKET, SHARE(%), BY FUEL TYPE, 2021 - 2028
- Figure 39:
- UNITED STATES VANS MARKET, BY DIESEL, BY VOLUME IN UNITS, 2016-2028
- Figure 40:
- UNITED STATES VANS MARKET, BY DIESEL, BY VALUE IN USD, 2016-2028
- Figure 41:
- UNITED STATES VANS MARKET MARKET, SHARE(%), BY FUEL TYPE, 2021 - 2028
- Figure 42:
- UNITED STATES VANS MARKET, BY GASOLINE, BY VOLUME IN UNITS, 2016-2028
- Figure 43:
- UNITED STATES VANS MARKET, BY GASOLINE, BY VALUE IN USD, 2016-2028
- Figure 44:
- UNITED STATES VANS MARKET MARKET, SHARE(%), BY FUEL TYPE, 2021 - 2028
- Figure 45:
- UNITED STATES VANS MARKET, BY LPG, BY VOLUME IN UNITS, 2016-2028
- Figure 46:
- UNITED STATES VANS MARKET, BY LPG, BY VALUE IN USD, 2016-2028
- Figure 47:
- UNITED STATES VANS MARKET MARKET, SHARE(%), BY FUEL TYPE, 2021 - 2028
- Figure 48:
- UNITED STATES VANS MARKET, MOST ACTIVE COMPANIES, BY NUMBER OF STRATEGIC MOVES, 2018 - 2021
- Figure 49:
- UNITED STATES VANS MARKET, MOST ADOPTED STRATEGIES, 2018 - 2021
- Figure 50:
- UNITED STATES VANS MARKET SHARE(%), BY MAJOR PLAYERS, 2021
US Vans Industry Segmentation
Hybrid And Electric Vehicles, ICE are covered as segments by Engine Type.| Engine Type | ||||||||
| ||||||||
|
Market Definition
- Body Type - Commercial vehicles that weigh less than 6,000 lb (Class 1) and in the range of 6,001–10,000 lb (Class 2) are covered under this category.
- Engine Type - This includes Hybrid and electric vehicles and Internal combustion engines (ICE).
- Fuel Type - Hybrid and electric vehicles include HEV, PHEV, BEV, and FCEV while ICE includes Gasoline, Diesel, CNG, LPG.
- Sub Body Type - Vans are part of a category known as ‘light commercial vehicles. They are classified as the N1 category. This category is further broken down into Class I, II and III vehicles, depending on vehicle weight. Mass given in tons (metric tons) is used as a limit between light commercial vehicles and heavy trucks. This limit depends on national and professional definitions and varies between 3.5 and 7 tons.
- Vehicle Type - Commercial vehicles are motorized road vehicles designed for transporting people or goods. The category includes Trucks.
Research Methodology
Mordor Intelligence follows a four-step methodology in all our reports.
- Step-1: Identify Key Variables: In order to build a robust forecasting methodology, the variables and factors identified in Step-1 are tested against available historical market numbers. Through an iterative process, the variables required for market forecast are set and the model is built on the basis of these variables.
- Step-2: Build a Market Model: Market-size estimations for the historical and forecast years have been provided in revenue and volume terms. For sales conversion to volume, the average selling price (ASP) is kept constant throughout the forecast period for each country, and inflation is not a part of the pricing.
- Step-3: Validate and Finalize: In this important step, all market numbers, variables and analyst calls are validated through an extensive network of primary research experts from the market studied. The respondents are selected across levels and functions to generate a holistic picture of the market studied.
- Step-4: Research Outputs: Syndicated Reports, Custom Consulting Assignments, Databases & Subscription Platforms


