United States Wheat Protein Market Size

| Icons | Lable | Value |
|---|---|---|
|
|
Study Period | 2017 - 2029 |
|
|
Base Year For Estimation | 2022 |
|
|
CAGR | 2.75 % |
|
|
Largest Share by End User | Food and Beverages |
|
|
Fastest Growing by End User | Animal Feed |
|
|
Market Concentration | High |
Major Players |
||
|
|
||
|
*Disclaimer: Major Players sorted in no particular order |
United States Wheat Protein Market Analysis
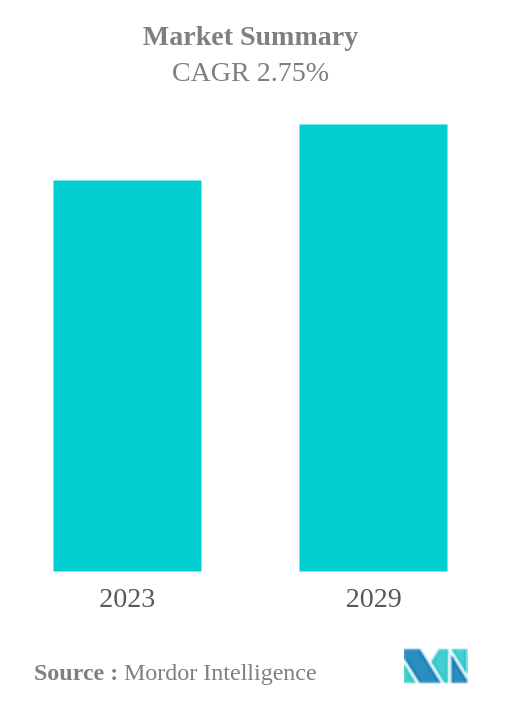
The United States Wheat Protein Market is projected to register a CAGR of 2.75%
- Concentrates is the Largest Form : Concentrates (especially wheat gluten) are leading the market. Their water absorption and structure building properties are making them preferable for various applications.
- Food and Beverages is the Largest End User : The F&B sector, closely followed by the animal feed sector, is a leading end-user segment, primarily due to the surging demand for protein-fortified bakery products.
- Textured/Hydrolyzed is the Fastest-growing Form : The continuously rising production of hydrolyzed wheat proteins with non-GMO, organic, and clean label claims for natural products is projected to drive the segment.
- Animal Feed is the Fastest-growing End User : Animal feed is projected to be the fastest-growing sector due to the growing application of wheat protein as a functional alternative to fish and animal-based feed.
United States Wheat Protein Market Trends
This section covers the major market trends shaping the United States Wheat Protein Market according to our research experts:
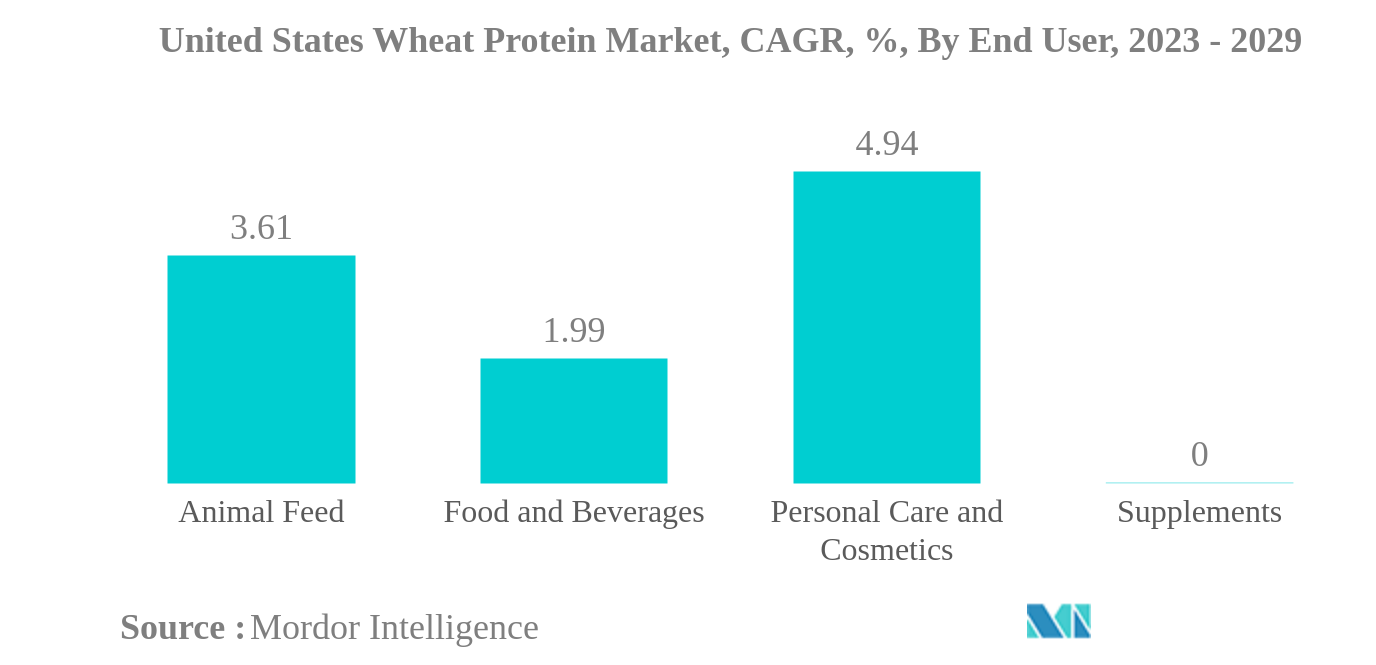
Food and Beverages is the largest End User
- The F&B sector witnessed the highest demand, followed by the animal feed sector in 2022. The growing demand for wheat protein in bakeries, breakfast cereals, and meat alternatives products is driving market growth. Thus, the F&B segment of the market is projected to register a CAGR of 1.99% from 2023-2029. Wheat protein is viewed as a more favorable source of plant-based protein by the vegetarian and vegan communities. A variety of traditional meat-based items are increasingly being replaced by substitutes made with wheat protein as part of the plant-based trend.
- The animal feed sector is projected to register the highest CAGR of 3.61% during the forecast period. The capabilities of vital wheat gluten, which work as an appropriate and highly functional alternative to fish- and animal-based feeds, have contributed to the enormous rise of the animal feed industry. In 2021, the 10% lower production of hard winter wheat in the US resulted in its higher price by the end of 2021, hindering its growth rate.
- The personal care and cosmetics segment is expected to grow the fastest, registering a CAGR of 4.97% during the forecast period. Currently, the utilization of wheat protein in cosmetics and skincare is very minimal. In recent years, hydrolysates have found their way into the sector as a natural ingredient in skincare and hair care products. Hydrolyzed wheat protein is known to increase the firmness of the skin and helps to form a film to retain moisture and provide luminosity. It also prevents the skin from drying out, diminishes the appearance of wrinkles, and nourishes and repairs hair. Only 0.01% of the hydrolysates used in the US go to the personal care sector, but this is anticipated to change in the coming years.
United States Wheat Protein Industry Overview
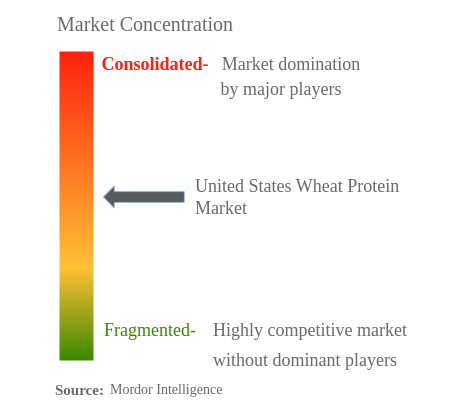
The United States Wheat Protein Market is moderately consolidated, with the top five companies occupying 55.46%. The major players in this market are Archer Daniels Midland Company, Kerry Group PLC, MGP Ingredients Inc., Südzucker Group and The Scoular Company (sorted alphabetically).
United States Wheat Protein Market Leaders
Archer Daniels Midland Company
Kerry Group PLC
MGP Ingredients Inc.
Südzucker Group
The Scoular Company
*Disclaimer: Major Players sorted in no particular order
United States Wheat Protein Market News
- May 2022: BENEO, a subsidiary of Südzucker, has entered into a purchase agreement to acquire 100% of Meatless BV, a producer of functional ingredients. BENEO is expanding its existing product offering with the acquisition to offer an even broader range of texturizing solutions for meat and fish alternatives.
- February 2022: MGP Ingredients has announced the construction of a new extrusion plant in Kansas to manufacture its ProTerra line of texturized proteins. The USD 16.7 million facility will be located next to the company's Atchison site and will initially produce up to 10 million pounds of ProTerra per year. The new plant will assist MGP in meeting the rising demand for its ProTerra product line, which comprises pea and wheat protein ingredients used in applications such as plant-based meat substitutes.
- September 2020: ADM launched a range of textured wheat proteins that includes Prolite® MeatTEX textured wheat protein and Prolite® MeatXT non-textured wheat protein. These highly-functional protein solutions improve the texture and density of meat alternatives.
United States Wheat Protein Market Report - Table of Contents
EXECUTIVE SUMMARY & KEY FINDINGS
1. INTRODUCTION
1.1. Study Assumptions & Market Definition
1.2. Scope of the Study
1.3. Research Methodology
2. KEY INDUSTRY TRENDS
2.1. End User Market Volume
2.2. Protein Consumption Trends
2.3. Production Trends
2.4. Regulatory Framework
2.5. Value Chain & Distribution Channel Analysis
3. MARKET SEGMENTATION
3.1. Form
3.1.1. Concentrates
3.1.2. Isolates
3.1.3. Textured/Hydrolyzed
3.2. End User
3.2.1. Animal Feed
3.2.2. Food And Beverages
3.2.2.1. By Sub End User
3.2.2.1.1. Bakery
3.2.2.1.2. Breakfast Cereals
3.2.2.1.3. Condiments/Sauces
3.2.2.1.4. Meat/Poultry/Seafood And Meat Alternative Products
3.2.2.1.5. RTE/RTC Food Products
3.2.2.1.6. Snacks
4. COMPETITIVE LANDSCAPE
4.1. Key Strategic Moves
4.2. Market Share Analysis
4.3. Company Landscape
4.4. Company Profiles
4.4.1. A. Costantino & C. SpA
4.4.2. AMCO Proteins
4.4.3. Archer Daniels Midland Company
4.4.4. Kerry Group PLC
4.4.5. MGP Ingredients Inc.
4.4.6. Roquette Frères
4.4.7. Südzucker Group
4.4.8. The Scoular Company
5. KEY STRATEGIC QUESTIONS FOR PROTEIN INGREDIENTS INDUSTRY CEOS
6. APPENDIX
6.1. Global Overview
6.1.1. Overview
6.1.2. Porter’s Five Forces Framework
6.1.3. Global Value Chain Analysis
6.1.4. Market Dynamics (DROs)
6.2. Sources & References
6.3. List of Tables & Figures
6.4. Primary Insights
6.5. Data Pack
6.6. Glossary of Terms
List of Tables & Figures
- Figure 1:
- UNITED STATES BABY FOOD AND INFANT FORMULA MARKET, VOLUME IN METRIC TONNES, 2017 - 2029
- Figure 2:
- UNITED STATES BAKERY MARKET, VOLUME IN METRIC TONNES, 2017 - 2029
- Figure 3:
- UNITED STATES BEVERAGES MARKET, VOLUME IN METRIC TONNES, 2017 - 2029
- Figure 4:
- UNITED STATES BREAKFAST CEREALS MARKET, VOLUME IN METRIC TONNES, 2017 - 2029
- Figure 5:
- UNITED STATES CONDIMENTS/SAUCES MARKET, VOLUME IN METRIC TONNES, 2017 - 2029
- Figure 6:
- UNITED STATES CONFECTIONERY MARKET, VOLUME IN METRIC TONNES, 2017 - 2029
- Figure 7:
- UNITED STATES DAIRY AND DAIRY ALTERNATIVE PRODUCTS MARKET, VOLUME IN METRIC TONNES, 2017 - 2029
- Figure 8:
- UNITED STATES ELDERLY NUTRITION AND MEDICAL NUTRITION MARKET, VOLUME IN METRIC TONNES, 2017 - 2029
- Figure 9:
- UNITED STATES MEAT/POULTRY/SEAFOOD AND MEAT ALTERNATIVE PRODUCTS MARKET, VOLUME IN METRIC TONNES, 2017 - 2029
- Figure 10:
- UNITED STATES RTE/RTC FOOD PRODUCTS MARKET, VOLUME IN METRIC TONNES, 2017 - 2029
- Figure 11:
- UNITED STATES SNACKS MARKET, VOLUME IN METRIC TONNES, 2017 - 2029
- Figure 12:
- UNITED STATES SPORT/PERFORMANCE NUTRITION MARKET, VOLUME IN METRIC TONNES, 2017 - 2029
- Figure 13:
- UNITED STATES ANIMAL FEED MARKET, VOLUME IN METRIC TONNES, 2017 - 2029
- Figure 14:
- UNITED STATES PERSONAL CARE AND COSMETICS MARKET, VOLUME IN METRIC TONNES, 2017 - 2029
- Figure 15:
- UNITED STATES PER CAPITA CONSUMPTION OF PLANT PROTEIN, IN GRAM, 2017 - 2029
- Figure 16:
- UNITED STATES WHEAT PRODUCTION, IN METRIC TONNES, 2017 - 2021
- Figure 17:
- UNITED STATES WHEAT PROTEIN MARKET, 2015-2026
- Figure 18:
- UNITED STATES WHEAT PROTEIN MARKET, 2015-2026
- Figure 19:
- UNITED STATES WHEAT PROTEIN MARKET, VOLUME IN METRIC TONNES, BY FORM, 2017 - 2029
- Figure 20:
- UNITED STATES WHEAT PROTEIN MARKET, VALUE IN USD, BY FORM, 2017 - 2029
- Figure 21:
- UNITED STATES WHEAT PROTEIN MARKET, VALUE SHARE (%), BY FORM, 2017 VS 2023 VS 2029
- Figure 22:
- UNITED STATES WHEAT PROTEIN MARKET, VOLUME SHARE (%), BY FORM, 2017 VS 2023 VS 2029
- Figure 23:
- UNITED STATES WHEAT PROTEIN MARKET, VOLUME IN METRIC TONNES, CONCENTRATES, 2017 - 2029
- Figure 24:
- UNITED STATES WHEAT PROTEIN MARKET, VALUE IN USD, CONCENTRATES, 2017 - 2029
- Figure 25:
- UNITED STATES WHEAT PROTEIN MARKET, CONCENTRATES, VALUE SHARE (%), BY END USER, 2022 VS 2029
- Figure 26:
- UNITED STATES WHEAT PROTEIN MARKET, VOLUME IN METRIC TONNES, ISOLATES, 2017 - 2029
- Figure 27:
- UNITED STATES WHEAT PROTEIN MARKET, VALUE IN USD, ISOLATES, 2017 - 2029
- Figure 28:
- UNITED STATES WHEAT PROTEIN MARKET, ISOLATES, VALUE SHARE (%), BY END USER, 2022 VS 2029
- Figure 29:
- UNITED STATES WHEAT PROTEIN MARKET, VOLUME IN METRIC TONNES, TEXTURED/HYDROLYZED, 2017 - 2029
- Figure 30:
- UNITED STATES WHEAT PROTEIN MARKET, VALUE IN USD, TEXTURED/HYDROLYZED, 2017 - 2029
- Figure 31:
- UNITED STATES WHEAT PROTEIN MARKET, TEXTURED/HYDROLYZED, VALUE SHARE (%), BY END USER, 2022 VS 2029
- Figure 32:
- UNITED STATES WHEAT PROTEIN MARKET, VOLUME IN METRIC TONNES, BY END USER, 2017 - 2029
- Figure 33:
- UNITED STATES WHEAT PROTEIN MARKET, VALUE IN USD, BY END USER, 2017 - 2029
- Figure 34:
- UNITED STATES WHEAT PROTEIN MARKET, VALUE SHARE (%), BY END USER, 2017 VS 2023 VS 2029
- Figure 35:
- UNITED STATES WHEAT PROTEIN MARKET, VOLUME SHARE (%), BY END USER, 2017 VS 2023 VS 2029
- Figure 36:
- UNITED STATES WHEAT PROTEIN MARKET, VOLUME IN METRIC TONNES, ANIMAL FEED, 2017 - 2029
- Figure 37:
- UNITED STATES WHEAT PROTEIN MARKET, VALUE IN USD, ANIMAL FEED, 2017 - 2029
- Figure 38:
- UNITED STATES WHEAT PROTEIN MARKET, ANIMAL FEED, VALUE SHARE (%), BY FORM, 2022 VS 2029
- Figure 39:
- UNITED STATES WHEAT PROTEIN MARKET, VOLUME IN METRIC TONNES, BY SUB END USER, 2017 - 2029
- Figure 40:
- UNITED STATES WHEAT PROTEIN MARKET, VALUE IN USD, BY SUB END USER, 2017 - 2029
- Figure 41:
- UNITED STATES WHEAT PROTEIN MARKET, VALUE SHARE (%), BY SUB END USER, 2017 VS 2023 VS 2029
- Figure 42:
- UNITED STATES WHEAT PROTEIN MARKET, VOLUME SHARE (%), BY SUB END USER, 2017 VS 2023 VS 2029
- Figure 43:
- UNITED STATES WHEAT PROTEIN MARKET, VOLUME IN METRIC TONNES, BAKERY, 2017 - 2029
- Figure 44:
- UNITED STATES WHEAT PROTEIN MARKET, VALUE IN USD, BAKERY, 2017 - 2029
- Figure 45:
- UNITED STATES WHEAT PROTEIN MARKET, BAKERY, VALUE SHARE (%), BY FORM, 2022 VS 2029
- Figure 46:
- UNITED STATES WHEAT PROTEIN MARKET, VOLUME IN METRIC TONNES, BREAKFAST CEREALS, 2017 - 2029
- Figure 47:
- UNITED STATES WHEAT PROTEIN MARKET, VALUE IN USD, BREAKFAST CEREALS, 2017 - 2029
- Figure 48:
- UNITED STATES WHEAT PROTEIN MARKET, BREAKFAST CEREALS, VALUE SHARE (%), BY FORM, 2022 VS 2029
- Figure 49:
- UNITED STATES WHEAT PROTEIN MARKET, VOLUME IN METRIC TONNES, CONDIMENTS/SAUCES, 2017 - 2029
- Figure 50:
- UNITED STATES WHEAT PROTEIN MARKET, VALUE IN USD, CONDIMENTS/SAUCES, 2017 - 2029
- Figure 51:
- UNITED STATES WHEAT PROTEIN MARKET, CONDIMENTS/SAUCES, VALUE SHARE (%), BY FORM, 2022 VS 2029
- Figure 52:
- UNITED STATES WHEAT PROTEIN MARKET, VOLUME IN METRIC TONNES, MEAT/POULTRY/SEAFOOD AND MEAT ALTERNATIVE PRODUCTS, 2017 - 2029
- Figure 53:
- UNITED STATES WHEAT PROTEIN MARKET, VALUE IN USD, MEAT/POULTRY/SEAFOOD AND MEAT ALTERNATIVE PRODUCTS, 2017 - 2029
- Figure 54:
- UNITED STATES WHEAT PROTEIN MARKET, MEAT/POULTRY/SEAFOOD AND MEAT ALTERNATIVE PRODUCTS, VALUE SHARE (%), BY FORM, 2022 VS 2029
- Figure 55:
- UNITED STATES WHEAT PROTEIN MARKET, VOLUME IN METRIC TONNES, RTE/RTC FOOD PRODUCTS, 2017 - 2029
- Figure 56:
- UNITED STATES WHEAT PROTEIN MARKET, VALUE IN USD, RTE/RTC FOOD PRODUCTS, 2017 - 2029
- Figure 57:
- UNITED STATES WHEAT PROTEIN MARKET, RTE/RTC FOOD PRODUCTS, VALUE SHARE (%), BY FORM, 2022 VS 2029
- Figure 58:
- UNITED STATES WHEAT PROTEIN MARKET, VOLUME IN METRIC TONNES, SNACKS, 2017 - 2029
- Figure 59:
- UNITED STATES WHEAT PROTEIN MARKET, VALUE IN USD, SNACKS, 2017 - 2029
- Figure 60:
- UNITED STATES WHEAT PROTEIN MARKET, SNACKS, VALUE SHARE (%), BY FORM, 2022 VS 2029
- Figure 61:
- UNITED STATES WHEAT PROTEIN MARKET, MOST ACTIVE COMPANIES, BY NUMBER OF STRATEGIC MOVES, 2017 - 2022
- Figure 62:
- UNITED STATES WHEAT PROTEIN MARKET, TOTAL NUMBER OF STRATEGIC MOVES, 2017 - 2022
- Figure 63:
- UNITED STATES WHEAT PROTEIN MARKET SHARE(%), BY KEY PLAYERS, 2021
United States Wheat Protein Industry Segmentation
Concentrates, Isolates, Textured/Hydrolyzed are covered as segments by Form. Animal Feed, Food And Beverages are covered as segments by End User.| Form | |
| Concentrates | |
| Isolates | |
| Textured/Hydrolyzed |
| End User | ||||||||||
| Animal Feed | ||||||||||
|
Market Definition
- End User - The Protein Ingredients Market operates on a B2B basis. Food, Beverages, Supplements, Animal Feed, and Personal Care & Cosmetic manufacturers are considered to be end-consumers in the market studied. The scope excludes manufacturers buying liquid/dry whey to be used for application as a binding agent or thickener or other non-protein applications.
- Penetration Rate - Penetration Rate is defined as the percentage of Protein-Fortified End User Market Volume in the Overall End User Market Volume.
- Average Protein Content - It is the average protein content present in per 100 g of product manufactured by all end-user companies considered under the scope of this report.
Research Methodology
Mordor Intelligence follows a four-step methodology in all our reports.
- Step-1: Identify Key Variables: The quantifiable key variables (industry and extraneous) pertaining to the specific product segment and country are selected from a group of relevant variables & factors based on desk research & literature review; along with primary expert inputs. These variables are further confirmed through regression modeling (wherever required).
- Step-2: Build a Market Model: In order to build a robust forecasting methodology, the variables and factors identified in Step-1 are tested against available historical market numbers. Through an iterative process, the variables required for market forecast are set and the model is built on the basis of these variables.
- Step-3: Validate and Finalize: In this important step, all market numbers, variables and analyst calls are validated through an extensive network of primary research experts from the market studied. The respondents are selected across levels and functions to generate a holistic picture of the market studied.
- Step-4: Research Outputs: Syndicated Reports, Custom Consulting Assignments, Databases & Subscription Platforms


