US Whey Protein Ingredients Market Size

| Icons | Lable | Value |
|---|---|---|
|
|
Study Period | 2017 - 2029 |
|
|
Base Year For Estimation | 2022 |
|
|
CAGR | 4.54 % |
|
|
Largest Share by End User | Food and Beverages |
|
|
Fastest Growing by End User | Supplements |
|
|
Market Concentration | High |
Major Players |
||
|
|
||
|
*Disclaimer: Major Players sorted in no particular order |
US Whey Protein Ingredients Market Analysis
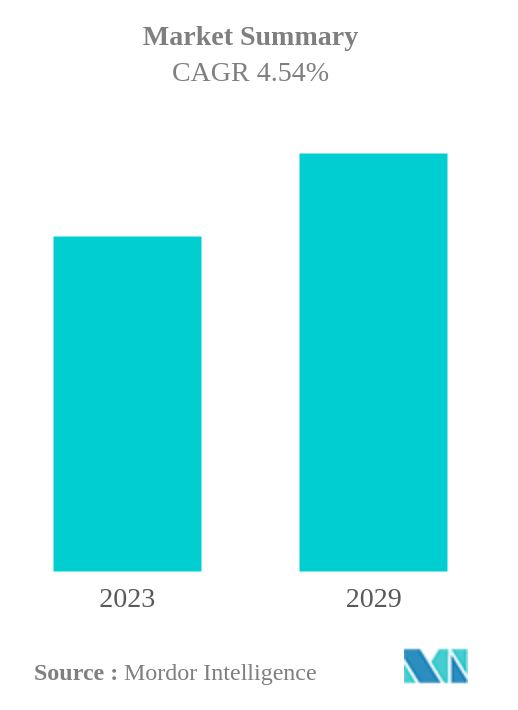
The United States Whey Protein Ingredients Market is projected to register a CAGR of 4.54%
- Concentrates is the Largest Form : Whey protein concentrates make up the majority and is increasingly used for fortification due to their high protein content, low production cost, and high bioavailability.
- Food and Beverages is the Largest End User : F&B held the largest share, owing to consumers' pivoting interest from carbonated beverages toward healthier drinks and protein-based snacks, thus, majorly driving the market.
- Hydrolyzed is the Fastest-growing Form : The hydrolyzed form of the ingredient has a wide range of uses because of its high protein content and low allergenicity expanding its production and investment potential.
- Supplements is the Fastest-growing End User : Whey protein supplements are the top choice for fitness enthusiasts, who are becoming more and more dependent on high-protein diets, further supporting its top ranking.
US Whey Protein Ingredients Market Trends
This section covers the major market trends shaping the United States Whey Protein Ingredients Market according to our research experts:
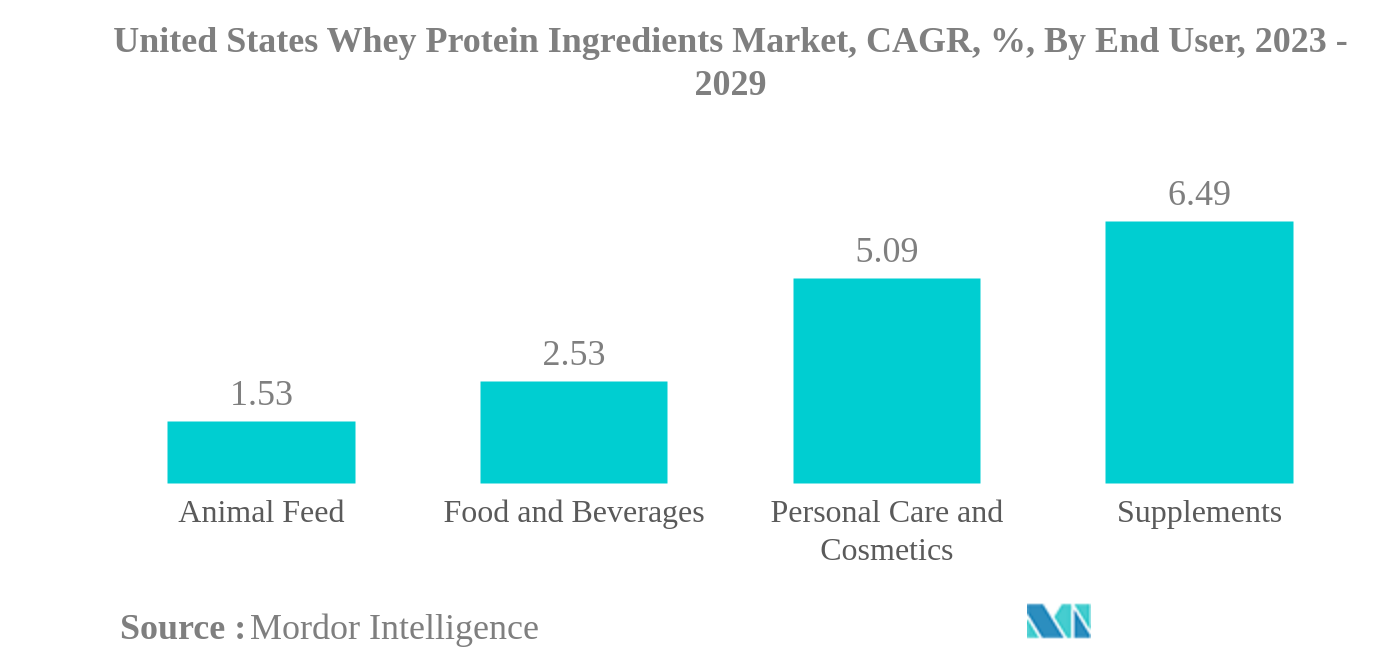
Food and Beverages is the largest End User
- The whey protein market comprises food and beverage and supplements as the two major applications. In 2019, the consumption volume of supplements surpassed the consumption volume of food and beverage to claim the top position among all end-user applications. This growth can be attributed to the rising number of muscle and fitness enthusiasts. This situation is increasing consumers' demand for whey protein-based sports beverages, specialized nutritional products, and other products designed to optimize athletic performance. From 2016 to 2019, the total number of memberships at fitness centers across the United States witnessed a growth of 12.04%, reaching 64.2 million memberships in 2019. However, the food and beverage industry in the United States grew by 10.57% in 2019.
- The supplements segment is likely to outpace other applications in terms of growth rate, recording a projected CAGR of 6.51% during the forecast period. The surging sports and performance nutrition industry is projected to register the fastest CAGR of 6.70%. This situation is further anticipated to drive the sales of whey protein in the supplements industry across the country.
- The other fastest-growing end-user segment for whey protein is personal care and cosmetics, which is projected to register a CAGR of 5.13% during the forecast period. Whey protein is used in anti-aging products, hair-care products, and nail-care products, among other things. The increasing number of beauty clinics, increasing per capita expenditure on personal appearance, a robust regulatory framework, and the growing beauty and cosmetics industry may boost overall demand in the future. Between 2016 and 2021, the average annual expenditure on beauty and personal care products rose by 7.04% across the United States.
US Whey Protein Ingredients Industry Overview
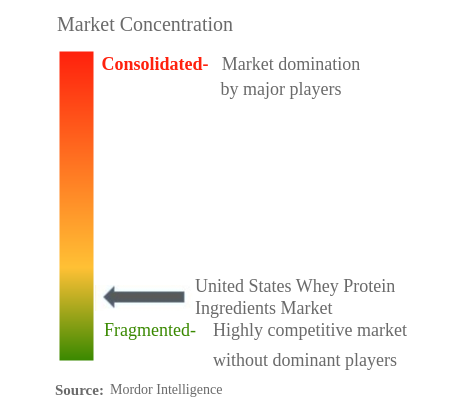
The United States Whey Protein Ingredients Market is fragmented, with the top five companies occupying 24.57%. The major players in this market are Agropur Dairy Cooperative, Arla Foods amba, Fonterra Co-operative Group Limited, Glanbia PLC and Koninklijke FrieslandCampina NV (sorted alphabetically).
US Whey Protein Ingredients Market Leaders
Agropur Dairy Cooperative
Arla Foods amba
Fonterra Co-operative Group Limited
Glanbia PLC
Koninklijke FrieslandCampina NV
*Disclaimer: Major Players sorted in no particular order
US Whey Protein Ingredients Market News
- August 2022: Optimum Nutrition announced the launch of its new Gold Standard Protein Shake. The RTD is available in chocolate and vanilla flavors and is formulated with 24 grams of protein per serving.
- June 2022: Fonterra JV entered a joint venture with Tillamook County Creamery Association (TCCA) and a three-mile canyon farm in the United States to launch Pro-Optima TM, a grade A functional whey protein concentrate (fWPC).
- November 2021: At the Food ingredient Europe 2021, FrieslandCampina Ingredients exhibited 45D, its fortified protein water concept containing Nutri Whey Isolate Clear, in the New Product Zone.
US Whey Protein Ingredients Market Report - Table of Contents
EXECUTIVE SUMMARY & KEY FINDINGS
1. INTRODUCTION
1.1. Study Assumptions & Market Definition
1.2. Scope of the Study
1.3. Research Methodology
2. KEY INDUSTRY TRENDS
2.1. End User Market Volume
2.2. Protein Consumption Trends
2.3. Production Trends
2.4. Regulatory Framework
2.5. Value Chain & Distribution Channel Analysis
3. MARKET SEGMENTATION
3.1. Form
3.1.1. Concentrates
3.1.2. Hydrolyzed
3.1.3. Isolates
3.2. End User
3.2.1. Animal Feed
3.2.2. Food And Beverages
3.2.2.1. By Sub End User
3.2.2.1.1. Bakery
3.2.2.1.2. Beverages
3.2.2.1.3. Breakfast Cereals
3.2.2.1.4. Condiments/Sauces
3.2.2.1.5. Dairy And Dairy Alternative Products
3.2.2.1.6. RTE/RTC Food Products
3.2.2.1.7. Snacks
3.2.3. Personal Care And Cosmetics
3.2.4. Supplements
3.2.4.1. By Sub End User
3.2.4.1.1. Baby Food And Infant Formula
3.2.4.1.2. Elderly Nutrition And Medical Nutrition
3.2.4.1.3. Sport/Performance Nutrition
4. COMPETITIVE LANDSCAPE
4.1. Key Strategic Moves
4.2. Market Share Analysis
4.3. Company Landscape
4.4. Company Profiles
4.4.1. Agropur Dairy Cooperative
4.4.2. Arla Foods amba
4.4.3. Carbery Food Ingredients Limited
4.4.4. Dairy Farmers of America
4.4.5. Fonterra Co-operative Group Limited
4.4.6. Glanbia PLC
4.4.7. Grande Cheese Company
4.4.8. Groupe Lactalis
4.4.9. Hilmar Cheese Company Inc.
4.4.10. Hoogwegt Group
4.4.11. Koninklijke FrieslandCampina NV
4.4.12. MEGGLE GmbH & Co.KG
4.4.13. Morinaga Milk Industry Co. Ltd
4.4.14. Talley's Group Limited
4.4.15. Tatua Co-operative Dairy Company Ltd
5. KEY STRATEGIC QUESTIONS FOR PROTEIN INGREDIENTS INDUSTRY CEOS
6. APPENDIX
6.1. Global Overview
6.1.1. Overview
6.1.2. Porter’s Five Forces Framework
6.1.3. Global Value Chain Analysis
6.1.4. Market Dynamics (DROs)
6.2. Sources & References
6.3. List of Tables & Figures
6.4. Primary Insights
6.5. Data Pack
6.6. Glossary of Terms
List of Tables & Figures
- Figure 1:
- UNITED STATES BABY FOOD AND INFANT FORMULA MARKET, VOLUME IN METRIC TONNES, 2017 - 2029
- Figure 2:
- UNITED STATES BAKERY MARKET, VOLUME IN METRIC TONNES, 2017 - 2029
- Figure 3:
- UNITED STATES BEVERAGES MARKET, VOLUME IN METRIC TONNES, 2017 - 2029
- Figure 4:
- UNITED STATES BREAKFAST CEREALS MARKET, VOLUME IN METRIC TONNES, 2017 - 2029
- Figure 5:
- UNITED STATES CONDIMENTS/SAUCES MARKET, VOLUME IN METRIC TONNES, 2017 - 2029
- Figure 6:
- UNITED STATES CONFECTIONERY MARKET, VOLUME IN METRIC TONNES, 2017 - 2029
- Figure 7:
- UNITED STATES DAIRY AND DAIRY ALTERNATIVE PRODUCTS MARKET, VOLUME IN METRIC TONNES, 2017 - 2029
- Figure 8:
- UNITED STATES ELDERLY NUTRITION AND MEDICAL NUTRITION MARKET, VOLUME IN METRIC TONNES, 2017 - 2029
- Figure 9:
- UNITED STATES MEAT/POULTRY/SEAFOOD AND MEAT ALTERNATIVE PRODUCTS MARKET, VOLUME IN METRIC TONNES, 2017 - 2029
- Figure 10:
- UNITED STATES RTE/RTC FOOD PRODUCTS MARKET, VOLUME IN METRIC TONNES, 2017 - 2029
- Figure 11:
- UNITED STATES SNACKS MARKET, VOLUME IN METRIC TONNES, 2017 - 2029
- Figure 12:
- UNITED STATES SPORT/PERFORMANCE NUTRITION MARKET, VOLUME IN METRIC TONNES, 2017 - 2029
- Figure 13:
- UNITED STATES ANIMAL FEED MARKET, VOLUME IN METRIC TONNES, 2017 - 2029
- Figure 14:
- UNITED STATES PERSONAL CARE AND COSMETICS MARKET, VOLUME IN METRIC TONNES, 2017 - 2029
- Figure 15:
- UNITED STATES PER CAPITA CONSUMPTION OF ANIMAL PROTEIN, IN GRAM, 2017 - 2029
- Figure 16:
- UNITED STATES DRY WHEY PRODUCTION, IN METRIC TONNES, 2017 - 2021
- Figure 17:
- UNITED STATES WHEY PROTEIN INGREDIENTS MARKET, 2015-2026
- Figure 18:
- UNITED STATES WHEY PROTEIN INGREDIENTS MARKET, 2015-2026
- Figure 19:
- UNITED STATES WHEY PROTEIN INGREDIENTS MARKET, VOLUME IN METRIC TONNES, BY FORM, 2017 - 2029
- Figure 20:
- UNITED STATES WHEY PROTEIN INGREDIENTS MARKET, VALUE IN USD, BY FORM, 2017 - 2029
- Figure 21:
- UNITED STATES WHEY PROTEIN INGREDIENTS MARKET, VALUE SHARE (%), BY FORM, 2017 VS 2023 VS 2029
- Figure 22:
- UNITED STATES WHEY PROTEIN INGREDIENTS MARKET, VOLUME SHARE (%), BY FORM, 2017 VS 2023 VS 2029
- Figure 23:
- UNITED STATES WHEY PROTEIN INGREDIENTS MARKET, VOLUME IN METRIC TONNES, CONCENTRATES, 2017 - 2029
- Figure 24:
- UNITED STATES WHEY PROTEIN INGREDIENTS MARKET, VALUE IN USD, CONCENTRATES, 2017 - 2029
- Figure 25:
- UNITED STATES WHEY PROTEIN INGREDIENTS MARKET, CONCENTRATES, VALUE SHARE (%), BY END USER, 2022 VS 2029
- Figure 26:
- UNITED STATES WHEY PROTEIN INGREDIENTS MARKET, VOLUME IN METRIC TONNES, HYDROLYZED, 2017 - 2029
- Figure 27:
- UNITED STATES WHEY PROTEIN INGREDIENTS MARKET, VALUE IN USD, HYDROLYZED, 2017 - 2029
- Figure 28:
- UNITED STATES WHEY PROTEIN INGREDIENTS MARKET, HYDROLYZED, VALUE SHARE (%), BY END USER, 2022 VS 2029
- Figure 29:
- UNITED STATES WHEY PROTEIN INGREDIENTS MARKET, VOLUME IN METRIC TONNES, ISOLATES, 2017 - 2029
- Figure 30:
- UNITED STATES WHEY PROTEIN INGREDIENTS MARKET, VALUE IN USD, ISOLATES, 2017 - 2029
- Figure 31:
- UNITED STATES WHEY PROTEIN INGREDIENTS MARKET, ISOLATES, VALUE SHARE (%), BY END USER, 2022 VS 2029
- Figure 32:
- UNITED STATES WHEY PROTEIN INGREDIENTS MARKET, VOLUME IN METRIC TONNES, BY END USER, 2017 - 2029
- Figure 33:
- UNITED STATES WHEY PROTEIN INGREDIENTS MARKET, VALUE IN USD, BY END USER, 2017 - 2029
- Figure 34:
- UNITED STATES WHEY PROTEIN INGREDIENTS MARKET, VALUE SHARE (%), BY END USER, 2017 VS 2023 VS 2029
- Figure 35:
- UNITED STATES WHEY PROTEIN INGREDIENTS MARKET, VOLUME SHARE (%), BY END USER, 2017 VS 2023 VS 2029
- Figure 36:
- UNITED STATES WHEY PROTEIN INGREDIENTS MARKET, VOLUME IN METRIC TONNES, ANIMAL FEED, 2017 - 2029
- Figure 37:
- UNITED STATES WHEY PROTEIN INGREDIENTS MARKET, VALUE IN USD, ANIMAL FEED, 2017 - 2029
- Figure 38:
- UNITED STATES WHEY PROTEIN INGREDIENTS MARKET, ANIMAL FEED, VALUE SHARE (%), BY FORM, 2022 VS 2029
- Figure 39:
- UNITED STATES WHEY PROTEIN INGREDIENTS MARKET, VOLUME IN METRIC TONNES, BY SUB END USER, 2017 - 2029
- Figure 40:
- UNITED STATES WHEY PROTEIN INGREDIENTS MARKET, VALUE IN USD, BY SUB END USER, 2017 - 2029
- Figure 41:
- UNITED STATES WHEY PROTEIN INGREDIENTS MARKET, VALUE SHARE (%), BY SUB END USER, 2017 VS 2023 VS 2029
- Figure 42:
- UNITED STATES WHEY PROTEIN INGREDIENTS MARKET, VOLUME SHARE (%), BY SUB END USER, 2017 VS 2023 VS 2029
- Figure 43:
- UNITED STATES WHEY PROTEIN INGREDIENTS MARKET, VOLUME IN METRIC TONNES, BAKERY, 2017 - 2029
- Figure 44:
- UNITED STATES WHEY PROTEIN INGREDIENTS MARKET, VALUE IN USD, BAKERY, 2017 - 2029
- Figure 45:
- UNITED STATES WHEY PROTEIN INGREDIENTS MARKET, BAKERY, VALUE SHARE (%), BY FORM, 2022 VS 2029
- Figure 46:
- UNITED STATES WHEY PROTEIN INGREDIENTS MARKET, VOLUME IN METRIC TONNES, BEVERAGES, 2017 - 2029
- Figure 47:
- UNITED STATES WHEY PROTEIN INGREDIENTS MARKET, VALUE IN USD, BEVERAGES, 2017 - 2029
- Figure 48:
- UNITED STATES WHEY PROTEIN INGREDIENTS MARKET, BEVERAGES, VALUE SHARE (%), BY FORM, 2022 VS 2029
- Figure 49:
- UNITED STATES WHEY PROTEIN INGREDIENTS MARKET, VOLUME IN METRIC TONNES, BREAKFAST CEREALS, 2017 - 2029
- Figure 50:
- UNITED STATES WHEY PROTEIN INGREDIENTS MARKET, VALUE IN USD, BREAKFAST CEREALS, 2017 - 2029
- Figure 51:
- UNITED STATES WHEY PROTEIN INGREDIENTS MARKET, BREAKFAST CEREALS, VALUE SHARE (%), BY FORM, 2022 VS 2029
- Figure 52:
- UNITED STATES WHEY PROTEIN INGREDIENTS MARKET, VOLUME IN METRIC TONNES, CONDIMENTS/SAUCES, 2017 - 2029
- Figure 53:
- UNITED STATES WHEY PROTEIN INGREDIENTS MARKET, VALUE IN USD, CONDIMENTS/SAUCES, 2017 - 2029
- Figure 54:
- UNITED STATES WHEY PROTEIN INGREDIENTS MARKET, CONDIMENTS/SAUCES, VALUE SHARE (%), BY FORM, 2022 VS 2029
- Figure 55:
- UNITED STATES WHEY PROTEIN INGREDIENTS MARKET, VOLUME IN METRIC TONNES, DAIRY AND DAIRY ALTERNATIVE PRODUCTS, 2017 - 2029
- Figure 56:
- UNITED STATES WHEY PROTEIN INGREDIENTS MARKET, VALUE IN USD, DAIRY AND DAIRY ALTERNATIVE PRODUCTS, 2017 - 2029
- Figure 57:
- UNITED STATES WHEY PROTEIN INGREDIENTS MARKET, DAIRY AND DAIRY ALTERNATIVE PRODUCTS, VALUE SHARE (%), BY FORM, 2022 VS 2029
- Figure 58:
- UNITED STATES WHEY PROTEIN INGREDIENTS MARKET, VOLUME IN METRIC TONNES, RTE/RTC FOOD PRODUCTS, 2017 - 2029
- Figure 59:
- UNITED STATES WHEY PROTEIN INGREDIENTS MARKET, VALUE IN USD, RTE/RTC FOOD PRODUCTS, 2017 - 2029
- Figure 60:
- UNITED STATES WHEY PROTEIN INGREDIENTS MARKET, RTE/RTC FOOD PRODUCTS, VALUE SHARE (%), BY FORM, 2022 VS 2029
- Figure 61:
- UNITED STATES WHEY PROTEIN INGREDIENTS MARKET, VOLUME IN METRIC TONNES, SNACKS, 2017 - 2029
- Figure 62:
- UNITED STATES WHEY PROTEIN INGREDIENTS MARKET, VALUE IN USD, SNACKS, 2017 - 2029
- Figure 63:
- UNITED STATES WHEY PROTEIN INGREDIENTS MARKET, SNACKS, VALUE SHARE (%), BY FORM, 2022 VS 2029
- Figure 64:
- UNITED STATES WHEY PROTEIN INGREDIENTS MARKET, VOLUME IN METRIC TONNES, PERSONAL CARE AND COSMETICS, 2017 - 2029
- Figure 65:
- UNITED STATES WHEY PROTEIN INGREDIENTS MARKET, VALUE IN USD, PERSONAL CARE AND COSMETICS, 2017 - 2029
- Figure 66:
- UNITED STATES WHEY PROTEIN INGREDIENTS MARKET, PERSONAL CARE AND COSMETICS, VALUE SHARE (%), BY FORM, 2022 VS 2029
- Figure 67:
- UNITED STATES WHEY PROTEIN INGREDIENTS MARKET, VOLUME IN METRIC TONNES, BY SUB END USER, 2017 - 2029
- Figure 68:
- UNITED STATES WHEY PROTEIN INGREDIENTS MARKET, VALUE IN USD, BY SUB END USER, 2017 - 2029
- Figure 69:
- UNITED STATES WHEY PROTEIN INGREDIENTS MARKET, VALUE SHARE (%), BY SUB END USER, 2017 VS 2023 VS 2029
- Figure 70:
- UNITED STATES WHEY PROTEIN INGREDIENTS MARKET, VOLUME SHARE (%), BY SUB END USER, 2017 VS 2023 VS 2029
- Figure 71:
- UNITED STATES WHEY PROTEIN INGREDIENTS MARKET, VOLUME IN METRIC TONNES, BABY FOOD AND INFANT FORMULA, 2017 - 2029
- Figure 72:
- UNITED STATES WHEY PROTEIN INGREDIENTS MARKET, VALUE IN USD, BABY FOOD AND INFANT FORMULA, 2017 - 2029
- Figure 73:
- UNITED STATES WHEY PROTEIN INGREDIENTS MARKET, BABY FOOD AND INFANT FORMULA, VALUE SHARE (%), BY FORM, 2022 VS 2029
- Figure 74:
- UNITED STATES WHEY PROTEIN INGREDIENTS MARKET, VOLUME IN METRIC TONNES, ELDERLY NUTRITION AND MEDICAL NUTRITION, 2017 - 2029
- Figure 75:
- UNITED STATES WHEY PROTEIN INGREDIENTS MARKET, VALUE IN USD, ELDERLY NUTRITION AND MEDICAL NUTRITION, 2017 - 2029
- Figure 76:
- UNITED STATES WHEY PROTEIN INGREDIENTS MARKET, ELDERLY NUTRITION AND MEDICAL NUTRITION, VALUE SHARE (%), BY FORM, 2022 VS 2029
- Figure 77:
- UNITED STATES WHEY PROTEIN INGREDIENTS MARKET, VOLUME IN METRIC TONNES, SPORT/PERFORMANCE NUTRITION, 2017 - 2029
- Figure 78:
- UNITED STATES WHEY PROTEIN INGREDIENTS MARKET, VALUE IN USD, SPORT/PERFORMANCE NUTRITION, 2017 - 2029
- Figure 79:
- UNITED STATES WHEY PROTEIN INGREDIENTS MARKET, SPORT/PERFORMANCE NUTRITION, VALUE SHARE (%), BY FORM, 2022 VS 2029
- Figure 80:
- UNITED STATES WHEY PROTEIN INGREDIENTS MARKET, MOST ACTIVE COMPANIES, BY NUMBER OF STRATEGIC MOVES, 2017 - 2022
- Figure 81:
- UNITED STATES WHEY PROTEIN INGREDIENTS MARKET, TOTAL NUMBER OF STRATEGIC MOVES, 2017 - 2022
- Figure 82:
- UNITED STATES WHEY PROTEIN INGREDIENTS MARKET SHARE(%), BY KEY PLAYERS, 2021
US Whey Protein Ingredients Industry Segmentation
Concentrates, Hydrolyzed, Isolates are covered as segments by Form. Animal Feed, Food And Beverages, Personal Care And Cosmetics, Supplements are covered as segments by End User.| Form | |
| Concentrates | |
| Hydrolyzed | |
| Isolates |
| End User | |||||||||||
| Animal Feed | |||||||||||
| |||||||||||
| Personal Care And Cosmetics | |||||||||||
|
Market Definition
- End User - The Protein Ingredients Market operates on a B2B basis. Food, Beverages, Supplements, Animal Feed, and Personal Care & Cosmetic manufacturers are considered to be end-consumers in the market studied. The scope excludes manufacturers buying liquid/dry whey to be used for application as a binding agent or thickener or other non-protein applications.
- Penetration Rate - Penetration Rate is defined as the percentage of Protein-Fortified End User Market Volume in the Overall End User Market Volume.
- Average Protein Content - It is the average protein content present in per 100 g of product manufactured by all end-user companies considered under the scope of this report.
Research Methodology
Mordor Intelligence follows a four-step methodology in all our reports.
- Step-1: Identify Key Variables: The quantifiable key variables (industry and extraneous) pertaining to the specific product segment and country are selected from a group of relevant variables & factors based on desk research & literature review; along with primary expert inputs. These variables are further confirmed through regression modeling (wherever required).
- Step-2: Build a Market Model: In order to build a robust forecasting methodology, the variables and factors identified in Step-1 are tested against available historical market numbers. Through an iterative process, the variables required for market forecast are set and the model is built on the basis of these variables.
- Step-3: Validate and Finalize: In this important step, all market numbers, variables and analyst calls are validated through an extensive network of primary research experts from the market studied. The respondents are selected across levels and functions to generate a holistic picture of the market studied.
- Step-4: Research Outputs: Syndicated Reports, Custom Consulting Assignments, Databases & Subscription Platforms


